A Study of Carbon Features in Type Ia Supernova Spectra
Abstract
One of the major differences between various explosion scenarios of Type Ia supernovae (SNe Ia) is the remaining amount of unburned (C+O) material and its velocity distribution within the expanding ejecta. While oxygen absorption features are not uncommon in the spectra of SNe Ia before maximum light, the presence of strong carbon absorption has been reported only in a minority of objects, typically during the pre-maximum phase. The reported low frequency of carbon detections may be due to low signal-to-noise data, low abundance of unburned material, line blending between C II 6580 and Si II 6355, ejecta temperature differences, asymmetrical distribution effects, or a combination of these. However, a survey of published pre-maximum spectra reveals that more SNe Ia than previously thought may exhibit C II 6580 absorption features and relics of line blending near 6300 Å. Here we present new SN Ia observations where spectroscopic signatures of C II 6580 are detected, and investigate the presence of C II 6580 in the optical spectra of 19 SNe Ia using the parameterized spectrum synthesis code, SYNOW. Most of the objects in our sample that exhibit C II 6580 absorption features are of the low-velocity gradient subtype. Our study indicates that the morphology of carbon-rich regions is consistent with either a spherical distribution or a hemispheric asymmetry, supporting the recent idea that SN Ia diversity may be a result of off-center ignition coupled with observer line-of-sight effects.
Subject headings:
supernovae: general supernovae: individual (SN 2010Y, 2010ai, PTF10icb)1. Introduction
The typical pre-maximum SN Ia spectrum consists of overlapping P-Cygni profiles of intermediate-mass elements (IMEs) and Fe-peak elements (IPEs) that indicate expansion velocities on the order of 104 km s-1 (Filippenko, 1997). Photometric properties of the rise, peak, and decline of a SN Ia light curve can be explained by assuming that a substantial amount of 56Ni, synthesized in the explosion, powers the SN luminosity (Colgate & McKee, 1969; Arnett, 1982). Consequently, results of spectroscopic and photometric studies have supported the idea that SNe Ia are the outcome of a thermonuclear explosion of a C+O white dwarf in a binary system (Hoyle & Fowler, 1960; Nomoto et al., 1984; Elias et al., 1985; Iben, 1988; Nomoto et al., 2003; Chen & Li, 2009; Howell, 2010).
The explosion mechanisms that have been proposed differ by how the thermonuclear flame is propagated through the star’s interior; i.e., a sub-sonic deflagration via thermal conductivity or a super-sonic detonation due to strong shock burning. Pure detonation models appear unlikely since they conflict with observations by producing too much 56Ni, not enough IMEs, and leaving very little unburned material behind (Arnett, 1969; Branch & Khokhlov, 1995). On the other hand, while pure deflagration models may account for fainter SN Ia events, they are energetically weak, leaving too much material unburned to represent the majority of SNe Ia (Travaglio et al., 2004; Gamezo et al., 2005; Kozma et al., 2005). Thus, a deflagration that transitions into a detonation may be necessary in order to attain the nucleosynthetic yields that are consistent with the observations (Khokhlov, 1991; Höflich et al., 1995; Kasen et al., 2009; Maeda et al., 2010a).
Additional facets of modeling (e.g., multidimensional considerations) will affect the abundance tomography as well (Woosley et al., 2009). This can make it difficult to distinguish the dominant sources of SN Ia diversity. For certain, however, one similarity between all explosion models is the existence of burned (ash) and unburned material (fuel). By using spectroscopic signatures of C and O at pre-maximum epochs, one can infer the amount and velocity structure of the outer, unburned material.
Some of the unburned material may be subject to a degree of downward mixing toward the inner ejecta when burning becomes turbulent and enters the distributed flame regime (Pope, 1987; Niemeyer, 1998; Aspden et al., 2010). As of a result, it is not certain whether regions of unburned material are strictly located in the outer layer or mixed within the rest of the ejecta, nor is the mass range of unburned material from these thermonuclear explosions known (Baron et al., 2003). Therefore, the rate of detection of unburned material and its phenomenological details is of great importance for constraining how much material remains unburned in the explosion models.
The most prominent oxygen line in the optical spectra of SNe Ia is O I 7774. Unfortunately, since oxygen is a product of carbon burning, oxygen absorption lines are likely to be a biased reference for measuring the location of unburned material. Thus one must look to carbon absorption features as a tracer for unburned material. While it is not uncommon for oxygen to be present in SN Ia spectra (Branch et al., 2006), signatures of carbon have only been sporadically reported in SN Ia spectra, most often during the pre-maximum phase.
For the typical ejecta temperatures seen in SNe Ia (10,000 K), the dominant ionization state of carbon is C II (Tanaka et al., 2008). At this temperature, the strongest optical line of C II is that of 6580 (Hatano et al., 1999b). When seen, this line produces a blue-shifted absorption near 6300 Å that sometimes blends with the neighboring emission component of the Si II 6355 P-Cygni profile, thus making C II identifications problematic. There are well observed SNe Ia where C II 6580 is clearly present (Patat et al., 1996; Mazzali, 2001; Garavini et al., 2005; Hicken et al., 2007; Thomas et al., 2007; Yamanaka et al., 2009b; Scalzo et al., 2010), however in general, C II absorption is often weak and/or blended and therefore not a conspicuous SN Ia feature (Salvo et al., 2001; Branch et al., 2003; Stanishev et al., 2007).
A number of factors intrinsic to the explosion itself may contribute to the strength of C II 6580 and whether or not carbon features show up in SN Ia spectra. These include the asymmetrical distribution of carbon, the extent of carbon burning, the temperature of the carbon-rich region, and the possible formation of an envelope of unburned material though a merger of two white dwarfs (Thomas et al., 2007; Tanaka et al., 2008; Scalzo et al., 2010). Low signal-to-noise spectra and effects of line formation may also obscure weak C II 6580 absorption features, thereby complicating the rate of detection further.
In an attempt to better understand spectroscopic carbon signatures in the pre-maximum optical spectra of SNe Ia, we present a comparative study of 16 SNe Ia where a C II 6580 absorption signature is evident, plus three additional cases where it may be present. Then using the spectrum synthesis code, SYNOW, we fit this sample of SN Ia spectra thereby mapping the velocity distribution of carbon-rich regions that give rise to C II 6580 absorption features. To ensure a consistent analysis, we generated synthetic spectra for each of the time-series spectra in our sample.
The new and archival data used in this study are presented in §2. We review SN Ia subtype classifications in §3, and in §4 we discuss the spectrum fitting methods implemented with the SYNOW model, followed by our results in §5. We discuss our results in §6 in the context of recent findings on the diversity of SNe Ia and conclude in §7 with our results regarding of the nature of C II absorption features.
2. Data
Low signal-to-noise (S/N) SN Ia spectra make investigations of any suspected C II absorption features difficult. Therefore, with the possibility of carbon features being both weak and blended with Si II 6355, well observed multi-epoch confirmations of any suspected C II 6580 signatures were preferred for analysis.
In constructing our data sample, we have included only SNe Ia where at least two consecutive spectra showed the presence of a 6300 Å absorption signature, indicating a likely C II 6580 absorption feature. In addition, if the C II feature was not seen before maximum light, then we did not include those SNe in our sample since this region of the spectrum becomes contaminated by neighboring Fe II lines within a week after maximum light (Branch et al., 2008). The two exceptions are the single epoch spectra of PTF10icb and the 2002cx-like, SN 2008ha, where the C II 6580 signature is evident.
2.1. New Observations
Pre-maximum optical spectra of SN 2010Y, 2010ai, and PTF10icb show absorptions likely due to C II 6580 and thus we included these in our sample. These data were reduced using standard IRAF procedures, were corrected for host galaxy redshift and are presented in Figure 1 and Table 1. We used the spectrum-comparison tool, SNID (Blondin & Tonry, 2007), to estimate the age of each spectrum relative to maximum light.
Three spectra for SN 2010Y covering days 7, 6, and 3 with respect to maximum light were obtained using a Boller & Chivens CCD spectrograph (CCDS) on the 2.4 m Hiltner telescope at the MDM Observatory on Kitt Peak, Arizona. These spectra show the emergence of a relatively weak yet persistent 6330 Å absorption feature. Two additional spectra were taken on day 2 and 1 and were acquired with the 9.2 m Hobby-Eberly Telescope (HET) (Ramsey et al., 1998) at the McDonald Observatory using the Marcario Low-Resolution Spectrograph (LRS, Hill et al. 1998). By day 2, the 6330 Å feature peaked in intensity and began to fade by day 1.
Low resolution optical spectra of SN 2010ai were also obtained with HET. Spectra were taken well before maximum light on days 10 and 8. These spectra show signs of a flux depression in the emission component of the Si II 6355 P-Cygni profile, suggesting the presence of C II 6580 absorption.
Additional data comes from the discovery of PTF10icb by The Palomar Transient Factory (Nugent et al., 2010). A low-resolution follow-up spectrum was obtained with the LRS on HET on June 3. The spectrum-comparison tool, SNID, identifies the spectrum of PTF10icb as that of a normal SN Ia near day 10. Similar to SN 2010Y and 2010ai, the spectrum of PTF10icb also exhibited a 6330 Å absorption feature.
2.2. Archival Data
In Table 2, we list these three recent objects along side 65 SNe Ia found in the literature with pre-maximum or near maximum light spectra. These 68 SNe have been organized by the subtype scheme of Benetti et al. (2005) and are labeled by the classification subtypes of Branch et al. (2006) (see §3). Since the progenitor channel and the origin of C II 6580 absorption features may differ for Super-Chandra SNe Ia, we separate SN 2003fg, 2006gz, 2007if and 2009dc as possible Super-Chandra candidates. We have also grouped SN 2000cx, 2002bj, 2002cx, 2007qd and 2008ha as miscellaneous objects since their classifications as SN Ia-like events are still under debate (Valenti et al., 2009; McClelland et al., 2010; Poznanski et al., 2010).
Optical spectra for all but three SNe Ia in our sample were obtained from the Supernova Spectrum Archive (SuSpect111http://nhn.ou.edu/suspect) and sources therein. All spectra have been corrected for host galaxy redshift and normalized according to the formula given by Jeffery et al. (2007) in order to remove the underlying continuum since in this study we are only concerned with the position of the C II 6580 absorption minimum and not absolute flux. The inclusion of SN 2008ha is for comparison purposes only and not meant to contribute to the discussion of carbon-rich regions of normal SNe Ia.
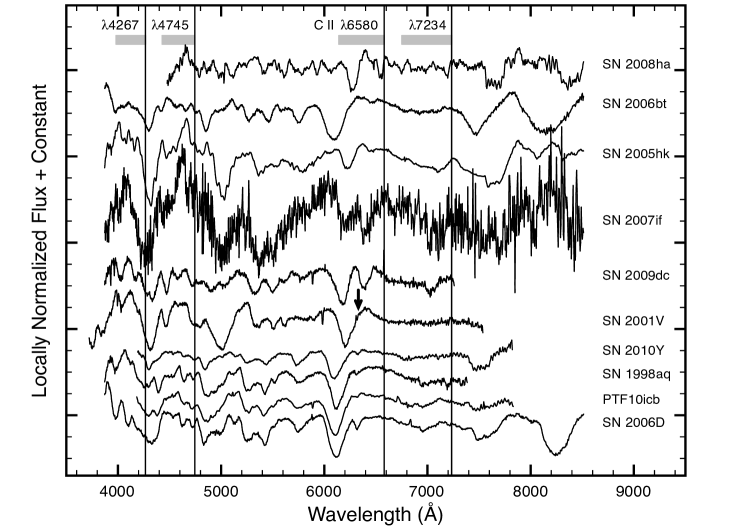
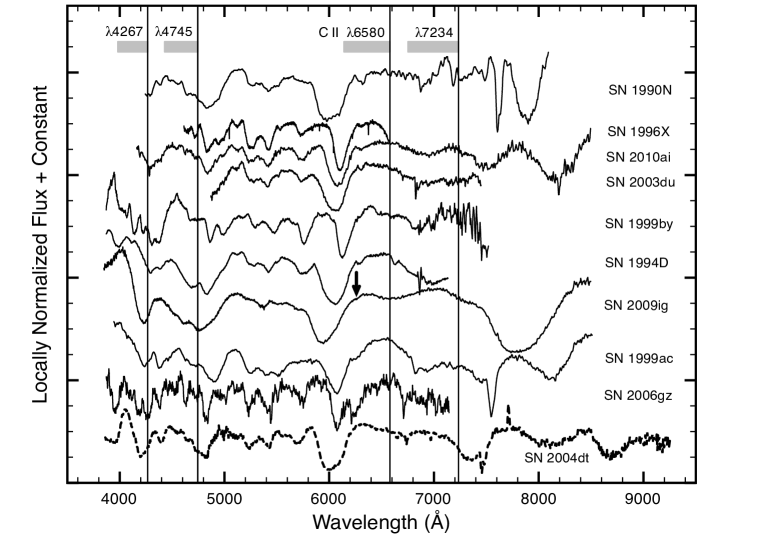
In Figure 2, we present a single pre-maximum spectrum of the 19 SNe Ia in our sample that show evidence of a C II 6580 absorption signature. Under the assumption of local thermodynamic equilibrium at 10,000 K, the strongest four optical lines of C II are 4267, 4745, 6580, and 7234, with the 6580 Å line being the strongest. Rest frame positions of these lines are represented as vertical lines in Figure 2 and the four grey bands at the top indicate Doppler velocities of 100020,000 km s-1. This corresponds to a region spanning 440 Å wide and blueward of 6580 Å, well within the extent of typical Si II 6355 P-Cygni profiles.
In Table 2 we also note the epoch of the earliest spectrum taken and how likely a C II 6580 detection is for each SN Ia (see §5.2). If both C II 6580 and 7234 absorption features are present or if the C II 6580 is an obvious notch, then we denote the detection as “Definite”. If a weaker notch is seen, and both absorption wings remain, then the detection is labeled as “Probable”. If a 6300 Å feature comes in the form of a “slump” on the emission component of Si II 6355, then we note the C II 6580 detection as “Possible”. Some of the published data have S/N ratios that prevent making a clear case for C II 6580 detection and we note these as “Uncertain”. If none of these criteria are met, then there is “No” detection.
3. SNe Ia: Subtype Classes
The observed diversity of SNe Ia has been subdivided based on photometric and spectroscopic properties by Benetti et al. (2005) and Branch et al. (2006). Below we briefly describe these classification schemes which will be referred to in our analysis.
Benetti et al. (2005) grouped 26 SNe Ia according to two photometric and three spectroscopic observables, namely (1) the decline in magnitude of the B-band 15 days after B-band maximum (Phillips, 1993), (2) the peak B-band magnitude, (3) the Si II expansion velocity rate of decrease, (4) (Si II) the expansion velocity of Si II 6355 10 days after maximum light, and (5) the ratio of 5972, 6355 absorption depth measured at maximum light (Nugent et al., 1995; Bongard et al., 2008).
With a sample of 26 SNe Ia, they found that SNe Ia could be organized into three discrete subtypes that were functions of velocity gradient and luminosity, namely (1) high-velocity gradient (HVG), (2) low-velocity gradient (LVG), and (3) FAINT. The subtypes HVG and LVG were mainly distinguished by having values above or below 70 km s-1 day-1, respectively, while the SNe in their sample with 18.20 were labeled as FAINT.
Branch et al. (2006) took a purely spectroscopically based approach, classifying 24 SNe Ia (later 65 SNe; see Branch et al. 2009) by the equivalent width of features near 5750 Å and 6100 Å which are usually attributed to Si II 5972, 6355, respectively. When SNe Ia are arranged in this manner, the objects can be subdivided roughly into four spectroscopic subtypes: (1) Core-Normal (CN) SNe Ia consist of objects such as SN 1994D, where from pre-maximum to 1-week post-maximum spectra are dominated by lines of Ca II, Fe II, Fe III, Mg II, O I, S II, Si II, and Si III, (2) Broad-Line (BL) SNe Ia are similar to CNs but instead display noticeably broader lines with higher average Doppler velocities, (3) Cool (CL) 1991bg-like spectra which exhibit low ionization energy ions such as Ti II, along with an increased ratio between the 5750 and 6100 Å features, and (4) Shallow Silicon (SS) 1991T-likes display mostly high ionization energy ions, such as Fe III, in their pre-maximum spectra and are accompanied by weak S II absorption features.
We note that comparing the sample of SNe Ia used in both studies shows that FAINT and HVG objects are equivalent to CL and BL respectively, and the LVG objects are equivalent to CN and SS subtypes (Branch et al., 2006). Since we are using subtype classes that are mostly based on spectroscopic properties of SNe Ia, our study cannot address issues regarding broadband photometric observations. A systematic study of both the spectroscopic and light-curve properties is difficult because these data can come from multiple sources and not every target we study here have both good spectroscopy and photometry. This type of study is better suited for the Nearby Supernova Factory (Aldering et al., 2002) and the Palomar Transient Factory (Rau et al., 2009), where the data sets are large and have good time-series coverage.
4. Spectrum Analysis Model: SYNOW
One way to infer the velocity range of unburned material is to measure the absorption minimum of the C II 6580 line. The observed minimum of this feature is often located near the strong emission component of Si II 6355, and is therefore subject to line blending and any limb-brightening that the Si II line contributes to the integrated spectrum (Höflich, 1990). Consequently, the observed minimum may underestimate the actual expansion velocity of the carbon-rich region. Therefore, in order to accurately estimate the true minimum of a blended line profile, one must take into account the effects of line formation by reconstructing the spectrum via numerical calculation.
While there have been several new and more detailed spectrum synthesis codes presented in the literature since the inception of SYNOW nearly thirty years ago, the SYNOW spectrum synthesis model remains a useful tool for the quick analysis of resonant scattering line profiles (Baron et al., 1994; Mazzali, 2000; Branch et al., 2007; Kasen et al., 2008; Baron et al., 2009). Therefore, we chose the less computationally intensive approach of SYNOW to produce results that were internally consistent when we compared the SNe Ia in our sample.
From a single-epoch optical spectrum, one can reproduce many of the conspicuous features seen in SNe of all subtypes using SYNOW. However, to have greater confidence in the identification of a spectroscopic feature, it is best to have a time series of closely spaced spectra in order to follow the evolution of both the observations and the fit. Because we wish to probe the nature of C II 6580 features in SNe Ia, we required fitting all spectra for the duration of time in which the 6300 Å features could be seen.
In SYNOW, one computes a spectrum by specifying the location and optical depth for a given set of ions. This allows one to infer spectral line identifications by directly fitting to a series of observed spectra. While SYNOW does not calculate relative abundances of various elements, it is instructive at reconstructing the complex spectroscopic profiles brought about by multiple line scattering that is inherent to moving media.
The version of the SYNOW model that we used can be described as follows: (1) a spherically symmetric and homologously expanding ejecta is modeled using a v r law, (2) light is emitted from a sharp photosphere, (3) optical depth, , is a function of velocity as either , , or where each of these functions are characterized by indices n, ve, and respectively, (4) line formation is purely due to resonant scattering and is treated using the Sobolev Approximation (Sobolev, 1957; Jeffery & Branch, 1990), and (5) for a given ion a reference line profile is calculated for a given and the remaining lines follow from Boltzmann statistics. Input parameters for a SYNOW spectral fit include: (i) a photospheric velocity (vphot), (ii) reference line and minimum/maximum velocities for each ion, and (iii) excitation temperature, , to determine LTE level populations with respect to a reference line.
As was done in the SN Ia comparative study of Branch et al. (2005), for our invesitigation we too left the excitation temperature at 10,000 K for each ion. We also chose to use the exponential form of the optical depth profile with ve = 1000 km s-1. This aided in limiting the number of free parameters for a spectral fit.
Because SYNOW assumes spherical symmetry, we are limited when investigating the possible asymmetrical distributions of unburned material. If the distribution is that of a spherical layer, as is the case for the W7 model (Nomoto et al., 1984; Thielemann et al., 1986), then it is straightforward to make SYNOW model fits to compare with observations. In this case, the unburned material resides above the burned material in a spherical shell where the thickness depends on the extent of the burning. For W7, this boundary is roughly at 14,000 km s-1 with a stratified composition of IMEs and IPEs below.
Recent multidimensional models of delayed detonations suggest that the unburned material may be left behind in clumps throughout the ejecta (Gamezo et al., 2004). For the situation where the unburned material is heavily concentrated to a single clump structure, we can only utilize SYNOW in certain cases (see §5.4).
Observations have shown that there often exists higher velocity regions of line formation; namely Ca II and Si II (Hatano et al., 1999a; Kasen et al., 2003; Tanaka et al., 2010). Such regions are said to be from the photosphere. We note a noticeable facet that arises when fitting Si II 6355 profiles during the earliest epochs is that the absorption width, the slow rise of the blue wing, and the sharp rise of the red wing require two separate velocity components of Si II to achieve a good match to observations. At best, a single-component of Si II with an increased value of the optical depth profile indices can only properly fit the red wing of the 6355 Å absorption feature.
G. H. Marion et al. (2011, in preparation) discuss recent observations of the Type Ia event, SN 2009ig, where there is clear evidence for both a photospheric region and a high velocity region of Si II. In their SYNOW analysis, they used the two-component approach in following the evolution of the Si II 6355 feature, which produced a better fit overall. Similarly, we too have adopted a procedure of using two components of Si II that are separated by 40006000 km s-1 when necessary.
One consequence that detached ions have on the line profile is that the emission component of the line is flat-topped. Some of our spectroscopic fits in §5.3 detach Si II to better fit the absorption component, while forfeiting a comparable fit to the full emission component; e.g. our fit for SN 1999ac. The impact that detaching has towards blending with C II 6580 is minimal and only one of offsetting the prescribed value of for C II in the fit.
5. Results
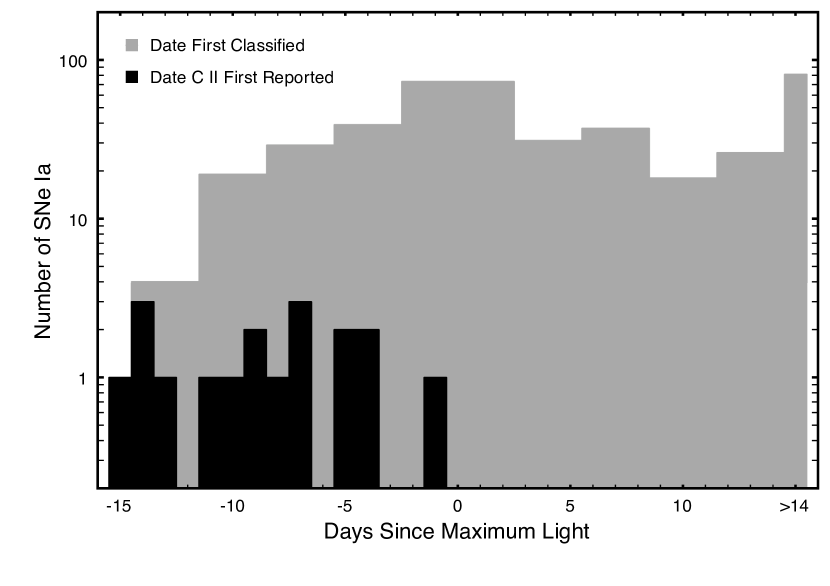
In terms of the spectroscopic diversity of SNe Ia, many of the differences are seen immediately after the explosion as the photosphere maps out the distribution of the outermost ejected material, with an increase toward spectroscopic conformity at later epochs (Branch et al., 2008). Unfortunately, as shown in Figure 3, SN Ia spectroscopic observations during the two weeks prior to maximum light are underrepresented compared to those taken near maximum light or at later times. In addition, absorption features attributed to C II 6580 are generally weak. As a result, they can be easily missed and thus go unreported or are not securely verifiable due to low S/N and/or line blending.
5.1. Frequency of C II Absorption Features
Our search of the literature revealed that 30% of SNe Ia with moderate to high S/N, pre-maximum spectra taken since 1983 January 1 show a feature near 6300 Å that may be associated with C II 6580 absorption (see Table 2; Definite + Probable). Because of the sparsity of optical spectra before peak brightness, this percentage may not represent the actual fraction of SNe Ia that exhibit C II 6580 signatures during the pre-maximum phase. Furthermore, the amount of published SN Ia data does not equal the amount of data taken, thereby placing considerable uncertainty on such an estimate.
For comparison, in Figure 3, we also tally and plot the total number of SNe Ia where C II 6580 was first detected with respect to maximum light. When the total number of published C II observations over the past couple decades is compared to the total number of SNe Ia discovered during the pre-maximum phase in a span of three years, the occurrence of absorption due to C II 6580 appears infrequent.
However, many SNe Ia might show C II (or C I, or C III; see §6.1) during the first weeks of the explosion, but may not exhibit strong, identifiable carbon absorption features by the time they are discovered and spectra taken. If spectra are not obtained prior to maximum light, this can lead to an under-reporting of C II SNe Ia cases. For example, in some objects, the C II features appear to fade by day 5 or even earlier. This raises the question: Might all SNe Ia show appreciable C II absorption at some level if observed at a sufficiently early enough epoch?
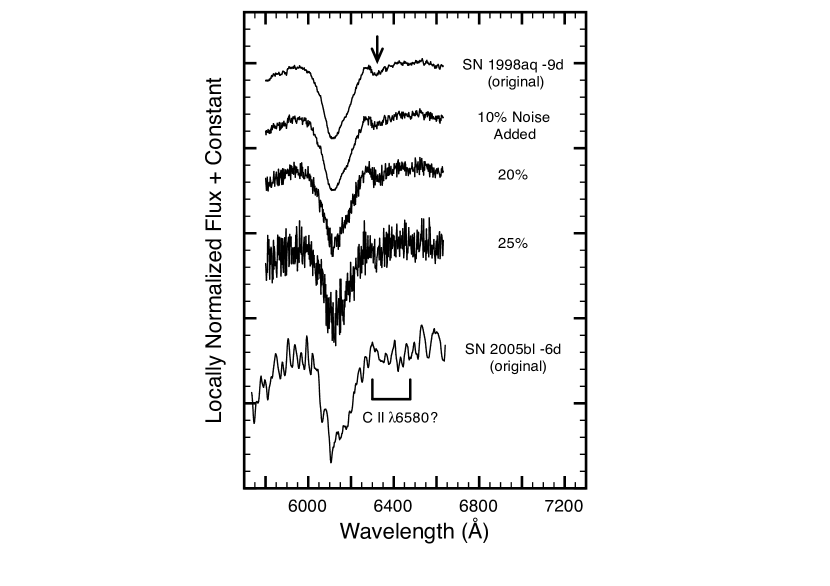
Given the weak impact that C II features are observed to have on the integrated optical spectrum, identifying every instance for when C II is present rests heavily on one’s ability to distinguish the signature from noise and the effects of line blending. In Figure 4, we compare the spectrum of SN 1998aq at day 9 to three cases where we have artificially added Gaussian noise to the original spectrum. With only 10% and 20% noise added, the C II 6580 feature remains distinguishable. However, at 25% the feature begins to lose its identity above the noise. An example of this is the spectrum of SN 2005bl at day 6, shown in Figure 4. Taubenberger et al. (2008) proposed a C II 6580 identification for the 6400 Å depression seen in the spectrum. However, we excluded this SN from our sample since we were not able to generate an accurate fit for the feature.
5.2. SNe Ia C II Features: Conspicuous to Weak
Like most features in the spectra of SNe Ia, the degree of adjacent line blending that C II 6580 absorption signatures undergo can obscure the full extent of a line profile. More often than not, the minimum of the C II 6580 line is blended with the P-Cygni emission component of the Si II 6355 line. The day 5 spectrum of SN 1999by is a good example of when this takes place (see Figure 2).
When the C II 6580 absorption feature is weak there is also often no obvious C II 7234 signature. However, when the C II 6580 feature is strong, a corresponding C II 7234 feature does begin to appear as the excited level of the 7234 Å line becomes more populated. There are several cases, such as SN 2006gz and 2007if, where C II 6580 is certainly present but either the wavelength coverage is incomplete or the spectrum is too noisy to say whether or not C II 7234 is present as well.
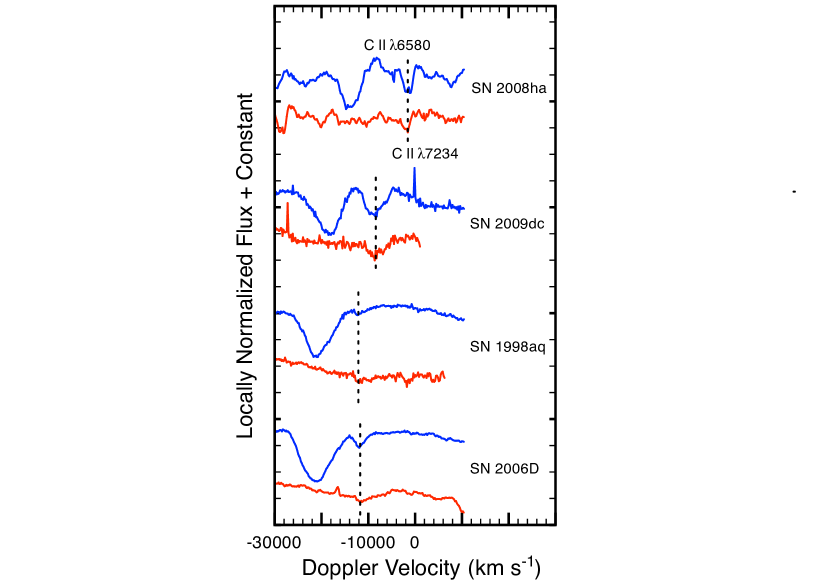
In Figure 5, we plot two spectral regions of four SNe Ia in Figure 2 that highlight cases when both of these C II lines are present. For each SN, the red and blue lines denote 6580, 7234 Doppler velocity-scaled spectra, respectively. The absorption minima overlap nicely (see dashed vertical lines) and the symmetry about the minima is indicative of a match between the spectral signatures of the same ion. We interpret this to mean that the 7234 Å line is indeed present when the 6580 Å line is strong. Currently, these two C II lines are the best means by which to securely identify whether carbon is present in the early-epoch SN Ia spectra.
The C II lines that appear further in the blue have also been suggested to be present as well (Thomas et al., 2007). However, this region is crowded by lines of IPEs making it more difficult to securely identify C II 4267, 4745 and use for determining accurate Doppler velocities. This appears to even be the case for SN 2006gz, 2007if, and 2009dc where the C II 6580 absorption is strong (Hicken et al., 2007; Scalzo et al., 2010; Taubenberger et al., 2011).
5.3. SYNOW Model Fitting
For each of the 19 SNe Ia in our C II sample, we produced a time series of synthetic optical spectra that covered the observed extent of the C II 6580 feature’s presence as well as the observed wavelength coverage of the data (35009000 Å). Our initial fits included the canonical set of IMEs and IPEs that are prevalent in pre-maximum SN Ia spectra, whereby afterward we included C II and adjusted the optical depth and detachment velocity until a match to observation was made. The goodness-of-fit to the observed Si II 6355 C II 6580 blended profiles did not change with the full set of IMEs and IPEs removed. Thus, for each SN in Table 3, we only list the relevant parameters for C II and Si II.
As was discussed above in §4, some of the observed Si II 6355 profiles required two separate components of Si II in order to fit the full width of the absorption. We indicate which SNe Ia in our sample required this fitting procedure by appending the inferred Doppler velocities and optical depths with “” in Table 3.
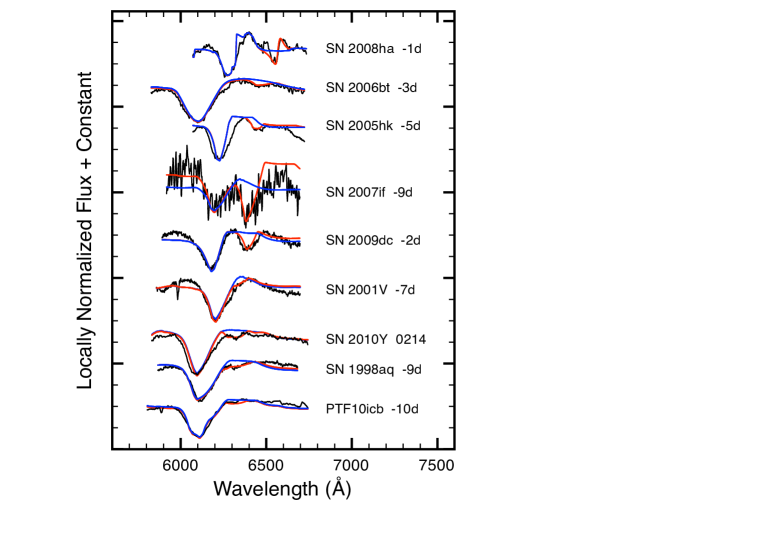
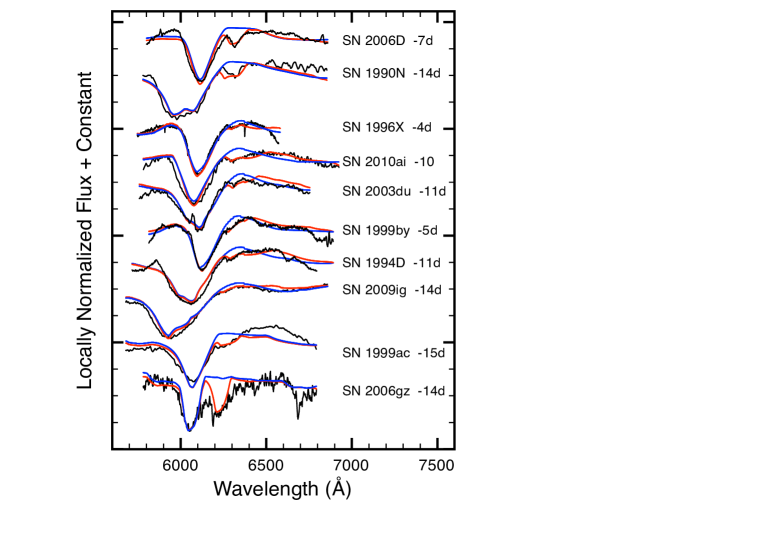
In Figure 6, we compare fits to a single observed spectrum for each of the SNe Ia in our sample. The black lines represent the observed spectra, the red lines are SYNOW fits where C II has been included, and the blue lines are the same fits without C II. The synthetic spectra match fairly well to a variety of Si II 6355 C II 6580 blended profiles, and the interpretation that the 6300 Å feature is due to C II 6580 is in agreement with that of previous authors (see references in Table 2).
In this study, we also offer new and revised expansion velocity estimates of C II for a couple SNe Ia, particularly SN 1990N and 1999by. It was suggested by Fisher et al. (1997) that the overly broadened 6040 Å absorption in the day 14 spectrum of SN 1990N was due to a two-component blend composed of Si II at 20,000 km s-1 and C II at 26,000 km s-1. Similarly, Mazzali (2001) suggested that this feature is predominantly due to Si II 6355 but also requires an outer zone of high velocity carbon between 19,000 and 30,000 km s-1. If this interpretation is correct, then other SNe Ia like SN 1990N would also require a similar zone of carbon to reproduce their early-epoch spectra. However, our fit for SN 1990N uses two components of Si II to fill the 6040 Å feature while C II is only at 16,000 km s-1 to account for the 6300 Å feature.
In the case of the sub-luminous SN 1999by, C II 6580 was not reported by Garnavich et al. (2004). However, our fit in Figure 6 is fairly convincing when C II is included as a detached layer 2000 km s-1 above the photosphere for the day 5 spectrum. In fact, almost 80% of the SNe in our sample suggest at least a mildly detached layer of C II during some point along the evolution of the absorption feature. For example, we modeled the C II in SN 1994D initially at 14,000 km s-1 coincident with at day 11, after which it remains at this velocity as the photosphere recedes to 12,000 km s-1 by day 5.
6. Discussion
The strength and velocity range of carbon in pre-maximum SNe Ia spectra can provide a valuable tool to investigate various explosion models. The W7 deflagration model, for instance, contains a 0.07 layer of unburned material above 14,000 km s-1. Using the spectrum synthesis and model atmosphere code, PHOENIX, Lentz et al. (2001) compared calculated non-LTE spectra to spectroscopic observations of the normal Ia event, SN 1994D. Despite the outer layer of unburned material in W7, none of their synthetic spectra were able to account for the observed C II 6580 absorption feature near 6290 Å. Our SYNOW fits for this object allow for C II below 14,000 km s-1. To that end, Tanaka et al. (2011) were able to reproduce a C II 6580 absorption feature seen in the day 11 spectrum of SN 2003du by placing the carbon-rich region at lower velocities in their version of W7. They obtained an upper limit on the abundance of carbon to be 0.016 at 10,500 km s-1 in this object.
At late-times and based on the three-dimensional deflagration models of Röpke (2005), Kozma et al. (2005) compared synthetic spectra to the late-time spectra of three SNe Ia and set an upper mass limit of unburned material below 10,000 km s-1 to be 0.07 . Other estimates for the mass of unburned material have been made using delayed-detonations (Höflich et al., 2002) and other modeling; e.g. lower limit of 0.014 of unburned material between 10,000 and 14,000 km s-1 for SN 2006D (Thomas et al., 2007). However, since each estimate is obtained by different means, a comparison of such results does not advance the discussion on the nature of C II 6580 absorption features.
In order to utilize C II 6580 absorption features for estimating the mass of unburned material, the effects of temperature and geometry of the carbon-rich regions as well as the influence of radiative transfer effects must be explored. Our SYNOW modeling begins this process by mapping the observed velocity distribution for a sample of 19 SNe Ia. Below, we discuss our interpretation of the observed frequency of C II absorption features and how they relate to the properties of carbon-rich regions and SN Ia diversity.
6.1. Temperature Effects on Carbon Features
The temperature of the carbon-rich region will influence whether or not C II is the dominant ionization species and will therefore dictate the strength of C II 6580 absorption features. Using non-LTE calculated spectra, Nugent et al. (1995) pointed out that the spectroscopic sequence observed among various SNe Ia could be explained by a continuous change in the effective temperature of the ejecta (740011,000 K), from cool 1991bg-likes to the hotter 1991T-likes (see their Fig. 1). While the ejecta of SNe Ia are an environment with non-LTE processes, under the assumption of a C+O-rich composition the Saha-Boltzmann equation indicates that carbon will mostly be in the form of C II between 6000 and 12,000 K.
Of the 68 SNe Ia listed in Table 2, 10 out of the 14 CNs and five out of the 13 CLs exhibit C II 6580 absorption features. From a nearly equal sampling of SN Ia subtypes, the fact that two CNs for every one CL SN Ia exhibit C II absorption lines suggests that the presence of C II absorption features depend on the effective temperature to some degree. This point is also consistent with the fact that only two of 13 SSs show signs of C II 6580 absorption features in their spectra.
We note that C I absorption features are not often detected in SN Ia spectra. Marion et al. (2006) presented NIR spectra of three normal SNe Ia and discussed the lack of C I absorption signatures due to the absence of the strongest C I NIR lines, namely C I 9093, 10691. A more extensive study of 41 SN Ia NIR spectra spanning two weeks before and after maximum light was discussed by Marion et al. (2009) and they too reported a lack of C I signatures. Because spectral signatures of carbon burning products were observed to occupy the same region of ejecta (Mg II and O I), Marion et al. (2006) concluded that nuclear burning had been complete out to at least 18,000 km s-1 in their objects.
It is perhaps not surprising that many NIR spectra of SNe Ia do not show lines from C I, given that (1) the abundance of carbon may be only 1-10% of the total ejected mass, and (2) if there is carbon present in the outer layers then it is mostly once ionized. Interestingly, however, Höflich et al. (2002) reported a conspicuous C I 10691 absorption feature in the day 4 NIR spectrum of SN 1999by. They were able to reproduce many features of the observed optical and NIR spectra using a series of sub-luminous delayed-detonation models with a range of transition densities, , between 827 106 g cm-3.
The appearance of the C I 10691 line was seen concurrently with the optical C II 6580 absorption feature we reported above in §5.3. Both the C I and C II spectral signatures indicated that the carbon-rich region was above the 12,000 km s-1 photosphere; i.e. the minimum of the C I 10691 absorption corresponds to 13,000 km s-1 while our SYNOW fits for this object place C II at 14,500 km s-1. At least for this cool sub-luminous SNe Ia, the influence of temperature on the ionization state of the carbon-rich region is apparent from the simultaneous appearance of C I and C II absorption features.
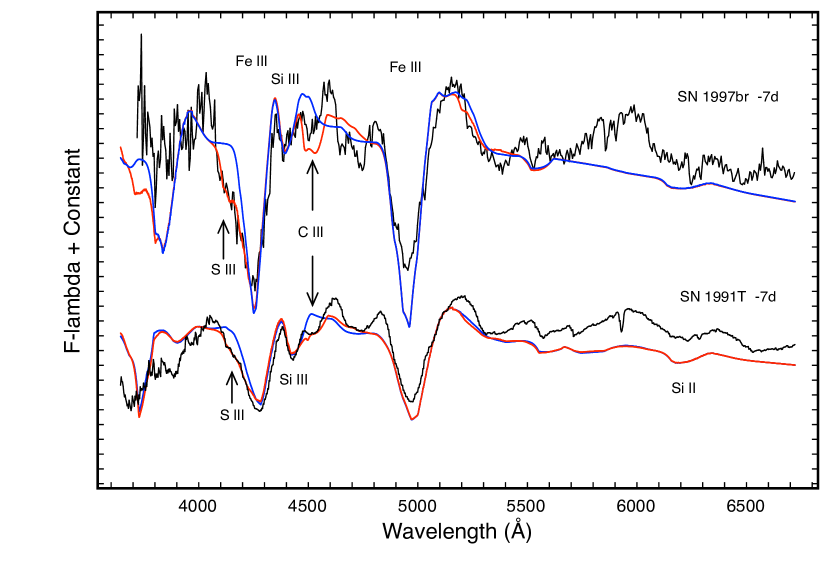
Additional evidence that ejecta temperature plays a role in the detection of carbon in SN Ia spectra would be if C III were clearly detected in a hotter SN Ia subtype, such as SN 1991T or SN 1997br. The similarity between the ionization potentials of C II (24.4 eV) and S II (23.3 eV) suggests that the presence of C III absorption features may be concurrent with spectroscopic signatures of S III. Fortunately, we can examine optical spectra to check for the simultaneous presence of C III 4649 and S III 4254 absorption features.
In Figure 7, we plot and compare SYNOW fits for SN 1991T and 1997br where we have included C III and S III. The identification of the 4500 Å feature of SN 1991T has been discussed before by Hatano et al. (2002), and similarly in other SN Ia (Garavini et al., 2004; Chornock et al., 2006). While it was argued by Hatano et al. (2002) that including C III in the fit produced a mis-match with the observed spectrum (too blue overall), our synthetic spectra (red lines) are in fair agreement with observations near 4500 Å for both SN 1991T and 1997br.
In addition, a better fit to the 4250 Å absorption feature is obtained with the inclusion of S III. The 4250 Å feature is predominately due to the Fe III 4404 multiplet. However, by adding S III to the fit we were able to fill in the blue wing of this absorption feature for both objects. Therefore, our identification for the 4500 Å absorption feature as being that of C III 4649 is more likely, though the evidence is circumstantial. If the C III 4649 identification is correct, then this may indicate that a lack of C II (or C I) spectroscopic features do not necessarily imply the complete burning of carbon in the hotter subtype events.
6.2. Interpreting C II 6580 Doppler Velocities
In this paper, our attention has been primarily focused on carbon-rich regions in the outermost ejecta. The wide range of observed C II Doppler velocities among different SNe Ia suggests a large variation in the extent of carbon burning, with some objects exhibiting velocity carbon while in others the carbon is present at velocities (see Table 3). How high or low is usually in reference to the position of the carbon cut-off seen in the W7 model (14,000 km s-1) instead of the kinetic energy of the supernova itself.
6.2.1 Extent of Burning via C II 6580
Given that the characteristic ejecta velocity is proportional to (Arnett, 1982), a standardized way of looking at the extent of burning is a more appropriate measure for interpreting the range of observed carbon velocities. The 6355 Å line of Si II has been used as an indicator of the photospheric velocity at early epochs (Jeffery & Branch, 1990; Patat et al., 1996). Choosing Si II 6355 over other lines alleviates any difficulty in obtaining Doppler velocities amid too much line blending and allows for consistent time-coverage. This makes the absorption minimum of Si II 6355 a good point of reference for investigating the extent of burning via C II 6580 absorption features before maximum light.
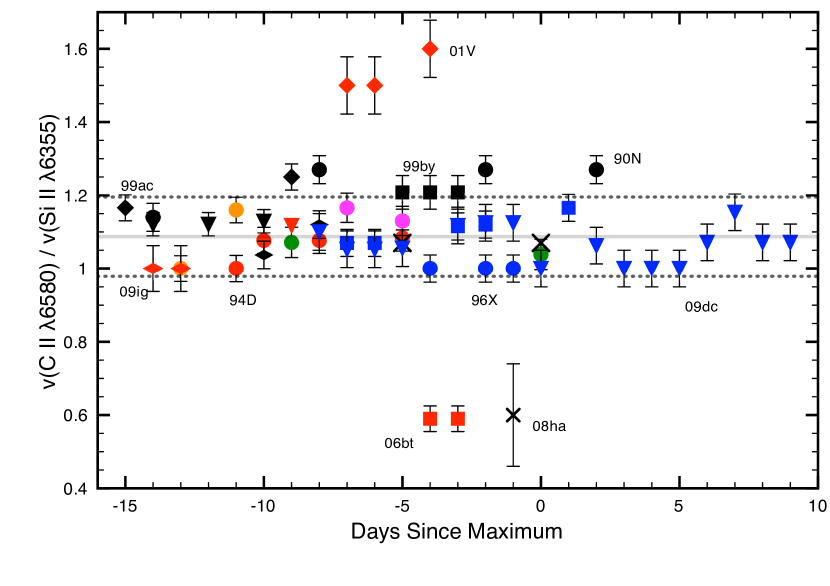
In Figure 8, we have the ratio of Doppler velocities, (C II 6580)/(Si II 6355), derived from our SYNOW fits plotted versus days relative to maximum light. This shows that (1) for an individual SN, the ratio remains at a fairly sustained value over time and (2) the different velocity ratios among the SNe lie roughly within the same region and are similar to within 10%. We have ignored the three outliers because one is in a region of the plot where line blending obscures the supposed C II 6580 detection (SN 2001V; see §6.2.2) and the other two objects suggest that the carbon is clumpy and not along the line-of-sight of the observer (SN 2006bt and SN 2008ha).
The notion of an optically thick photosphere in SNe is generally a good assumption, even though the line forming region may extend 500 km s-1 in either direction. Therefore, for a given spectrum, any velocities of an ion that are measured to be fairly below that of the photospheric velocity, vphot, may indicate ejecta asymmetries. That is, any observed discrepancy between vphot and vCII could be explained if the actual velocity of C II is the same as vphot but instead of forming in a shell at the observed velocity, the carbon is in a clump at vphot and offset by an angle, , from the line of sight. In particular, we can estimate this projection angle if vCII vphot. For SN 2006bt and SN 2008ha we calculate this projection angle to be 50∘ and 60∘, respectively, where our result for SN 2006bt is in agreement with Foley et al. (2010b).
If the dominant C II behavior is due to asymmetrical distributions of a single localized clump of unburned material, one could expect there to be more scatter below the mean that is presented in Figure 8 since an arbitrary orientation of the clump relative to the observer ought to lead to more cases where (C II 6580)/(Si II 6355) 1 (like SN 2006bt). Instead, what we find for the SNe in our sample is that the distribution of carbon-rich material is consistent with a layered or hemispheric geometry.
Another surprising aspect of Figure 8 is that the candidate Super-Chandra SNe Ia reside in the same region of the plot as the other objects. Scalzo et al. (2010) suggested that the large C II 6580 feature, concurrent with low velocities, could be explained by invoking a pre-explosion envelope of progenitor material originating from the merger of two white dwarfs. In this scenario, the explosion is inhibited by and loses kinetic energy to the envelope, ionizing the shell of surrounding carbon. Whatever the nature of carbon-rich regions in these three SNe Ia, it is also constrained by the value of (C II 6580)/(Si II 6355).
6.2.2 Consequences of Line Blending
Toward the uppermost region of Figure 8, there is a noticeable lack of highly detached C II objects with time-series coverage that exhibit pre-maximum C II 6580 absorption features. This does not necessarily imply that carbon-rich regions in SNe Ia are absent above a particular velocity. Rather, the “missing” subset of objects may be a result of SNe Ia with lower density carbon-rich regions further out and/or radiative transfer selection effects; e.g. line blending.
Most of the SNe Ia in our sample that exhibit C II 6580 absorption features are of the LVG subtype while only one is an HVG event (SN 2009ig). This is either a real trend of C II 6580 absorption features and therefore a diagnostic of SN Ia diversity, or a result of line blending due to very high velocities of carbon-rich regions. In regards to the latter cause, some SNe Ia might contain a C II 6580 absorption feature in their spectra but its presence is obscured by the Si II 6355 absorption trough, particularly for HVGs.
Assuming that the scatter of (C II 6580)/(Si II 6355) values in Figure 8 is the same for both HVG and LVG subtypes, and assuming that HVGs span a -space from 14,000 to 16,000 km s-1, then the minimum of any C II 6580 signature would be between 61206280 Å. If weak and blue-shifted to these wavelengths, the C II 6580 absorption would most likely go undetected. If the C II optical depth were large enough, then the most direct evidence for hidden C II 6580 would be whether or not an associated absorption from C II 7234 could be seen between 67306900 Å.
This raises the question: At what velocity will C II 6580 completely blend with Si II ? In Figure 6, we presented observed C II 6580 blending scenarios where the signature is weak and nearly hidden, such as possibly observed in SN 2001V and 2009ig. These objects suggest that C II 6580 absorption features can in some cases be obscured via line blending. Such a “hidden” C II signature would be seen in the form of an absorption on the shoulder on the blue wing of the Si II 6355 emission component.
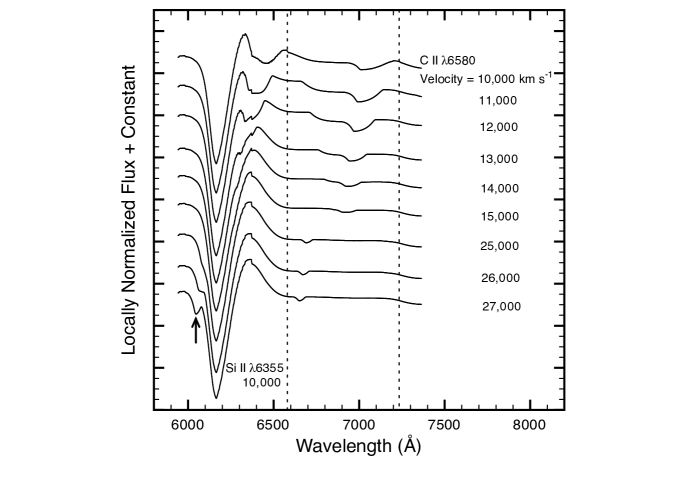
A series of synthetic spectra that include only blends of Si II 6355 and C II 6580 line profiles are shown in Figure 9 (top panel). For these SYNOW spectra, the velocity of Si II was fixed at 10,000 km s-1 while the velocity of C II was increased from this 10,000 km s-1 by 1000 km s-1 increments up to a velocity of 15,000 km s-1. We simultaneously decreased the optical depth in keeping consistency with the observed profile shapes. At a velocity of 15,000 km s-1, C II 6580 loses its discernibility as a feature and remains hidden until C II reaches a velocity of 27,000 km s-1. At present there are no observations reporting a C II 6580 feature appearing blue-ward of the Si II 6355 absorption.
Aside from being able to account for the observed variety of C II absorption profile shapes and velocities with respect to Si II 6355, in Figure 9 we also show that the shoulder effect can be reproduced when C II is detached with a velocity 4000 km s-1 greater than that of Si II. This is consistent with our fit for SN 2001V where we have C II and Si II at 12,000 and 8000 km s-1, respectively.
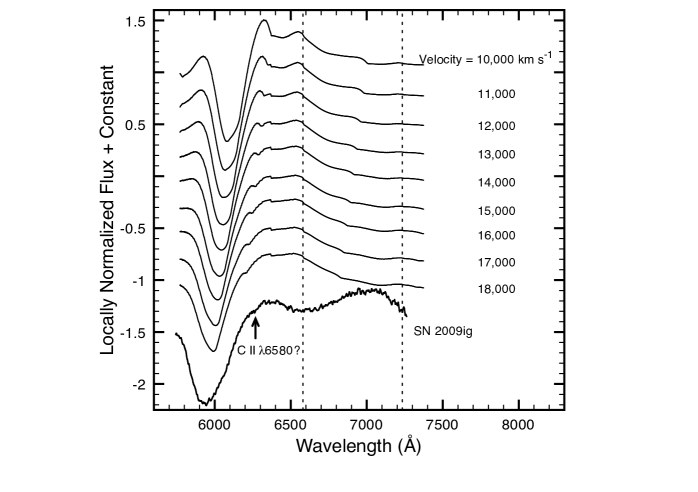
In Figure 9 (bottom panel), we show a series of synthetic spectra where C II and Si II are placed at the same velocity and increased in sequence from 10,000 to 18,000 km s-1. We modeled the Si II profiles using the two-component method so as to reproduce HVG-like properties. As can be seen, the C II 6580 absorption feature can be easily obscured at higher velocities. The proposed weak C II 6580 feature for SN 2009ig lies atop the emission component of Si II 6355 and is consistent with this series of synthetic spectra.
It is generally thought that the infrequent number of HVGs where C II 6580 is detected suggests an environment of sparse carbon-rich regions (Pignata et al., 2008). However, if the proposed C II 6580 signature in SN 2009ig is correct, then our fits suggest that the feature could be weak based on line blending, and not necessarily due to a low carbon abundance (or lower than that of LVGs) alone.
6.3. Asymmetries in the Distribution of C II Regions
Because the ejected material follow a homologous expansion law (), the degree to which electron scattering will polarize emergent light across a spectral line can provide geometrical information on the material between the observer and the photosphere (Shapiro & Sutherland, 1982; Wang & Wheeler, 2008). Spectropolarimetry of some SNe Ia have revealed that the distribution of the outermost ejected material has an overall deviation from spherical symmetry of up to 10% (Höflich, 1991; Wang et al., 1997). Specifically, optical Si II P-Cygni profiles are observed to have peak polarization values of 0.32.0%, five days before maximum light (Wang et al., 2007). Other absorption features, such as the Ca II IR triplet, have also been observed to be strongly polarized (Wang et al., 2003; Kasen et al., 2003).
Of the 19 SNe Ia in our sample, only SN 1994D, 1999by and 2005hk have nearly simultaneous spectroscopic and polarization data during the presence of a C II 6580 absorption feature. Polarization levels for these objects across Si II 6355 were reported as insignificant (0.3% for SN 1994D, Wang et al. 1996; 0.4% for SN 1999by, Howell et al. 2001; 0.4% for SN 2005hk, Chornock et al. 2006), whereas the degree of polarization was even less in the region of the C II 6580 signature.
Regarding SN 1999by, the three spectropolarimetric observations of Howell et al. (2001) were combined from data taken on days 2, 1 and 0 in order to increase the S/N ratio (see their Fig. 2). The resultant spectrum exhibited the same 6300 Å absorption feature that we attributed to C II 6580 in the day 5, 4 and 3 spectra of Garnavich et al. (2004), but the concurrent polarimetry data of Howell et al. (2001) did not show any significant amount of polarization near the feature. This would suggest that the C II regions are roughly spherical in at least these objects. However, because spectropolarimetric observations are most useful when a spectral line is strong and the S/N is high, it is difficult to use the weak C II 6580 absorption features of SNe Ia to infer asymmetries of carbon-rich regions with polarization data. Despite this, possible asymmetries of carbon-rich regions might be gleaned through other means.
Recently, Maeda et al. (2010b) discussed SN Ia diversity in the context of global asymmetries of ejected material. They argued that the HVG and LVG subtypes constitute a picture of SNe Ia in terms of an off-center delayed-detonation at different viewing angles. In this scenario, an off-center ignition is followed by the propagation of a sub-sonic deflagration flame that imprints an off-set distribution of high density ash. Once the transition to detonation occurs, a super-sonic flame only successfully burns material in the lower density regions and is effectively screened by some of the deflagration ash. What remains is a lopsided distribution of burning products, resulting in a hemispheric asymmetry of the ejecta. Similarly, Maund et al. (2010) reached the same conclusion regarding SN Ia diversity after examining a possible relationship between HVG/LVG subtypes and the possible asymmetrical distribution of photospheric Si II.
In this model, LVGs correspond to viewing the hemisphere of ejecta that coincides with the off-center ignition, whereas HVGs are the contrary with an opening angle of 7075∘. Since we do not see a predominate number of HVGs with conspicuous C II 6580 features in our sample, this is consistent with the above model, owing to the fact that detonation waves ought to leave little unburned material behind on the HVG side. If Maeda et al. (2010b) is correct, and if our sample of SN Ia that exhibit C II 6580 is representative, then this suggests that the filling factor of carbon in the LVG hemisphere is less than unity.
7. Conclusions
In an effort to better understand the frequency and general properties of C II absorption features, we examined C II 6580 signatures in the pre-maximum spectra of 19 SNe Ia, of which included 14 “normal” SNe Ia, three possible Super-Chandra SNe Ia, and two 2002cx-like events. Using SYNOW to produce synthetic spectra, we modeled observed 6300 Å absorption features as a C II 6580 P-Cygni profile blended with that of Si II 6355. Through our SYNOW model fits we estimated the C II expansion velocities for a variety of objects. Below is a summary of our major findings:
-
1.
A survey of the optical spectra of 68 objects published in the literature since 1983 January 1 indicates that up to 30% of SNe Ia display an absorption feature near 6300 Å that can be attributed to C II 6580. While this percentage is likely biased, it does suggest that C II 6580 absorption features are more common than was previously suspected (Thomas et al., 2007). If spectroscopic observations of SNe Ia are obtained more than 1 week before maximum light, we suspect an even larger fraction of SNe Ia of all subtypes may show identifiable C II absorption signatures.
-
2.
A greater frequency of C II 6580 absorption features appear in the low-velocity gradient subtypes (LVGs) compared to high-velocity gradient events (HVGs). This is in line with the interpretation of Maeda et al. (2010b), supporting the idea that part of SN Ia diversity can be accounted for by viewing angle and off-center ignition effects.
-
3.
The influence of the temperature of the carbon-rich region on the incidence of C II 6580 signatures is most evident for the 14 “normal” SNe Ia in our survey. The frequency of C II 6580 signatures peaks with the Core-Normal (CN) SNe Ia, while the Cool (CL) and Shallow-Silicon (SS) subtypes exhibit fewer C II 6580 detections. This result is consistent with the effective temperature sequence of Nugent et al. (1995).
-
4.
We find the values of (C II 6580)/(Si II 6355) among 16 of the SNe Ia in our C II sample are similar to within 10%. Assuming the minima of Si II 6355 absorption features are an appropriate measure of photospheric velocities prior to maximum light, then the small number of cases where (C II 6580)/(Si II 6355 1 could be indicative of either a layered distribution or multiple clumps with a comparable filling factor.
One of the most interesting results of this study is that C II 6580 absorption features might be in many, if not most, early-epoch SN Ia spectra. We initially set out to investigate what we suspected was a small number of known detections of C II 6580. However, when we examined the 6300 Å region in a relatively large sample of objects, we discovered that weak signatures of C II 6580 were often detectable and could influence the observed Si II 6355 spectral profile.
One way to test for a high frequency of C II 6580 features in pre-maximum SNe Ia spectra would be to obtain high S/N observations of the region between 67007200 Å in order to look for the relatively weaker C II 7234 line that should also be present. In addition, a data set of C II 6580 observations with wavelength coverage that encompasses the O I 7774 absorption feature would allow for investigating any correlations between C and O spectral line properties.
Understanding the presence of C II in SN Ia spectra may prove to be a valuable diagnostic of SN Ia diversity and therefore a possible means by which to probe the underlying explosion mechanism. Utilizing the absolute strength of the C II 6580 line in order to extract abundance information will require comparison to synthetic spectra calculations based on hydrodynamical modeling. A detailed comparative study that can extract C abundance information, derived from C II 6580 absorption features, promises to produce a wealth of insight regarding carbon-rich regions, and therefore constrain the parameter space of hydrodynamical modeling.
References
- Aldering et al. (2002) Aldering, G., et al. 2002, Proc. SPIE, 4836, 61
- Arnett (1969) Arnett, W. D. 1969, Ap&SS, 5, 180
- Arnett (1982) Arnett, W. D. 1982, ApJ, 253, 785
- Aspden et al. (2010) Aspden, A. J., Bell, J. B., & Woosley, S. E. 2010, ApJ, 710, 1654
- Barbon et al. (1989) Barbon, R., Rosino, L., & Iijima, T. 1989, A&A, 220, 83
- Baron et al. (1994) Baron, E., Hauschildt, P. H., & Branch, D. 1994, ApJ, 426, 334
- Baron et al. (2003) Baron, E., Lentz, E. J., & Hauschildt, P. H. 2003, ApJ, 588, L29
- Baron et al. (2009) Baron, E., Chen, B., & Hauschildt, P. H. 2009, American Institute of Physics Conference Series, 1171, 148
- Benetti et al. (2005) Benetti, S., et al. 2005, ApJ, 623, 1011
- Blondin & Tonry (2007) Blondin, S., & Tonry, J. L. 2007, ApJ, 666, 1024
- Bongard et al. (2008) Bongard, S., Baron, E., Smadja, G., Branch, D., & Hauschildt, P. H. 2008, ApJ, 687, 456
- Branch et al. (1983) Branch, D., Lacy, C. H., McCall, M. L., Sutherland, P. G., Uomoto, A., Wheeler, J. C., & Wills, B. J. 1983, ApJ, 270, 123
- Branch & Khokhlov (1995) Branch, D., & Khokhlov, A. M. 1995, Phys. Rep., 256, 53
- Branch et al. (2003) Branch, D., et al. 2003, AJ, 126, 1489
- Branch et al. (2005) Branch, D., Baron, E., Hall, N., Melakayil, M., & Parrent, J. 2005, PASP, 117, 545
- Branch et al. (2006) Branch, D., et al. 2006, PASP, 118, 560
- Branch et al. (2007) Branch, D., Parrent, J., Troxel, M. A., Casebeer, D., Jeffery, D. J., Baron, E., Ketchum, W., & Hall, N. 2007, AIP Conference Proceedings, 924, 342
- Branch et al. (2008) Branch, D., et al. 2008, PASP, 120, 135
- Branch et al. (2009) Branch, D., Dang, L. C., & Baron, E. 2009, PASP, 121, 238
- Chen & Li (2009) Chen, W.-C., & Li, X.-D. 2009, ApJ, 702, 686
- Chornock et al. (2006) Chornock, R., Filippenko, A. V., Branch, D., Foley, R. J., Jha, S., & Li, W. 2006, PASP, 118, 722
- Colgate & McKee (1969) Colgate, S. A., & McKee, C. 1969, ApJ, 157, 623
- Elias et al. (1985) Elias, J. H., Matthews, K., Neugebauer, G., & Persson, S. E. 1985, ApJ, 296, 379
- Elias-Rosa et al. (2006) Elias-Rosa, N., et al. 2006, MNRAS, 369, 1880
- Filippenko (1997) Filippenko, A. V. 1997, ARA&A, 35, 309
- Fisher et al. (1997) Fisher, A., Branch, D., Nugent, P., & Baron, E. 1997, ApJ, 481, L89
- Fisher et al. (1999) Fisher, A., Branch, D., Hatano, K., & Baron, E. 1999, MNRAS, 304, 67
- Foley et al. (2009) Foley, R. J., et al. 2009, AJ, 138, 376
- Foley et al. (2010a) Foley, R. J., Brown, P. J., Rest, A., Challis, P. J., Kirshner, R. P., & Wood-Vasey, W. M. 2010, ApJ, 708, L61
- Foley et al. (2010b) Foley, R. J., Narayan, G., Challis, P. J., Filippenko, A. V., Kirshner, R. P., Silverman, J. M., & Steele, T. N. 2010, ApJ, 708, 1748
- Gamezo et al. (2004) Gamezo, V. N., Khokhlov, A. M., & Oran, E. S. 2004, Physical Review Letters, 92, 211102
- Gamezo et al. (2005) Gamezo, V. N., Khokhlov, A. M., & Oran, E. S. 2005, ApJ, 623, 337
- Garavini et al. (2004) Garavini, G., et al. 2004, AJ, 128, 387
- Garavini et al. (2005) Garavini, G., et al. 2005, AJ, 130, 2278
- Garnavich et al. (2004) Garnavich, P. M., et al. 2004, ApJ, 613, 1120
- Harutyunyan et al. (2005) Harutyunyan, A., Benetti, S., Cappellaro, E., & Turatto, M. 2005, 1604-2004: Supernovae as Cosmological Lighthouses, 342, 258
- Harutyunyan et al. (2008) Harutyunyan, A. H., et al. 2008, A&A, 488, 383
- Hatano et al. (1999a) Hatano, K., Branch, D., Fisher, A., Baron, E., & Filippenko, A. V. 1999, ApJ, 525, 881
- Hatano et al. (1999b) Hatano, K., Branch, D., Fisher, A., Millard, J., & Baron, E. 1999, ApJS, 121, 233
- Hatano et al. (2002) Hatano, K., Branch, D., Qiu, Y. L., Baron, E., Thielemann, F.-K., & Fisher, A. 2002, New Astronomy, 7, 441
- Hernandez et al. (2000) Hernandez, M., et al. 2000, MNRAS, 319, 223 & Fisher, A. 2002, New Astronomy, 7, 441
- Hicken et al. (2007) Hicken, M., Garnavich, P. M., Prieto, J. L., Blondin, S., DePoy, D. L., Kirshner, R. P., & Parrent, J. 2007, ApJ, 669, L17
- Hill et al. (1998) Hill, G. J., et al. 1998, Proc. SPIE, 3355, 375
- Höflich (1990) Höflich, P. 1990, A&A, 229, 191
- Höflich (1991) Höflich, P. 1991, A&A, 246, 481
- Höflich et al. (1995) Höflich, P., Khokhlov, A. M., & Wheeler, J. C. 1995, ApJ, 444, 831
- Höflich et al. (2002) Höflich, P., Gerardy, C. L., Fesen, R. A., & Sakai, S. 2002, ApJ, 568, 791
- Howell et al. (2001) Howell, D. A., Höflich, P., Wang, L., & Wheeler, J. C. 2001, ApJ, 556, 302
- Howell et al. (2005) Howell, D. A., et al. 2005, ApJ, 634, 1190
- Howell et al. (2006) Howell, D. A., et al. 2006, Nature, 443, 308
- Howell (2010) Howell, D. A. 2010, arXiv:1011.0441
- Hoyle & Fowler (1960) Hoyle, F., & Fowler, W. A. 1960, ApJ, 132, 565
- Iben (1988) Iben, I., Jr. 1988, ApJ, 324, 355
- Jeffery & Branch (1990) Jeffery, D. J., & Branch, D. 1990, Supernovae, Jerusalem Winter School for Theoretical Physics, 149
- Jeffery et al. (2007) Jeffery, D. J., Ketchum, W., Branch, D., Baron, E., Elmhamdi, A., & Danziger, I. J. 2007, ApJS, 171, 493
- Kasen et al. (2003) Kasen, D., et al. 2003, ApJ, 593, 788
- Kasen et al. (2008) Kasen, D., Thomas, R. C., Röpke, F., & Woosley, S. E. 2008, Journal of Physics Conference Series, 125, 012007
- Kasen et al. (2009) Kasen, D., Röpke, F. K., & Woosley, S. E. 2009, Nature, 460, 869
- Khokhlov (1991) Khokhlov, A. M. 1991, A&A, 245, 114
- Kirshner et al. (1993) Kirshner, R. P., et al. 1993, ApJ, 415, 589
- Kotak et al. (2005) Kotak, R., et al. 2005, A&A, 436, 1021
- Kozma et al. (2005) Kozma, C., Fransson, C., Hillebrandt, W., Travaglio, C., Sollerman, J., Reinecke, M., Röpke, F. K., & Spyromilio, J. 2005, A&A, 437, 983
- Lentz et al. (2001) Lentz, E. J., Baron, E., Branch, D., & Hauschildt, P. H. 2001, ApJ, 557, 266
- Leonard et al. (2005) Leonard, D. C., Li, W., Filippenko, A. V., Foley, R. J., & Chornock, R. 2005, ApJ, 632, 450
- Li et al. (1999) Li, W. D., et al. 1999, AJ, 117, 2709
- Li et al. (2001) Li, W., et al. 2001, PASP, 113, 1178
- Li et al. (2003) Li, W., et al. 2003, PASP, 115, 453
- Maeda et al. (2010a) Maeda, K., Röpke, F. K., Fink, M., Hillebrandt, W., Travaglio, C., & Thielemann, F.-K. 2010, ApJ, 712, 624
- Maeda et al. (2010b) Maeda, K., et al. 2010, Nature, 466, 82
- Marion et al. (2006) Marion, G. H., Höflich, P., Wheeler, J. C., Robinson, E. L., Gerardy, C. L., & Vacca, W. D. 2006, ApJ, 645, 1392
- Marion et al. (2009) Marion, G. H., Höflich, P., Gerardy, C. L., Vacca, W. D., Wheeler, J. C., & Robinson, E. L. 2009, AJ, 138, 727
- Marion et al. (2011) Marion, et al. 2011, in preparation
- Matheson et al. (2008) Matheson, T., et al. 2008, AJ, 135, 1598
- Mattila et al. (2005) Mattila, S., Lundqvist, P., Sollerman, J., Kozma, C., Baron, E., Fransson, C., Leibundgut, B., & Nomoto, K. 2005, A&A, 443, 649
- Maund et al. (2010) Maund, J. R., et al. 2010, ApJ, 725, L167
- Mazzali (2000) Mazzali, P. A. 2000, A&A, 363, 705
- Mazzali (2001) Mazzali, P. A. 2001, MNRAS, 321, 341
- Mazzali et al. (2005) Mazzali, P. A., Benetti, S., Stehle, M., Branch, D., Deng, J., Maeda, K., Nomoto, K., & Hamuy, M. 2005, MNRAS, 357, 200
- McClelland et al. (2010) McClelland, C. M., et al. 2010, ApJ, 720, 704
- Niemeyer (1998) Niemeyer, J. C. 1998, Stellar Evolution, Stellar Explosions and Galactic Chemical Evolution, 673
- Nomoto et al. (1984) Nomoto, K., Thielemann, F.-K., & Yokoi, K. 1984, ApJ, 286, 644
- Nomoto et al. (2003) Nomoto, K., Uenishi, T., Kobayashi, C., Umeda, H., Ohkubo, T., Hachisu, I., & Kato, M. 2003, From Twilight to Highlight: The Physics of Supernovae, 115
- Nugent et al. (1995) Nugent, P., Phillips, M., Baron, E., Branch, D., & Hauschildt, P. 1995, ApJ, 455, L147
- Nugent et al. (2010) Nugent, P., Sullivan, M., & Howell, D. A. 2010, The Astronomer’s Telegram, 2657, 1
- Pastorello et al. (2007) Pastorello, A., et al. 2007, MNRAS, 377, 1531
- Patat et al. (1996) Patat, F., Benetti, S., Cappellaro, E., Danziger, I. J., della Valle, M., Mazzali, P. A., & Turatto, M. 1996, MNRAS, 278, 111
- Phillips et al. (1987) Phillips, M. M., et al. 1987, PASP, 99, 592
- Phillips (1993) Phillips, M. M. 1993, ApJ, 413, L105
- Pignata et al. (2008) Pignata, G., et al. 2008, MNRAS, 388, 971
- Pope (1987) Pope, S., B. 1987, Annual Rev. Fluid Mech., 19, 237
- Poznanski et al. (2010) Poznanski, D., et al. 2010, Science, 327, 58
- Prieto et al. (2007) Prieto, J. L., et al. 2007, arXiv:0706.4088
- Quimby et al. (2006) Quimby, R., Höflich, P., Kannappan, S. J., Rykoff, E., Rujopakarn, W., Akerlof, C. W., Gerardy, C. L., & Wheeler, J. C. 2006, ApJ, 636, 400
- Quimby et al. (2007) Quimby, R., Höflich, P., & Wheeler, J. C. 2007, ApJ, 666, 1083
- Ramsey et al. (1998) Ramsey, L. W., et al. 1998, Proc. SPIE, 3352, 34
- Rau et al. (2009) Rau, A., et al. 2009, PASP, 121, 1334
- Röpke (2005) Röpke, F. K. 2005, A&A, 432, 969
- Sadakane et al. (1996) Sadakane, K., et al. 1996, PASJ, 48, 51
- Sahu et al. (2008) Sahu, D. K., et al. 2008, ApJ, 680, 580
- Salvo et al. (2001) Salvo, M. E., Cappellaro, E., Mazzali, P. A., Benetti, S., Danziger, I. J., Patat, F., & Turatto, M. 2001, MNRAS, 321, 254
- Scalzo et al. (2010) Scalzo, R. A., et al. 2010, arXiv:1003.2217
- Shapiro & Sutherland (1982) Shapiro, P. R., & Sutherland, P. G. 1982, ApJ, 263, 902
- Sobolev (1957) Sobolev, V. V. 1957, Soviet Astronomy, 1, 678 1009
- Stanishev et al. (2007) Stanishev, V., et al. 2007, A&A, 469, 645
- Stehle et al. (2005) Stehle, M., Mazzali, P. A., Benetti, S., & Hillebrandt, W. 2005, MNRAS, 360, 1231
- Tanaka et al. (2008) Tanaka, M., et al. 2008, ApJ, 677, 448
- Tanaka et al. (2010) Tanaka, M., et al. 2010, ApJ, 714, 1209
- Tanaka et al. (2011) Tanaka, M., Mazzali, P. A., Stanishev, V., Maurer, I., Kerzendorf, W. E., & Nomoto, K. 2011, MNRAS, 410, 1725
- Taubenberger et al. (2008) Taubenberger, S., et al. 2008, MNRAS, 385, 75
- Taubenberger et al. (2011) Taubenberger, S., et al. 2011, MNRAS, 61
- Thielemann et al. (1986) Thielemann, F.-K., Nomoto, K., & Yokoi, K. 1986, A&A, 158, 17
- Thomas et al. (2002) Thomas, R. C., Kasen, D., Branch, D., & Baron, E. 2002, ApJ, 567, 1037
- Thomas et al. (2007) Thomas, R. C., et al. 2007, ApJ, 654, L53
- Travaglio et al. (2004) Travaglio, C., Hillebrandt, W., Reinecke, M., & Thielemann, F.-K. 2004, A&A, 425, 1029
- Turatto et al. (1996) Turatto, M., Benetti, S., Cappellaro, E., Danziger, I. J., Della Valle, M., Gouiffes, C., Mazzali, P. A., & Patat, F. 1996, MNRAS, 283, 1
- Turatto et al. (1998) Turatto, M., Piemonte, A., Benetti, S., Cappellaro, E., Mazzali, P. A., Danziger, I. J., & Patat, F. 1998, AJ, 116, 2431
- Valenti et al. (2009) Valenti, S., et al. 2009, Nature, 459, 674
- Valentini et al. (2003) Valentini, G., et al. 2003, ApJ, 595, 779
- Wang et al. (1996) Wang, L., Wheeler, J. C., Li, Z., & Clocchiatti, A. 1996, ApJ, 467, 435
- Wang et al. (1997) Wang, L., Wheeler, J. C., & H”oflich, P. 1997, ApJ, 476, L27
- Wang et al. (2003) Wang, L., et al. 2003, ApJ, 591, 1110
- Wang et al. (2006) Wang, L., Baade, D., Höflich, P., Wheeler, J. C., Kawabata, K., Khokhlov, A., Nomoto, K., & Patat, F. 2006, ApJ, 653, 490
- Wang et al. (2007) Wang, L., Baade, D., & Patat, F. 2007, Science, 315, 212
- Wang & Wheeler (2008) Wang, L., & Wheeler, J. C. 2008, ARA&A, 46, 433
- Wang et al. (2009) Wang, X., et al. 2009, ApJ, 697, 380
- Wells et al. (1994) Wells, L. A., et al. 1994, AJ, 108, 2233
- Woosley et al. (2009) Woosley, S. E., Kerstein, A. R., Sankaran, V., Aspden, A. J., Röpke, F. K. 2009, ApJ, 704, 255
- Yamanaka et al. (2009a) Yamanaka, M., et al. 2009, PASJ, 61, 713
- Yamanaka et al. (2009b) Yamanaka, M., et al. 2009, ApJ, 707, L118
- Zhang et al. (2010) Zhang, T., et al. 2010, PASP, 122, 1

| Supernova | Host Galaxy | Redshift | Observation | Epoch | Telescope |
|---|---|---|---|---|---|
| Name | (km s-1) | Date | (days) | Instrument | |
| SN 2010Y | NGC 3392 | 3256 | 2010 Feb 09 | -7 | MDM/CCDS |
| 2010 Feb 10 | -6 | MDM/CCDS | |||
| 2010 Feb 13 | -3 | MDM/CCDS | |||
| 2010 Feb 14 | -2 | HET/LRS | |||
| 2010 Feb 17 | +1 | HET/LRS | |||
| SN 2010ai | SDSS J125925.04+275948.2 | 5507 | 2010 Mar 11 | -10 | HET/LRS |
| 2010 Mar 13 | -8 | HET/LRS | |||
| PTF10icb | 2010 June 3 | -10 | HET/LRS |
| SN | Sub-typeaaSN type notation of Branch et al. (2006), where CN = ‘core normal’, SS = ‘shallow silicon’, CL = ‘cool’, and BL = ‘broad line’. The similar subtypes of Benetti et al. (2005) have been used to separate to these SNe Ia into subclasses. | C II? | Epoch | Spectrum | SN | Sub-type | C II? | Epoch | Spectrum | |
|---|---|---|---|---|---|---|---|---|---|---|
| Name | (days) | SourceeeReferences(B89) Barbon et al. 1989; (B83) Branch et al. 1983; (B03) Branch et al. 2003; (E-R06) Elias-Rosa et al. 2006; (F99) Fisher et al. 1999; (F09) Foley et al. 2009; (F10a) Foley et al. 2010a; (F10b) Foley et al. 2010b; (Gara04) Garavini et al. 2004; (Gara05) Garavini et al. 2005; (Garn04) Garnavich et al. 2004; (H00) Hernandez et al. 2000; (H07) Hicken et al. 2007; (H06) Howell et al. 2006; (K93) Kirshner et al. 1993; (K05) Kotak et al. 2005; (L99) Li et al. 1999; (L01) Li et al. 2001; (L03) Li et al. 2003; (M11) Marion et al. 2011; (M08) Matheson et al. 2008; (Matt05) Mattila et al. 2005; (M01) Mazzali 2001; (Mazz05) Mazzali et al. 2005; (M10) McClelland et al. 2010; (M11) Marion et al. 2011; (P07) Pastorello et al. 2007; (P96) Patat et al. 1996; (P87) Phillips et al. 1987; (P08) Pignata et al. 2008; (P10) Poznanski et al. 2010; (Q06) Quimby et al. 2006; (Q07) Quimby et al. 2007; (S08) Sahu et al. 2008; (S01) Salvo et al. 2001; (S96) Sadakane et al. 1996; (S10) Scalzo et al. 2010; (S07) Stanishev et al. 2007; (S05) Stehle et al. 2005; (T08) Taubenberger et al. 2008; (T07) Thomas et al. 2007; (T96) Turatto et al. 1996; (T98) Turatto et al. 1998; (V03) Valentini et al. 2003; (W06) Wang et al. 2006; (W09) Wang et al. 2009; (W94) Wells et al. 1994; (Y09) Yamanaka et al. 2009a; (Z10) Zhang et al. 2010. | Name | (days) | Source | |||||
| LVG | ||||||||||
| SN 1990NbbTaken from The Supernova Spectrum Archive, SuSpect. | CN | Definite | -14 | M01 | SN 1999dq | SS | No | -9.5 | M08 | |
| SN 1991TbbTaken from The Supernova Spectrum Archive, SuSpect. | SS | Possible | -13 | F99 | SN 1999ee | SS | Uncertain | -9 | Mazz05 | |
| SN 1994Db,b,footnotemark: ccObjects with both published spectropolarimetry data and C II 6580 absorption signatures: 1994D; Wang et al. (1996), 1996X; Wang et al. (1997), 1999by; Howell et al. (2001), 2003du; Leonard et al. (2005), 2005hk; Chornock et al. (2006). | CN | Probable | -11 | P96 | SN 1999gp | SS | No | -4.5 | M08 | |
| SN 1995D | CN | Uncertain | +0 | S96 | SN 2000E | SS | Possible | -6 | V03 | |
| SN 1996Xb,b,footnotemark: ccObjects with both published spectropolarimetry data and C II 6580 absorption signatures: 1994D; Wang et al. (1996), 1996X; Wang et al. (1997), 1999by; Howell et al. (2001), 2003du; Leonard et al. (2005), 2005hk; Chornock et al. (2006). | CN | Probable | -4 | S01 | SN 2001VbbTaken from The Supernova Spectrum Archive, SuSpect. | SS | Possible | -7 | M08 | |
| SN 1997brbbTaken from The Supernova Spectrum Archive, SuSpect. | SS | No | -9 | L99 | SN 2001el | CN | Probable | -9 | Matt05 | |
| SN 1997dt | CN | Uncertain | -10 | M08 | SN 2003cg | CN | Possible | -8.5 | E-R06 | |
| SN 1998V | CN | Uncertain | +0.5 | M08 | SN 2003dub,b,footnotemark: ccObjects with both published spectropolarimetry data and C II 6580 absorption signatures: 1994D; Wang et al. (1996), 1996X; Wang et al. (1997), 1999by; Howell et al. (2001), 2003du; Leonard et al. (2005), 2005hk; Chornock et al. (2006). | CN | Probable | -11 | S07 | |
| SN 1998ab | SS | No | -7.5 | M08 | SN 2005cf | CN | Uncertain | -12 | W09 | |
| SN 1998aqbbTaken from The Supernova Spectrum Archive, SuSpect. | CN | Probable | -9 | B03 | SN 2005cg | SS | No | -10 | Q06 | |
| SN 1998bu | CN | Probable | -7 | H00 | SN 2005hj | SS | No | -6 | Q07 | |
| SN 1998es | SS | No | -10 | M08 | SN 2006D | CN | Definite | -7 | T07 | |
| SN 1999aa | SS | No | -11 | Gara04 | SN 2010ai | CN | Probable | -10 | this work | |
| SN 1999acbbTaken from The Supernova Spectrum Archive, SuSpect. | SS | Possible | -15 | Gara05 | PTF10icb | CN | Probable | -10 | this work | |
| HVG | ||||||||||
| SN 1981B | BL | No | 0 | B83 | SN 2000fa | BL | Uncertain | -10 | M08 | |
| SN 1984A | BL | No | -7 | B89 | SN 2002bo | BL | No | -13 | S05 | |
| SN 1992A | BL | Probable | -6.5 | K93 | SN 2002dj | BL | No | -11 | P08 | |
| SN 1997do | BL | No | -11 | M08 | SN 2002er | BL | Possible | -11 | K05 | |
| SN 1998dh | BL | No | -9 | M08 | SN 2004dtbbTaken from The Supernova Spectrum Archive, SuSpect. | BL | No | -7 | W06 | |
| SN 1998ec | BL | No | -2.5 | M08 | SN 2006X | BL | Possible | -7 | Y09 | |
| SN 1999cc | BL | No | -3 | M08 | SN 2007gi | BL | Possible | -7.5 | Z10 | |
| SN 1999cl | BL | No | -7.5 | M08 | SN 2009ig | BL | Possible | -14 | M11, in prep. | |
| SN 1999ej | BL | No | -0.5 | M08 | ||||||
| FAINT | ||||||||||
| SN 1986G | CL | Possible | -6 | P87 | SN 2000cn | CL | Uncertain | -9 | M08 | |
| SN 1989B | CL | Possible | -7 | W94 | SN 2000dk | CL | Possible | -4.5 | M08 | |
| SN 1991bg | CL | No | +1 | T96 | SN 2004eo | CL | No | -11 | P07 | |
| SN 1997cn | CL | No | 0 | T98 | SN 2005blbbTaken from The Supernova Spectrum Archive, SuSpect. | CL | Probable | -6 | T08 | |
| SN 1998bp | CL | No | -2.5 | M08 | SN 2006bt | CL | Probable | -3 | F10b | |
| SN 1998de | CL | No | -6.5 | M08 | SN 2010Y | CL | Definite | -7 | this work | |
| SN 1999byb,b,footnotemark: ccObjects with both published spectropolarimetry data and C II 6580 absorption signatures: 1994D; Wang et al. (1996), 1996X; Wang et al. (1997), 1999by; Howell et al. (2001), 2003du; Leonard et al. (2005), 2005hk; Chornock et al. (2006). | CL | Possible | -5 | Garn04 | ||||||
| SCddSC = Super-Chandra Candidates | ||||||||||
| SN 2003fg | Definite | H06 | SN 2006gzbbTaken from The Supernova Spectrum Archive, SuSpect. | Definite | -14 | H07 | ||||
| SN 2007if | Definite | -9 | S10 | SN 2009dc | Definite | -8 | unpublished | |||
| misc. | ||||||||||
| SN 2000cx | Possible | -3 | L01 | SN 2005hkb,b,footnotemark: ccObjects with both published spectropolarimetry data and C II 6580 absorption signatures: 1994D; Wang et al. (1996), 1996X; Wang et al. (1997), 1999by; Howell et al. (2001), 2003du; Leonard et al. (2005), 2005hk; Chornock et al. (2006). | Possible | -5 | S08 | |||
| SN 2002bj | Definite | +7 | P10 | SN 2007qd | Possible | +3 | M10 | |||
| SN 2002cx | Probable | -4 | L03 | SN 2008ha | Definite | -1 | F09, F10a | |||
| Supernova | Epoch | C IIaaFits made with Texc=10,000 K and ve=1000 km s-1. | Si IIaaFits made with Texc=10,000 K and ve=1000 km s-1. | |||||
|---|---|---|---|---|---|---|---|---|
| Name | (days) | (km s-1) | Velocity | Velocity | ||||
| SN 1990N | -14 | 13,000 | 16,000 | 0.60 | 14,000bbUsed two-components of Si II to fit broad Si II 6355 P-Cygni profiles. | 0.50 | ||
| -8 | 11,000 | 14,000 | 0.25 | 11,000 | 1.40 | |||
| -2 | 11,000 | 14,000 | 0.15 | 11,000 | 16.0 | |||
| 2 | 11,000 | 14,000 | 0.35 | 11,000 | 16.0 | |||
| SN 1994D | -11 | 14,000 | 14,000 | 1.30 | 14,000 | 14.0 | ||
| -10 | 13,000 | 14,000 | 0.45 | 13,000 | 12.0 | |||
| -8 | 13,000 | 14,000 | 0.45 | 13,000 | 6.00 | |||
| -5 | 12,000 | 14,000 | 0.20 | 12,000 | 6.00 | |||
| SN 1996X | -4 | 13,500 | 13,500 | 0.60 | 13,500 | 15.0 | ||
| -2 | 13,000 | 13,000 | 0.40 | 13,000 | 13.0 | |||
| -1 | 12,000 | 13,000 | 0.04 | 13,000 | 8.00 | |||
| SN 1998aq | -9 | 12,000 | 15,000 | 0.20 | 13,000 | 2.10 | ||
| -8 | 12,000 | 14,000 | 0.20 | 13,000 | 2.10 | |||
| 0 | 12,000 | 13,500 | 0.60 | 12,000 | 9.00 | |||
| SN 1999ac | -15 | 13,000 | 17,000 | 0.40 | 15,000 | 2.00 | ||
| -9 | 14,000 | 17,500 | 0.30 | 14,000 | 3.00 | |||
| SN 1999by | -5 | 12,000 | 14,500 | 0.50 | 12,000 | 12.0 | ||
| -4 | 12,000 | 14,500 | 0.30 | 12,000 | 13.0 | |||
| -3 | 12,000 | 14,500 | 0.30 | 12,000 | 14.0 | |||
| SN 2001V | -7 | 8000 | 12,000 | 0.15 | 8000 | 1.60 | ||
| -6 | 8000 | 12,000 | 0.15 | 8000 | 1.60 | |||
| -4 | 8000 | 12,500 | 0.15 | 8000 | 1.80 | |||
| SN 2003du | -13 | 14,000 | 14,000 | 0.60 | 14,000 | 4.00 | ||
| -11 | 12,000 | 14,000 | 0.60 | 12,000 | 4.50 | |||
| SN 2005hk | -5 | 6000 | 7500 | 0.07 | 7000 | 0.30 | ||
| 0 | 6000 | 7500 | 0.14 | 7000 | 0.70 | |||
| SN 2006D | -7 | 11,000 | 14,500 | 0.30 | 13,000 | 0.70 | ||
| -5 | 11,000 | 14,500 | 0.20 | 13,000 | 0.70 | |||
| SN 2006bt | -4 | 6500 | 6500 | 0.30 | 11,000 | 0.50 | ||
| -3 | 6500 | 6500 | 0.25 | 11,000 | 0.70 | |||
| SN 2006gz | -14 | 12,000 | 18,500 | 0.50 | 16,500 | 1.10 | ||
| -12 | 12,000 | 18,500 | 0.40 | 16,500 | 1.50 | |||
| -10 | 12,000 | 17,500 | 0.30 | 16,000 | 1.60 | |||
| SN 2007if | -9 | 8500 | 9500 | 0.25 | 8500 | 0.30 | ||
| SN 2008haccSee Valenti et al. (2009) for an alternate SYNOW fit where the origin of explosion is interpreted to be a core-collapse supernova. | -1 | 1000 | 1000 | 1.00 | 2500 | 10.0 | ||
| SN 2009dc | -8 | 8000 | 11,000 | 0.50 | 10,000 | 0.80 | ||
| -7 | 8000 | 10,000 | 0.30 | 9500 | 0.50 | |||
| -6 | 8000 | 10,000 | 0.30 | 9500 | 0.50 | |||
| -5 | 7000 | 9500 | 0.30 | 9000 | 0.50 | |||
| -3 | 7000 | 9500 | 0.30 | 8500 | 0.50 | |||
| -2 | 6500 | 9000 | 0.30 | 8000 | 0.50 | |||
| -1 | 6500 | 9000 | 0.30 | 8000 | 0.50 | |||
| 0 | 6500 | 8500 | 0.40 | 8500 | 1.10 | |||
| 2 | 6500 | 8500 | 0.30 | 8000 | 0.60 | |||
| 3 | 6000 | 7500 | 0.30 | 7500 | 0.70 | |||
| 4 | 6000 | 7500 | 0.30 | 7500 | 0.70 | |||
| 5 | 6000 | 7500 | 0.30 | 7500 | 0.70 | |||
| 6 | 5500 | 7500 | 0.30 | 7000 | 0.70 | |||
| 7 | 5500 | 7500 | 0.30 | 6500 | 0.70 | |||
| 8 | 6000 | 7500 | 0.30 | 7000 | 0.70 | |||
| 9 | 5000 | 6000 | 0.20 | 7000 | 1.00 | |||
| 15 | 5000 | 5000 | 0.20 | 6500 | 0.80 | |||
| SN 2009ig | -14 | 16,000 | 16,000 | 1.00 | 16,000 | 24 | ||
| -13 | 16,000 | 16,000 | 0.50 | 16,000 | 24 | |||
| SN 2010Y | -7 | 12,000 | 15,000 | 0.50 | 14,000 | 6.00 | ||
| -6 | 12,000 | 15,000 | 0.50 | 14,000 | 5.00 | |||
| -3 | 12,000 | 14,500 | 0.50 | 13,000 | 10.0 | |||
| -2 | 11,500 | 14,000 | 0.50 | 12,500 | 18.0 | |||
| 1 | 11,000 | 14,000 | 0.20 | 12,000 | 20.0 | |||
| SN 2010ai | -10 | 13,500 | 14,000 | 1.00 | 13,500 | 2.00 | ||
| -8 | 12,500 | 14,000 | 0.50 | 12,500 | 1.50 | |||
| PTF10icb | -10 | 11,000 | 14,500 | 0.10 | 12,000 | 1.10 | ||