The effective mass of bilayer graphene: electron-hole asymmetry and electron-electron interaction
Abstract
We report precision measurements of the effective mass in high-quality bilayer graphene using the temperature dependence of the Shubnikov-de Haas oscillations. In the density range of 0.7 x 10¹²/cm2 4.1 x 10¹²/cm2, both the hole mass and the electron mass increase with increasing density, demonstrating the hyperbolic nature of the bands. The hole mass is approximately 20-30% larger than the electron mass . Tight-binding calculations provide a good description of the electron-hole asymmetry and yield an accurate measure of the inter-layer hopping parameter . Both and are suppressed compared to single-particle values, suggesting electron-electron interaction induced renormalization of the band structure of bilayer graphene.
pacs:
73.43.Qt, 73.20.At, 71.70.Gm.I INTRODUCTION
Bilayer graphene may be a technologically important material in electronics and photonics due to its tunable band gap. The fundamental property that underpins such applications-its band structure-has been the subject of many recent theoretical Mccann (2006); Mucha-Kruczynski et al. (2010); Nilsson et al. (2008); Gava et al. (2009) and experimental studies using angle-resolved photoemission spectroscopy Ohta et al. (2006), infrared and Raman measurements Malard et al. (2007); Zhang et al. (2008); Kuzmenko et al. (2009), cyclotron mass Castro et al. (2007) and compressibility measurements Henriksen and Eisenstein (2010); Young et al. (2010). On a single particle level, the band structure of bilayer is thought to be well described by a tight-binding Hamiltonian Mucha-Kruczynski et al. (2010); Nilsson et al. (2008) with a few leading order Slonczewski-Weiss-McClure parameters, i.e., , , and . Experimental knowledge of these hopping parameters in bilayer varies, with eV fairly accurately known Zhang et al. (2008); Kuzmenko et al. (2009) and the rest to a much less degree. For example, experimental values of , which controls the band asymmetry, range from 0.11-0.19 eV Malard et al. (2007); Zhang et al. (2008); Kuzmenko et al. (2009); Henriksen and Eisenstein (2010).
Meanwhile, electron-electron interactions in single-layer and bilayer graphene are predicted to be strong and peculiar. Interesting collective states emerge in a magnetic field Zhao et al. (2010); Martin et al. (2010). The many-body corrections to Fermi liquid parameters such as the compressibility and the effective mass are expected to be sunstantial already at currently accessible densities Kusminskiy et al. (2008, 2009); Borghi et al. (2009, 2010); Sensarma et al. (2011). These renormalization effects are related to, but also quantitatively different from those observed in conventional two-dimensional electron gases (2DEGs) Giuliani and Vignale (2005); Tan et al. (2005), due to the chirality of single and bilayer graphene Borghi et al. (2009). For example, instead of an enhancement Tan et al. (2005), the effective mass of bilayer graphene is predicted to be increasingly suppressed at lower carrier densities Borghi et al. (2009). No experimental evidence of such renormalization effect has been reported so far.
In this work, we report the measurements of the effective mass in bilayer graphene samples for a wide range of carrier densities using high-quality Shubnikov-de Haas (SdH) oscillations. The inter-layer hopping parameter is determined to be = 0.063(1) with the highest accuracy reported so far. The magnitude and density dependence of deviate from tight-bind calculations, providing evidence for electron-electron interaction induced band renormalization.
II SAMPLE PREPARATION
Bilayer graphene flakes are exfoliated onto 290 nm SiO2/Si wafers from highly ordered pyrolytic graphite and identified by optical microscope and Raman spectra. They are further confirmed by their quantum Hall sequence. Conventional electron-beam lithography is used to pattern the flakes into Hall bars.
III MEASUREMENTS
Transport measurements are carried out in a He4 system using standard low-frequency lock-in technique. The field effect mobility of our pristine bilayer graphene ranges from 3 000-12 000 cm2/Vs. Data from two samples (A and B) are presented in this paper.
In Fig. 1, we plot the sheet conductance vs. the back-gate voltage of sample A at selected temperatures between 15 K–250 K. At 15 K, the mobility of sample A is approximately 4 800 cm2/Vs for holes and 3 100 cm2/Vs for electrons. Sample B has a higher mobility of 6 300 cm2/Vs for holes and 6 800 cm2/Vs for electrons. The conductance of bilayer graphene samples shows a variety of temperature dependence, depending on the carrier density and mobility. Near the charge neutrality point, all our samples show an insulating-like -dependence ( 0), as shown in Fig. 1. This behavior is due to the thermal excitation of carriers out of electron-hole puddles, as demonstrated in Ref. Zou and Zhu, 2010. As the carrier density increases, eventually becomes negative (metallic) in the highest-quality samples. This trend is shown by the hole branch in Fig. 1(a) and (b), where the crossover density is approximately = 2.1 x 10¹²/cm2 . For samples with lower mobilities, the insulating-like -dependence persists to high densities, an example of which is given by the electron branch in Fig. 1(b).
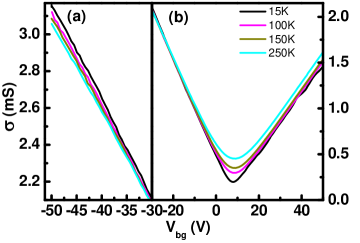
This complex behavior is in contrast to that of single-layer graphene, where a metallic-like temperature dependence dominates over a wide range of densities due to phonon scattering Chen et al. (2009); Zhu et al. (2009); Zou et al. (2010). The qualitative features of our data are consistent with the model proposed in Ref. Hwang and Das Sarma, 2010, where combines metallic and insulating trends arising from the conduction of the majority and minority carriers respectively. The true metallic -dependence of a bilayer graphene two-dimensional electron gas emerges only in high quality samples and/or at high carrier densities. In Fig. 1, the different -dependence of the two carriers in the same sample points to an intrinsic electron-hole (e-h) asymmetry of bilayer graphene, which we further examine below.
To probe the band structure of bilayer graphene, we measure the effective mass as a function of the carrier density using SdH oscillations. This technique is well established in 2DEGs but require high-quality oscillations to reliably extract . Figure 2(a) shows the SdH oscillations of sample A at a high electron density = 3.26 x 10¹²/cm2 and varying temperatures. The oscillations have an early onset, appear sinusoidal and free of beating. Its amplitude is given by Hong et al. (2009):
| (1) |
where is the cyclotron frequency, is the quantum scattering time and the thermal factor.
As shown in Fig. 2(a), increases with increasing and decreasing . Its -dependence provides a direct measure of whereas the -dependence is controlled by both and . At each carrier density, the low-field data, i.e., before the onset of the quantum Hall effect, is fit to Eq. 1 with two fitting parameters and . The simultaneous fitting of and allows us to accurately determine , especially at low carrier densities, where the oscillations are few and a linear interpolation between peaks, as commonly done in the literature Tan et al. (2005), cannot give the correct amplitude of . Figure 2(b) shows data at T=10 K and 40 K for a low hole density = 0.89 x 10¹²/cm2. Fittings to Eq. 1 are shown as dashed lines. Only the right values of and can fit both the -dependence and -dependence of simultaneously.
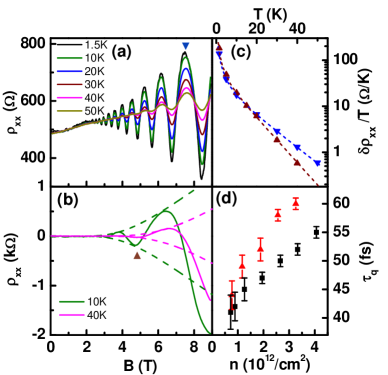
In Fig. 2(c), we plot two examples of the measured vs. in a semi-log plot for the two positions marked in Figs. 2(a) and (b) with down and up triangles respectively. Dashed lines are fittings generated with = 0.041 and = 0.036 respectively, where is the electron rest mass. They both fit very well. Overall, Eq. 1 provides an excellent description of the data in the entire density range studied, with the uncertainty of increasing from 0.0001 to 0.0015 from high to low densities. The global fitting procedure also ensures that the extracted is filling factor independent and therefore represents the = 0 limit, i.e., the band structure mass. This is not directly comparable to determined from cyclotron resonance measurements Henriksen et al. (2008), as Coulomb interaction may manifest differently in these two cases Shizuya (2010); *Zhang2010. A good illustration of this situation is the parabolic band material GaAs, where determined from SdH oscillations embodies electron-electron (e-e) interaction Tan et al. (2005) while its effect is forbidden in cyclotron resonance measurements by the Kohn theorem Kohn (1961).
Using this method, we have determined and for samples A and B in the density range of 0.7 4.1 x 10¹²/cm2 for electrons and holes. Both samples show oscillations of equally high quality and comparable . Figure 2(d) plots of sample A for both carriers. Overall, increases with increasing density, ranging from 41 to 60 fs. These values correspond to a disorder broadening = 5.5-8.0 meV, which are similar to high-quality single and bilayer graphene samples Zhang et al. (2008); Hong et al. (2009).
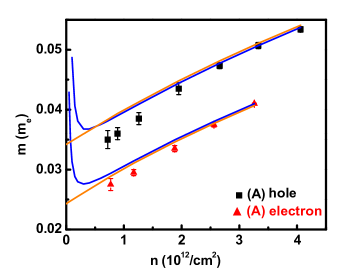
The results of of samples A and B as a function of the carrier density are plotted in Fig. 3(a). The error bars represent uncertainties obtained from fittings similar to those shown in Fig. 2(c). The two samples agree very well with each other. In the density range studied, both and increase with increasing , indicating the non-parabolic nature of the bands. This observation agrees with the compressibility measurements of Refs. Henriksen and Eisenstein, 2010; Young et al., 2010 and is also consistent with the observation of a constant at yet lower densities Martin et al. (2010). The ratio of / is about 1.2-1.3, demonstrating a pronounced electron-hole asymmetry.
IV ANALYSIS AND DISCUSSION
The above measurements of provide an accurate means of determining the band structure of bilayer graphene and investigating the effect of e-e interaction. In the following analysis, we employ a tight-binding Hamiltonian following the notations of Refs. Nilsson et al., 2008 and Zhang et al., 2008:
| (2) |
Equation 2 is written in the basis of the four sublattices (), where A1, A2 are the two stacked sublattices in layer 1 and 2 respectively. The nearest neighbor in-plane (A1-B1) hopping integral is included in , where = 1.42 is the carbon-carbon distance and the momentum vector originates from the K (K′) point of the Brillouin zone. The Fermi velocity . and represent the hopping integrals between two inter-layer sublattices A1-A2, B1-B2, and A1-B2 respectively. gives rise to the band splitting, leads to trigonal warping of the Fermi surface and controls electron-hole asymmetry. is the on-site energy difference of A1 and B1, due to their stacking difference. is the potential difference between the two layers and varies with the carrier density Zhang et al. (2008). The eigenvalues of Eq. 2 produce the four low-energy bands of bilayer graphene. Out of the four bands, the two higher energy electron and hole bands are neglected here since they are far above the Fermi level of our density range, 30-120 meV. The effective mass of the lower bands is given by:
| (3) |
where is the -space area enclosed by the contour of constant energy . For = 0, the contour is circular and Eq. 3 is simplified to ).
We diagonalize Eq. 2 and numerically compute using Eq. 3. The effect of each parameter in Eq. 2 on is summarized in table 1, where +(-) means an increase of the parameter will increase (decrease) the value of .
| - | + | + | + | + | + | |
| - | + | + | + | - | - | |
| value (eV) | 3.43(1) | 0.40† | 0 | 0.063(1) | 0.018† |
†.Reference Zhang et al., 2008.
In our calculations, the inter-layer B1-B2 hopping energy is set to zero due to its negligible effect in the density range considered here (see Appendix A for details). The gate voltage-induced is calculated following Eqs.(7)-(13) in Ref. Zhang et al., 2008, using self-consistent screening and including the small initial doping of our samples. Both and the initial doping produce minute corrections to in the density range studied (see Appendix B for details). Consequently, the overall magnitude of and and their density dependence are predominantly controlled by and . In the literature, is found to be 0.38-0.40 eV by infrared measurements Zhang et al. (2008); Kuzmenko et al. (2009). Most of our fittings use =0.40 eV. Alternative scenarios are also considered in the discussion of electron-electron interaction effect and further explored in Appendix C. The difference between and is controlled by and . We fix =0.018 eV in our calculations. A 10 variation of among literature values Zhang et al. (2008); Kuzmenko et al. (2009) leads to a change smaller than 2 in , which is comparable to its estimated uncertainty.
Fitting to and simultaneously allows us to determine the remaining adjustable parameters, and . Fittings to both samples are given in Fig. 3(a). The value of varies slightly from 3.419 eV in A to 3.447 eV in B, yielding an average =(3.43 0.01) eV. This corresponds to a m/s, in agreement with previous experiments. Both samples yield = 0.063 0.001. The value of is also independent of the choice of , as the fittings in Fig. 3(a) show. This result is consistent with the range of 0.04–0.06 obtained previously Zhang et al. (2008); Kuzmenko et al. (2009); Malard et al. (2007); Henriksen and Eisenstein (2010), but has a much higher precision. This accurate knowledge of electron-hole asymmetry will be important to potential electronic and optical applications of bilayer graphene.
The above fitting does not include the in-plane next-nearest neighbor hopping integral Mucha-Kruczynski et al. (2010), which also contributes to the electron-hole asymmetry of , acting in the opposite direction of not . The value of is not well established. Including an additional diagonal term in Eq. 2 Mucha-Kruczynski et al. (2010), our calculations show that the effect of on can be represented by an empirical relation = 0.063 + 0.037, which can provide further correction to should the value of become known.
The fittings in Fig. 3(a) reveal an important trend of our data, i.e., the measured increasingly drops below the calculated as decreases. This trend is consistently seen for both electrons and holes and in both samples. Extensive tests show that this discrepancy between data and tight-binding calculations cannot be reconciled by varying any other parameters except for . A perfect fit to both high and low densities is only possible if is allowed to decrease from 0.40 eV to 0.30 eV, as shown by the short-dashed lines in Fig. 3(a). This scenario, although appealing, is at odds with previous experimental determination of =0.38-0.40 eV from infrared spectroscopy Zhang et al. (2008); Kuzmenko et al. (2009). Alternatively, we attribute the discrepancy between measurements and tight-binding calculations to interaction induced band renormalization effect. Indeed, a recent calculation in bilayer graphene predicts a monotonic suppression of as a function of decreasing density Borghi et al. (2009) and the effect is shown to be already substantial in the density range studied here. First-principles calculations also show that a more complete inclusion of e-e interaction in the form of GW corrections increases from the mean-field-like value of 2.7 eV to an interaction-modified value of 3.4 eV Trevisanutto et al. (2008); Park et al. (2009); Gava et al. (2009). In our experiment, the suppression of m*, its density dependence, and the fitting result of =3.43 eV all strongly point to the renormalization effect of e-e interaction on .
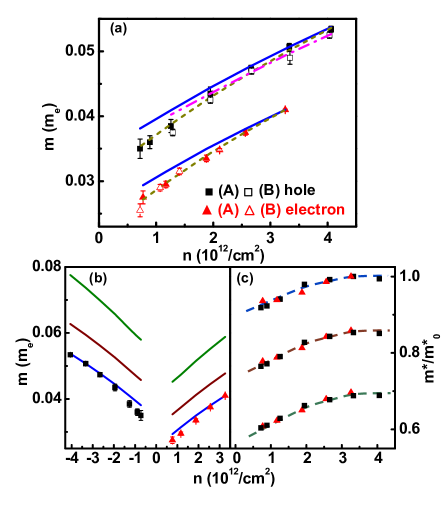
The magnitude of this effect is illustrated in Fig. 3(b) and (c), using sample A as an example. Here we calculate and plot three sets of values using = 2.72, 3.09, and 3.42 eV (corresponding to m/s respectively). These three values are the first principle mean-field-like, intermediate, and our fitting result of respectively. The other parameters are fixed at values listed in Table 1. Fig. 3(c) plots the ratio of measured m* and the calculated , / vs for each . The trend of decreasing / with decreasing density is seen in each case, with the magnitude of the suppression depending on the input value of . Electrons and holes follow the same trend. When the first principle mean-field-like value of = 2.72 eV is used (bottom trace in Fig. 3(c)), the suppression of is quite large, varying from 0.6 to 0.7 in the density range 0.7 4 x 10¹²/cm2. These observations provide the first experimental indication of e-e interaction induced band renormalization effect in bilayer graphene. The quantitative input provided by our data should constrain and guide future calculations on this important subject, as the correct theory must capture both the magnitude and the density dependence of .
V CONCLUSION
To conclude, we report the measurement of the effective mass in bilayer graphene over a wide range of electron and hole densities. Our results demonstrate a pronounced electron-hole asymmetry, from which we accurately determine the inter-layer hopping parameter in the tight-binding description of the band structure. The measured is suppressed compared to single-particle predictions, indicating the possibility of interaction-induced band renormalization at play. Our results provide critical experimental input to understand the effect of electron-electron interaction in this unique two-dimensional electron system.
Acknowledgements.
We are grateful for discussions with M. Cohen, V. Crespi, M. Fogler, J. Jain, ZQ. Li and M. Polini. This work is supported by NSF CAREER grant no. DpaMR-0748604 and NSF NIRT grant no. ECS-0609243. The authors acknowledge use of facilities at the PSU site of NSF NNIN.Appendix A THE EFFECT OF ON
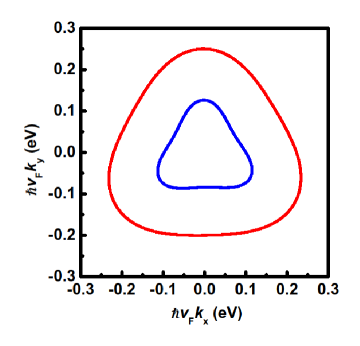
The inter-layer B1-B2 hopping energy leads to trigonal warping of the Fermi surface Nilsson et al. (2008). An example is plotted in Fig. 4 for 0.7 x 10¹²/cm2 and 4 x 10¹²/cm2. is calculated using Eq. 3 of the main text. In the density range of our experiment, even the largest = 0.38 eV found in the literature Kuzmenko et al. (2009); Ohta et al. (2006); Malard et al. (2007) results only a minute increase of , comparable to the smallest error bar. We therefore set = 0 in the calculations.
Appendix B THE EFFECT OF AND THE INITIAL DOPING ON
The gate voltage-induced is calculated using Eqs.(7)-(13) in Ref. Zhang et al., 2008, which agrees well with optical measurementsZhang et al. (2009). The calculation includes a small initial hole doping of = +7 V for sample A and = +17 V for sample B, likely due to water adsorbed on the top layer. It also includes the quantum level broadening calculated from the quantum scattering time . increases with increasing and varies from 2-70 meV. As increases, both and increase slightly compared to zero-gap cases. The effect is the largest at V = 70 meV (=4.1 x 10¹²/cm2), where both and increase by 0.002 , which is 5 of measured .
Fig. 5 illustrates the effect of the initial chemical doping on the calculated in sample A. The blue lines are calculated with the measured doping of = +7 V. The orange lines are calculated with zero doping. The initial doping drastically enhances near the charge neutrality point but produces negligible effect in the density range studied here.
Appendix C THE CORRELATION BETWEEN AND
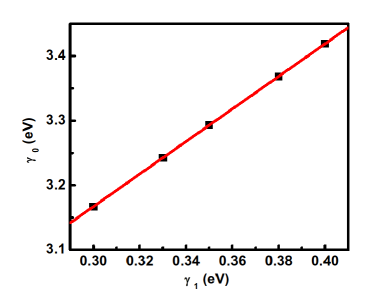
In Fig. 3(a), the fitting results of depend on the input parameter . This relationship can be described by a linear fit as shown in Fig. 6. As discussed in the text, the choice of =0.40 eV leads to =3.419 eV and discrepancy between data and calculations at low densities. A decrease in also decreases and leads to better fit at low densities. Both high and low density data can be fit by =0.30 eV and =3.167 eV. This choice of is however incompatible with the experimental range of 0.38-0.40 eV obtained from infrared absorption measurements Zhang et al. (2008); Kuzmenko et al. (2009).
References
- Mccann (2006) E. Mccann, Physical Review B 74, 161403 (2006).
- Mucha-Kruczynski et al. (2010) M. Mucha-Kruczynski, E. McCann, and V. I. Fal’ko, Semiconductor Science and Technology 25, 033001 (2010), and references therein.
- Nilsson et al. (2008) J. Nilsson, A. H. Castro Neto, F. Guinea, and N. M. R. Peres, Physical Review B 78, 045405 (2008).
- Gava et al. (2009) P. Gava, M. Lazzeri, A. Saitta, and F. Mauri, Physical Review B 79, 165431 (2009).
- Ohta et al. (2006) T. Ohta, A. Bostwick, T. Seyller, K. Horn, and E. Rotenberg, Science 313, 951 (2006).
- Malard et al. (2007) L. M. Malard, J. Nilsson, D. C. Elias, J. C. Brant, F. Plentz, E. S. Alves, A. H. Castro Neto, and M. A. Pimenta, Physical Review B 76, 201401 (2007).
- Zhang et al. (2008) L. M. Zhang, Z. Q. Li, D. N. Basov, M. M. Fogler, Z. Hao, and M. C. Martin, Physical Review B 78, 235408 (2008).
- Kuzmenko et al. (2009) A. B. Kuzmenko, I. Crassee, D. van der Marel, P. Blake, and K. Novoselov, Physical Review B 80, 165406 (2009).
- Castro et al. (2007) E. V. Castro, K. S. Novoselov, S. V. Morozov, N. M. R. Peres, J. M. B. L. dos Santos, J. Nilsson, F. Guinea, A. K. Geim, and A. H. Castro Neto, Phys. Rev. Lett. 99, 216802 (2007).
- Henriksen and Eisenstein (2010) E. A. Henriksen and J. P. Eisenstein, Physical Review B 82, 041412 (2010).
- Young et al. (2010) A. F. Young, C. R. Dean, I. Meric, S. Sorgenfrei, H. Ren, K. Watanabe, T. Taniguchi, J. Hone, K. L. Shepard, and P. Kim, arXiv:1004.5556 (2010).
- Zhao et al. (2010) Y. Zhao, P. Cadden-Zimansky, Z. Jiang, and P. Kim, Physical Review Letters 104, 066801 (2010).
- Martin et al. (2010) J. Martin, B. E. Feldman, R. T. Weitz, M. T. Allen, and A. Yacoby, Physical Review Letters 105, 256806 (2010).
- Kusminskiy et al. (2008) S. V. Kusminskiy, J. Nilsson, D. K. Campbell, and A. H. Castro Neto, Phys. Rev. Lett. 100, 106805 (2008).
- Kusminskiy et al. (2009) S. V. Kusminskiy, D. K. Campbell, and A. H. Castro Neto, EPL 85, 58005 (2009).
- Borghi et al. (2009) G. Borghi, M. Polini, R. Asgari, and A. H. MacDonald, Solid State Communications 149, 1117 (2009).
- Borghi et al. (2010) G. Borghi, M. Polini, R. Asgari, and A. H. MacDonald, Physical Review B 82, 155403 (2010).
- Sensarma et al. (2011) R. Sensarma, E. H. Hwang, and S. Das Sarma, arXiv:1102.1427 (2011).
- Giuliani and Vignale (2005) G. Giuliani and G. Vignale, Quantum Theory of the Electron Liquid (Cambridge University Press, 2005).
- Tan et al. (2005) Y. Tan, J. Zhu, H. L. Stormer, L. N. Pfeiffer, K. W. Baldwin, and K. W. West, Physical Review Letters 94, 016405 (2005).
- Zou and Zhu (2010) K. Zou and J. Zhu, Physical Review B 82, 081407 (2010).
- Chen et al. (2009) J. H. Chen, C. Jang, M. Ishigami, S. Xiao, W. G. Cullen, E. D. Williams, and M. S. Fuhrer, Solid State Communications 149, 1080 (2009), and references therein.
- Zhu et al. (2009) W. Zhu, V. Perebeinos, M. Freitag, and P. Avouris, Physical Review B 80, 235402 (2009).
- Zou et al. (2010) K. Zou, X. Hong, D. Keefer, and J. Zhu, Physical Review Letters 105, 126601 (2010).
- Hwang and Das Sarma (2010) E. H. Hwang and S. Das Sarma, Physical Review B 82, 081409 (2010).
- Hong et al. (2009) X. Hong, K. Zou, and J. Zhu, Physical Review B 80, 241415 (2009).
- Henriksen et al. (2008) E. A. Henriksen, Z. Jiang, L.-C. Tung, M. E. Schwartz, M. Takita, Y.-J. Wang, P. Kim, and H. L. Stormer, Phys. Rev. Lett. 100, 087403 (2008).
- Shizuya (2010) K. Shizuya, Physical Review B 81, 075407 (2010).
- Zhang et al. (2010) L. M. Zhang, M. M. Fogler, and D. P. Arovas, arXiv:1008,1418 (2010).
- Kohn (1961) W. Kohn, Physical Review 123, 1242 (1961).
- (31) does not lead to measurable effect in infrared measurements Zhang et al. (2008).
- Trevisanutto et al. (2008) P. E. Trevisanutto, C. Giorgetti, L. Reining, M. Ladisa, and V. Olevano, Physical Review Letters 101, 226405 (2008).
- Park et al. (2009) C.-h. Park, F. Giustino, C. D. Spataru, M. L. Cohen, and S. G. Louie, Nano Letters 9, 4234 (2009).
- Zhang et al. (2009) Y. Zhang, T.-T. Tang, C. Girit, Z. Hao, M. C. Martin, A. Zettl, M. F. Crommie, Y. R. Shen, and F. Wang, Nature 459, 820 (2009).