RAT J0455+1305: A rare hybrid pulsating subdwarf B star
Abstract
We present results on the second-faintest pulsating subdwarf B (sdB) star known, RAT J0455+1305, derived from photometric data obtained in 2009. It shows both short and long periods oscillations, theoretically assigned as pressure and gravity modes. We identify six short-period frequencies (with one being a combination) and six long-period frequencies. This star is the fourth hybrid sdB star discovered so far which makes it of special interest as each type of mode probes a different part of the star. This star is similar to the sdB hybrid pulsator Balloon 090100001 in that it exhibits short-period mode groupings, which can be used to identify pulsation parameters and constrain theoretical models.
keywords:
pulsation, hot subdwarfs.1 Introduction
Hot subdwarf (sdB) stars are horizontal branch stars with masses near to 0.5 M⊙ and very thin (in mass) hydrogen envelopes. Average effective temperatures and surface gravities are about 30 000 K and 5.5, respectively. Although it is clear that sdB stars will eventually enter the white dwarf cooling track without reaching the AGB phase (Dorman, Rood & O’Connell, 1993), their formation as sdB stars is under debate. There are several mechanisms that involve single-star or binary evolution (e.g. D’Cruz, Dorman, Rood et al., 1996; Han, Podsiadlowski, Maxted et al., 2002, 2003). Detection of pulsations in hot sdB stars opened a way to study their interiors and evolution prior to the horizontal branch. First, short period oscillations were found by Kilkenny, Koen, O’Donoghue et al. (1997) in EC 14026 (now officially named V391 Hya). According to theoretical models these pulsations are attributed to pressure ()modes and are driven in the outer part of the stars (Charpinet, Fontaine, Brassard et al., 1997). Several years after their discovery, Green, Fontaine, Reed et al. (2003) announced another kind of variability in sdB stars. The longer-period variations were also identified as stellar oscillations. In this case however, they are attributed to gravity ()modes and originate deeper within these stars than the ()modes (Fontaine, Brassard, Charpinet et al., 2003). Both types share some overlap in the H–R diagram and so the same stellar models are appropriate for studying both kinds of pulsation. Of special interest are these rare stars showing both () and ()modes since models of these stars can constrain their cores and outer regions simultaneously. The first hybrid sdBV star was found by Schuh, Heber, Dreizler et al. (2006) and three more have been discovered using ground-based data, with RAT J0455+1305 being the faintest. The Kepler satellite has also recently discovered several candidate hybrid sdBV stars (Reed, Kawaler, Østensen et al., 2010; Kawaler, Reed, Quint et al., 2010; Østensen, Green, Bloemen et al., 2010b) from its survey phase with follow-up data to be obtained over the next several years.
The brightest known pulsating subdwarf B (sdBV) star has a magnitude of 11.8, the typical brightness is about 14.5 and the faintest are 17 (Østensen, Oreiro, Solheim et al., 2010a). Methods for constraining the pulsation modes include multicolor photometry (Tremblay, Fontaine, Brassard et al., 2006), low-resolution spectroscopy (Telting & Østensen, 2004, 2006; Reed, Eggen, Harms et al., 2009), a combination of these two (Baran, Pigulski & O’Toole, 2008), and time-series observations of line profile variations using high-resolution spectrosocpy (Telting, Geier, Østensen et al., 2008; Telting, Østensen, Oreiro et al., 2010). This last method requires large telescopes, where it is quite difficult to get time. To date, time-series spectroscopy has been obtained for only a few objects, all brighter than 14 mag. Because of the difficulty of obtaining data spanning relatively long periods of time, the faintest stars are usually limited to discovery observations taken in one or no filter at all (so-called white light).
Single-color data, which are typically obtained to increase temporal resolution, are usually not useful for mode identification, which is necessary for constraining the models. To identify modes using broadband single color data one needs to assume trial values for free parameters in models and search for the best fit to observed frequencies. The large number of free parameters does not lead to strong constraints on stellar models. An exception is when the frequency spectrum contains specific features, such as frequency multiplets, mode groupings, or small and large spacings, which constrain mode identifications and therefore reduce the number of free parameters.
Following this approach, and encouraged by the results obtained for other sdBV stars, we decided to obtain photometric observations of one of the faintest sdBV stars discovered so far, RAT J0455+1305 (hereafter RAT0455). Our results clearly show that small and/or moderate telescopes are useful for the asteroseismic study of faint sdBV stars.
| Date | hours | exposure | filter | site |
|---|---|---|---|---|
| 10 Nov 2009 | 7.2 | 30s | none | San Pedro Martir |
| 11 Nov 2009 | 7.4 | 30s | none | San Pedro Martir |
| 14 Nov 2009 | 7.7 | 30s | none | San Pedro Martir |
| 24 Dec 2009 | 1.9 | 30s | BG40 | KPNO |
| 25 Dec 2009 | 8.6 | 30s | BG40 | KPNO |
| 26 Dec 2009 | 8.6 | 30s | BG40 | KPNO |
| 27 Dec 2009 | 8.4 | 30s | BG40 | KPNO |
2 RAT0455
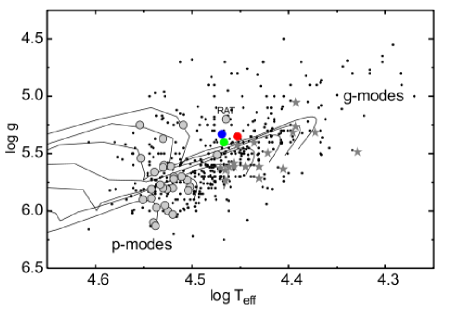
RAT0455 was discovered during the RApid Temporal Survey (Ramsay & Hakala, 2005). The aim of this survey was to search for variability from a few minutes up to several hours, for stars down to 22 mag to find interacting ultra-compact binary systems with orbital periods less than 70 min. The design of the project is also useful for detecting sdBV stars, which can serendipitously occur in the field of view. To date, as a by-product of this survey, one sdBV star has been discovered. It was assigned the designation RAT J0455+1305 in accordance with the survey convention. Discovery observations along with Fourier analysis and a classification spectrum were published by Ramsay, Napiwotzki, Hakala et al. (2006). RAT0455 is 17.2 mag in the the V filter and the amplitude spectrum calculated from the discovery data revealed only one frequency in the ()mode region with a relatively high amplitude. Placing RAT0455 on the logTeff and diagram (Fig.1), we can see that it is similar to other hybrid stars, and indeed Baran & Fox-Machado (2009) detected peaks at low frequencies which were assigned as ()modes.
| mode | Frequency [mHz] | Amplitude [mma] | phase [rad] |
|---|---|---|---|
| fA | 0.22930(21) | 2.2(2) | 1.53(10) |
| fB | 0.24910(36) | 1.3(2) | 5.99(17) |
| fC | 0.27837(22) | 2.1(2) | 3.44(10) |
| fD | 0.30793(25) | 1.7(2) | 1.52(12) |
| fE | 0.31398(21) | 2.1(2) | 0.92(10) |
| fF | 0.48251(37) | 1.1(2) | 2.68(19) |
| f1 | 2.68044(2) | 18.8(2) | 0.90(1) |
| f2 | 2.74899(10) | 3.9(2) | 4.25(5) |
| f3 | 2.67673(9) | 5.3(2) | 5.45(4) |
| f4 | 3.59305(33) | 1.2(2) | 5.47(17) |
| f5 | 4.40179(36) | 1.1(2) | 0.61(18) |
| f1+2 | 5.42943 | 0.8(2) | 5.50(24) |
| groups | RAT0455 | Bal09 |
|---|---|---|
| 1/2 | 0.746 | 0.745 |
| 2/3 | 0.816 | 0.813 |
| 3/4 | – | 0.850 |
3 Observations
3.1 First data
Our first effort to obtain follow-up time-series photometry of RAT0455 was in January 2009 using the 1.5 m telescope at San Pedro Martir Observatory in Baja, Mexico. To maximize signal, the observations were conducted without a filter. Photometric data were obtained during three of five nights. Unluckily, non-photometric conditions deteriorated the data quality. Those data confirmed the dominant periodicity at the frequency and amplitude reported in the discovery paper, and revealed three new small-amplitude peaks in the long period domain. The latter are usually identified as ()modes in sdB stars. Detection of both short and long period modes confirmed that RAT0455 is indeed a hybrid star and increased the number of known hybrid sdBV stars to 4. Details on observations, analysis and conclusions can be found in the paper by Baran & Fox-Machado (2009).
3.2 Late 2009 data
One of the conclusions of our previous paper was that more data were needed to detect more, lower amplitude frequencies (if any existed) and to search for other features, such as evenly spaced periods and frequencies or multiplets. Such features may help to constrain pulsation parameters, in particular the three quantities that describe the pulsation geometry and are usually denoted as , and . In late 2009, we were allocated time on two telescopes: the 1.5 m at San Pedro Martir and the 2.1 m at KPNO. At the former we had five nights while at the latter we planned 7 nights. Again the weather was not cooperative and the overall duty cycle was only about 60% of the available time. At San Pedro Martir we used a Marconi CCD with a square 3 by 3 arcmin field of view. The exposure time was 30 sec with 7 sec read out giving a cadence of 37 sec. As in January we did not use any filter. At KPNO we used an Apogee CCD also with a 3 by 3 arcmin field of view. We used exposure time of 30 sec, with a cadence of 32 sec, but here we used a BG40 filter to improve the contrast with the sky background. The details are given in Table 1. All data were calibrated for instrumental effects and the brightness was extracted by means of PSF fitting and aperture photometry. Those data which were characterized by smaller scatter were taken for the final analysis. The data were corrected for color extinction with each night treated separately.
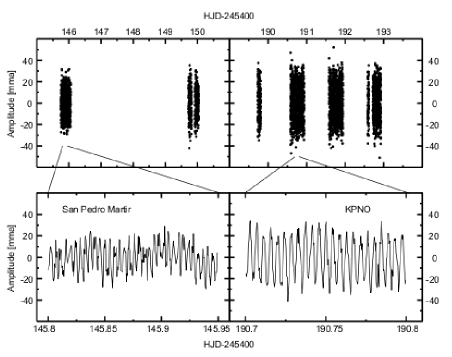
Because of non-photometric conditions on 11 Nov 2009, those data were very noisy and not used in our Fourier analysis. They are not plotted in Figure 2, which shows data obtained at San Pedro Martir (left panels) and at KPNO (right panels). The upper panels for each site show all data, while the lower panels zoom in on a part of one night from each site. From this plot one can see the different quality of data obtained at the two different sites. Data from the 1.5 m telescope are noisier, and the lack of filter results in a broader bandpass which reduced the pulsation amplitudes.
4 Amplitude spectrum
To derive amplitudes, frequencies and phases of the pulsations a Fourier analysis and pre-whitening process were employed. At each step of pre-whitening, sinusoidal terms were improved by means of a non-linear least-squares method. Since the observations in San Pedro Martir were performed without any filter, and were separated in time from the KPNO run, data from different sites were analyzed separately.
4.1 San Pedro Martir data
We only obtained useful data on two nights from San Pedro Martir and because of a flux discontinuity, part of 14 Nov data were removed. This results in a low duty cycle for these two nights of data, with an extra gap in the second night. Combining these two nights causes an aliasing pattern of 1/(4 days) = 2.89 Hz from any real peak which complicates the pre-whitening process. Analysis of the combined data revealed a timing issue in the data from 14 November. It was caused by incorrect times being written to the FITS header. Unfortunately, the reason for this failure remains unknown and so these data were not usable – we are therefore left with just one night’s data. As such, these data did not detect any new frequencies. The only periodicity detected with S/N 4 is the dominant peak at a frequency of 2.6782(7) mHz, an amplitude of 13.1(4) mma and a phase of 4.19(3) rad at epoch 2455145.89952. This poor estimation of the frequency may be caused by bad coverage during our last night.
4.2 KPNO data
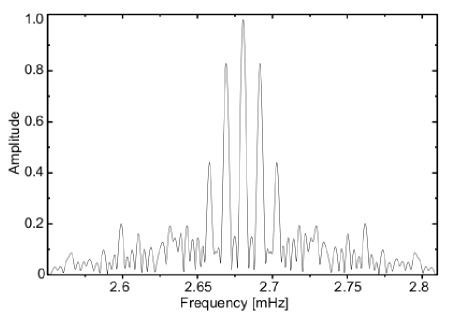
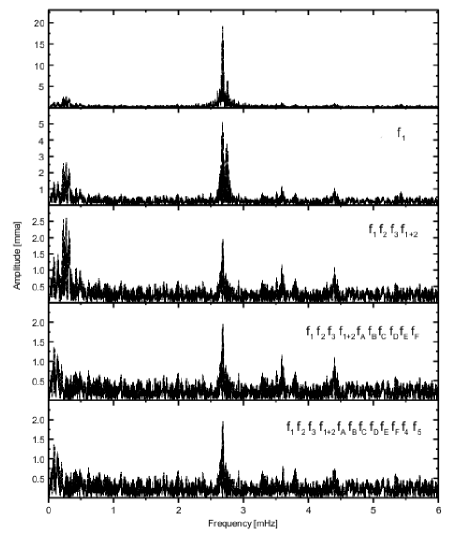
In December 2009, observations were obtained at the 2.1 m telescope at KPNO. Of seven allocated nights, data were collected during the first four. In total, more than 27 hrs of data were gathered. Because of the larger aperture at KPNO compared to San Pedro Martir, these data show a higher signal-to-noise, and even more importantly, no timing issues were present. Data from all four nights were combined and analyzed by means of Fourier analysis. Figure 3 shows the window function calculated from these data. Frequencies, amplitudes and phases are presented in Table 2. Figure 4 shows residual amplitude spectra after a few steps in the pre-whitening process. The frequency resolution for these data is about 3.5 Hz.
During these observations, we detected more frequencies than Baran & Fox-Machado (2009) did. Some were previously detected and are confirmed with these data while others are detected for the first time. Unfailingly, it is easy to say that our dominant peak f1 is the same detected by Baran & Fox-Machado (2009) and our f2 is equivalent to theirs. For other frequencies, it is not as easy to compare the two investigations. Peaks f4 and f5 from our analysis were not detected before. Their locations are relatively regular and similar to those found in Balloon 090100001 (Bal09) (Baran, Pigulski, Kozieł et al., 2005). In the -mode region, it is difficult to compare peaks between seasons because the spectrum is very dense, so we do not know if two peaks with similar but not identical frequencies are the same (to within the errors) or if they are completely different peaks. Frequency proximity may suggest a similarity between fB and f5 or fE and f4, where the former peak is detected in this analysis while the latter in Baran & Fox-Machado (2009). This results in either 5 or 9 independent ()modes detected so far.
Also, we cannot investigate amplitude stability as these data were not obtained in the same filter as Baran & Fox-Machado (2009), so amplitudes cannot be directly compared. Nevertheless, they are for the dominant peak, i.e. 18.8 mma and 17.1 mma (in the previous season). Though the newest data were taken with the BG40 filter, we can conclude that the amplitude has decreased. Amplitudes are decreased when no filter is used as it is averaged out through the wider bandpass. In total we detected 5 high-frequency peaks indicative of -modes and 6 peaks in the low-frequency -mode regime. We also detect one combination frequency of the dominant mode and f2. Its amplitude is very small and below the S/N 4 criterion, but as a combination peak it is also included in the solution.
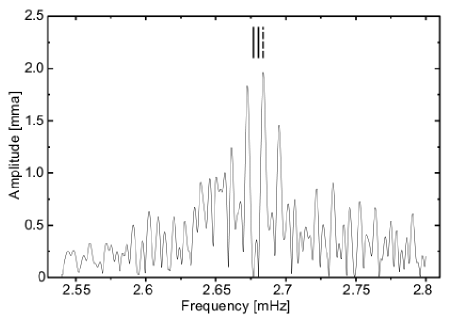
What may be surprising is why, in the lowest panel in Figure 4, the residual amplitude spectrum still has a peak with relatively high amplitude which satisfies the above criterion. Its frequency falls near 2.6838 mHz and pre-whitening of this peak was unsuccessful. Including this peak grossly degenerated the fits to other peaks in the region. It should be noted that f1 is separated from f3 by approximately the formal frequency resolution, and this may cause unreliable fits via non-linear least-squares method. The same problem plagues the periodicity that we cannot pre-whiten. Its separation from the dominant peak is almost the same as for f3. We suspect that with the current temporal coverage we cannot fully resolve all of the peaks around the dominant peak. As such, we emphasize that frequencies with small amplitudes in the vicinity of f1 must be considered with caution.
5 Discussion – Preliminary mode identification
Using our detected frequencies, we would like to correlate them with the three pulsation parameters which describe pulsation geometry, i.e. and , and the radial order . Mode identification is essential for constructing theoretical models of stellar interiors. Experience from other pulsating sdB stars show that reliable mode identifications are not easy.
These stars are faint, and that is why observations typically only use one filter. In such cases, identifying features like multiplets can help to deduce one or more pulsation parameters. Even narrowing the range of possible values can be an advantage to provide tighter constraints on theoretical models. Unfortunately, multiplets are not common among sdBV stars (Reed, 2008). Usually peaks do not appear in a systematic way and then the only way to probe stellar models is to test each frequency against reasonable values of various free parameters. A solution is then attributed to the best fit between the observed frequencies (and global stellar parameters) and the model values (Charpinet, Fontaine, Brassard et al., 2005).
In the case of RAT0455, a dozen frequencies have been detected. Luckily, in the amplitude spectrum there are features which can help in mode identifications. They are similar to what was found in Bal09 (Baran, Pigulski, Kozieł et al., 2005). First is the groupings of ()modes. These are not spread over a wide range of frequencies but instead they are located in specific regions only. In the case of Bal09 they were interpreted as consecutive overtones of the radial modes. This means the adjacent groups contain modes which differ in by 1. In RAT0455 such groupings are also present. However, since the noise level is higher, we could detect only one peak in each of two groups which satisfy the S/N 4 rule. In the residual amplitude spectrum (lowest panel in Figure 4) one can see a signal excess near to f4 and f5. It is likely that those groups contain more peaks but with amplitudes too small to be detected with our data.
The frequency ratio between consecutive regions (calculated using the highest amplitude frequency in each group) as well as those for Bal09 for comparison are presented in Table 3. Our results are very similar to Bal09 which suggests that the interpretation for Bal09 may apply to RAT0455. Therefore, the dominant peak could be a radial fundamental mode, while the second and third groups of frequencies might contain consecutive radial overtones. This means that if f1 is the radial fundamental ( = = 0) then f4 is the first overtone ( = 1, = 0) and f5 is the second overtone ( = 2, = 0). Of course, we could make a mistake assigning the dominant frequency to the fundamental mode instead of a higher overtone with radial order of . Then f4 and f 5 would have = +1 and = +2, respectively. This includes an assumption that the highest amplitude frequency within each group is a radial ( = 0) mode, as they suffer the least from surface cancellation effects. It does not have to be true, but mode identifications of other sdBV stars shows this to be the most likely case (Baran, Pigulski & O’Toole, 2008; Telting & Østensen, 2004).
Another feature even more useful for mode identifications is the existence of multiplets – three or more peaks equally spaced in frequency as a result of rotation (similar to the Zeeman effect in atomic structure). With multiplets, we can almost instantly assign and values to each component. In addition, a rotation period can be derived from the splittings. However Table 2 does not reveal any obvious multiplets. Figure 5 shows the region surrounding the dominant peak after removing f1, f2 and f3. It is obvious that there is another peak satisfying S/N 4 rule, however its removal was not possible as it leads to spurious solutions (see 4.2). It is possible evidence for a multiplet, but the insufficient frequency resolution does not allow us to resolve such closely spaced peaks. The two identified (and removed) peaks along with the one in the residual amplitude spectrum may form an almost equidistant triplet with a mean splitting of f = 3.5 Hz. If we assume that it is a rotationally split =1 mode then the rotation period is . Assuming that the Ledoux constant (Cn,l) for = 1 is small (0.05 Charpinet, Fontaine, Brassard et al., 2000), we derive to be about 3.3 days. Of course if these peaks are components of a triplet, then the dominant peak must have a non-zero value of (i.e. = 1). If so, this is contrary to the conclusion from the previous section that this peak may be radial. Additionally, it would mean that no radial modes are observed, despite their lack of any geometric cancellation. Another possibility is these three peaks do not form a triplet, but rather only two of them i.e. f3 and the residual peak are parts of a triplet with a third member below our detection limit. The splitting would then be around 7 Hz and the corresponding rotation period close to 1.65 days.
6 Conclusions
We presented analysis of photometric data for one of the faintest sdBV stars, RAT0455. Despite its faintness, we obtained sufficient data to detect more, previously undetected frequencies and confirm the hybrid nature of RAT0455. Similar to Bal09, we find non-uniform groupings of short-period -modes and like Bal09, assign them to be the radial fundamental mode and two overtones. Such mode constraints apply directly to stellar models through which we learn about stellar interiors. A possible triplet is found, but higher frequency resolution is needed to confirm its existence. Our results do not, at this point, provide high confidence in our mode identification , but this star looks very promising. Longer data coverage with a lower noise level in the amplitude spectrum would likely detect additional pulsation frequencies and answer these questions. That would make RAT0455 one of the very few sdBV stars with observationally constrained mode identifications.
Acknowledgments
AB gratefully appreciates funding from Polish Ministry of Science and Higher Education under project No. 554/MOB/2009/0. JTG was supported by the Missouri Space Grant Consortium, funded by NASA. LFM acknowledges financial support from the UNAM via PAPIIT grant IN114309.
References
- Baran, Pigulski, Kozieł et al. (2005) Baran A., Pigulski A., Kozieł D. Ogłoza W., Silvotti R., Zoła S., 2005, MNRAS, 360, 737
- Baran, Pigulski & O’Toole (2008) Baran A., Pigulski A., O’Toole S., 2008, MNRAS, 385, 255
- Baran & Fox-Machado (2009) Baran A., Fox-Machado L., 2009, Ap&SS, tmp, 285
- Charpinet, Fontaine, Brassard et al. (1997) Charpinet S., Fontaine G., Brassard P., Chayer P., Rogers F.J., Iglesias C.A., Dorman B., 1997, ApJ, 483, L123
- Charpinet, Fontaine, Brassard et al. (2000) Charpinet S., Fontaine G., Brassard P., Dorman B., 2000, ApJ, 131, 223
- Charpinet, Fontaine, Brassard et al. (2005) Charpinet S., Fontaine G., Brassard P., Green E.M., Chayer P., 2005, A&A, 437, 575
- Dorman, Rood & O’Connell (1993) Dorman B., Rood R.T., O’Connell R.W., 1993, ApJ, 419, 596
- D’Cruz, Dorman, Rood et al. (1996) D’Cruz N.L., Dorman B., Rood R.T., O’Connell R.W., 1996, ApJ, 466, 359
- Fontaine, Brassard, Charpinet et al. (2003) Fontaine G., Brassard P., Charpinet S., Green E.M., Chayer P., Billères M., Randall S.K., 2003, ApJ, 597, 518
- Green, Fontaine, Reed et al. (2003) Green E. M. et al., 2003, ApJ, 583, L31
- Han, Podsiadlowski, Maxted et al. (2002) Han Z., Podsiadlowski Ph., Maxted P.F.L., Marsch T.R., Ivanova N., 2002, MNRAS, 336, 449
- Han, Podsiadlowski, Maxted et al. (2003) Han Z., Podsiadlowski Ph., Maxted P.F.L., Marsh T.R., 2003, MNRAS, 341, 669
- Kawaler, Reed, Quint et al. (2010) Kawaler S.D. et al., 2010, MNRAS, in press
- Kilkenny, Koen, O’Donoghue et al. (1997) Kilkenny D., Koen C., O’Donoghue D., Stobie R. S., 1997, MNRAS, 285, 640
- Østensen, Oreiro, Solheim et al. (2010a) Østensen R.H. et al., 2010, A&A, 513, 6
- Østensen, Green, Bloemen et al. (2010b) Østensen R.H. et al., 2010, MNRAS, tmp, L126
- Ramsay & Hakala (2005) Ramsay G., Hakala P., 2005, A&A, 360, 314
- Ramsay, Napiwotzki, Hakala et al. (2006) Ramsay G., Napiwotzki R., Hakala P., Lehto H., 2006, A&A, 371, 957
- Reed (2008) Reed M.D., 2008 in U.Heber, S.Jeffery & R.Napiwotzki, eds, Hot Subdwarf and Related Objects ASP Conference Series, San Francisco, 392, 351
- Reed, Eggen, Harms et al. (2009) Reed M.D. et al., 2009, A&A, 493, 175
- Reed, Kawaler, Østensen et al. (2010) Reed M.D. et al., 2010, MNRAS, in press
- Schuh, Heber, Dreizler et al. (2006) Schuh S., Heber U., Dreizler S., Heber U., O’Toole, S.J., Green E.M., Fontaine G., 2006, A&A, 445, 31
- Telting & Østensen (2004) Telting J. H., Østensen R. H., 2004, A&A, 419, 685
- Telting & Østensen (2006) Telting J. H., Østensen R. H., 2006, A&A, 450, 1149
- Telting, Geier, Østensen et al. (2008) Telting J. H., Geier S., Østensen R. H. et al., 2008, A&A, 492, 815
- Telting, Østensen, Oreiro et al. (2010) Telting J. H., Østensen R. H., Oreiro R., Heber U., Vuckovic M., Randall S., Baran A., 2010, Ap&SS, tmp, 88
- Tremblay, Fontaine, Brassard et al. (2006) Tremblay P.-E., Fontaine G., Brassard P., Bergeron P., Randall S.K., 2006, ApJS, 165, 551