J08069+1527: A newly discovered high amplitude, hybrid subdwarf B pulsator
Abstract
We present our discovery of a new hybrid pulsating subdwarf B star, J08069+1527. The effective temperature and surface gravity of 28,500400 K and 5.370.04 dex, respectively, place this object inside the instability strip and also among other pulsating hot subdwarfs of a hybrid nature, right next to another fascinating star: Balloon 090100001. From this proximity, we anticipated this star could pulsate in both high and low frequency modes. Indeed, our analysis of photometric data confirmed our prediction. We detected two peaks in the high frequency region and two other peaks at low frequencies. In addition, the amplitude of the dominant mode is very high and comparable to the dominant peaks in other hybrid subdwarf B stars. Since this star is bright, we performed time-series low resolution spectroscopy. Despite a low signal-to-noise (S/N) ratio, we were able to detect the main peak from these data. All our results strongly indicate that J08069+1527 is a high amplitude pulsating hot subdwarf B star of hybrid nature. By analogy to the other pulsating sdB star, we judge that the dominant mode we detected here has radial nature. Future stellar modeling should provide us with quite good constrains as p- and g-modes presented in this star are driven in different parts of its interior.
keywords:
stars: subdwarfs, asteroseismology.1 Introduction
Hot subdwarf B (sdB) stars are horizontal branch stars with masses about 0.5 M⊙ and very thin, in mass, hydrogen envelopes. Their average effective temperature and surface gravity are about 30 000 K and 5.5, respectively. Although the future evolution of the sdB stars to the white dwarf cooling track is generally accepted, their formation prior to the sdB stage is under debate resulting in several mechanisms that involve single-star or binary evolution (e.g. D’Cruz et al., 1996; Han et al., 2002, 2003).
The detection of pulsations in sdB stars opened a way to study their interiors and may help to understand their evolution prior to the horizontal branch. First, short period oscillations were found by Kilkenny et al. (1997) in EC 14026-2647 (now officially named V391 Hya). According to theoretical models, these pulsations are attributed to pressure modes and are driven in the outer part of the star (Charpinet et al., 1997). Several years later, Green et al. (2003) announced another kind of variability in sdB stars. In this case, however, the pulsations were identified with gravity modes. Following Fontaine et al. (2003) they are driven deeper in the sdB stars than the pressure ones. Short-period sdBV (sdB Variable) stars are located at higher, while long-period sdBV stars at lower effective temperatures.
The pulsation modes of the two kinds of sdBVs probe different regions, and stars displaying both types are particularly interesting since their interiors can be better constrained. Such hybrid pulsations were first found in DW Lyn (Schuh et al., 2006) and another three objects with clear pulsations at both short and long periods have so far been recognized; Balloon 090100001 (Baran et al., 2005; Oreiro et al., 2005), V391 Peg (Lutz et al., 2009) and RAT 0455+1305 (Baran & Fox-Machado, 2010). Another star, CS 1246, has similar and and one high amplitude short periodicity detected. Unfortunately, because of noisy data, the detection threshold in the low frequency region is too high. The best data are in the r’ filter, and the amplitude spectrum calculated from these data contains some excess signal in the low frequency region, but more data are needed to confirm if CS 1246 is a hybrid pulsator. This should encourage others to obtain more observations of CS 1246. Extremely high precision photometry obtained with the Kepler spacecraft has revealed several long period sdBVs (Reed et al., 2010; Baran et al., 2011) and one short period sdBV (Kawaler et al., 2010) that appear to also show hybrid modes, at least intermittently, that are so weak that they can only be detected using satellite data. An unusual hybrid pulsator in an eclipsing binary, 2M1938+4603, was found to show an exceptionally large number of weak (0.5 mma) pulsation modes spanning all frequencies from the long period to the short period regime (Østensen et al., 2010a).

Typical amplitudes of sdBV stars showing high frequency oscillations are below 1%, which corresponds to 10 mma. Most hybrid stars have unusually high amplitudes (few per cent), making them extremely desirable. Since sdBV stars tend to be faint ( mag) high amplitude pulsators are easier to observe, even with 1 m class telescopes.
As was shown by Baran & Fox-Machado (2010), for hybrid stars the dominant modes in both frequency domains appear at very similar frequencies. These are 0.3 mHz for gravity modes and 2.8 mHz for pressure modes. As for gravity modes, it may not be so surprising as the peaks are detected in a very small range, but for the pressure modes it is more astonishing. This may indicate that these stars are alike in internal structure and/or evolutionary status on the horizontal branch. In this paper we present our discovery of a new hybrid sdBV star with a high amplitude short period mode. We obtained data on four nights, including the discovery one.

2 J080656.7+1527
The target J08069+1527, has UV magnitudes FUV = 13.68, NUV = 13.86 in the GALEX All-sky Imaging Survey (Martin et al., 2005, AIS) observation obtained on February 2, 2006. After comparing the UV magnitudes with visual photometry in the NOMAD survey ( = 13.88, = 14.23, = 14.83), we flagged the target as a likely sdB star, and it entered a list of bright spectroscopy targets that served as a poor weather backup for a photometric observation run in the NOT search for pulsating sdBs in January 2009 (Østensen et al., 2010b). The extracted spectrum was fitted to a model atmosphere spectrum, using the same procedure as for the other sdBs observed during the search program. The derived effective temperature of 28,877(202) K and surface gravity of 5.34(0.03) dex along with its encouraging brightness made it a priority target for the next observing season. Recently, Vennes, Kawka & Németh (2010) have published their first results from a survey of UV-excess stars in the GALEX archive, and J08069+1527 is included in their sample. Their determination of Teff and is fully consistent with ours, within the errors.
| Date [UT] | hours | exposure | filter | site | observer |
| 30 Dec 2009 | 4.0 | 12s | BG40 | KPNO | ASB,JTG |
| 10 Jan 2010 | 5.4 | 30s | BG40 | Baker | LH,MDR |
| 11 Jan 2010 | 7.0 | 31s | B(Geneva) | Mercator | KS |
| 12 Jan 2010 | 6.2 | 31s | B(Geneva) | Mercator | KS |
| 20 Jan 2009 | —- | 600s | spectrum | NOT | RO |
| 07 Jan 2010 | 6.6 | 30s | spectra | NOT | JHT |
3 Time series photometry
3.1 Discovery data
We performed time-series photometry of J08069+1527 on 30 December 2009 using the KPNO 2.1 m telescope. We used an Apogee CCD with a BG40 filter (wide band covering UBV filters range) with 12 sec exposure times. Seeing conditions allowed us to set 22 binning resulting in very short readout times of about 1 sec. To determine if a star is variable or not, we used near-real-time software (developed at Missouri State University) during our observations to monitor the light curve as it was obtained. Right after we started to collect data, it was obvious that this star changes its brightness and the amplitude of this variability is relatively high. In fact, the amplitude was so big that even from our real-time software it was easy to estimate the period and amplitude of the variability. We estimated less than 10 minutes for the period and about 20 mmag for the amplitude. Based on its physical parameters, we assumed this variability to be caused by pulsation and realized that this is another (out of about seven known so far) high amplitude pulsating sdB star and decided to carry on observations on that night as long as possible. In total we collected 4 hours of data.
3.2 Supplemental data
After we found J08069+1527 to be an sdB pulsator with a high amplitude mode, we tried to obtain more time-series photometry to extend time coverage to lower noise level in the amplitude spectrum and increase frequency resolution. Unluckily, another opportunity to observe this star appeared only after 10 days. This long gap makes it harder to combine all data together since a window function gets too complicated and so does pre-whitening. Follow-up data were collected at Baker Observatory and with the Mercator telescope on La Palma. At Baker Observatory we used a Photometrics RS-1340 CCD with a BG40 filter. Exposure times were set to 30 sec along with 1 sec readout time. At the Mercator telescope we used the Merope CCD camera, which was recently upgraded with a new E2V frame transfer CCD with 20483074 illuminated pixels (Østensen, 2010c). Here we used a B filter (Geneva system) setting the data cadence period to about 31 sec. We include all this information in Tab.1.
We calibrated all star images for instrumental effects (bias, dark, flat field) and extracted brightnesses of target and field stars. In the next step we calculated differential photometry using a few comparison stars. All these tasks were done by means of the Daophot package (Stetson, 1987) with a graphical user interface (FinRed, developed by ASB). Because the field of view only covers a few-arcminutes on the sky, the first order extinction (differential extinction) was negligible and long term variations (on the scale of run duration) were de-trended by subtracting a cubic spline curve. We assume here that any change in brightness, on time scales of about 6 hours or longer, is not intrinsic to the star and is likely caused by non-perfectly removed extinction, either first or second order or other atmospheric effects.
In the next step, treating all nights separately, we transformed all brightnesses to fluxes and subtracted a mean value. Resulting light curves were then centered around zero. Next, we analyzed these data by means of a Fourier analysis. We present our discovery light curve of J08069+1527 obtained at KPNO on 30 Dec 2009 in Fig.1. One can note that besides short period variability some long term variability is also present in the light curve. We present all data in Fig.2.

3.3 Amplitude spectrum
Although we have data taken with three different telescopes, we decided not to combine them all together. It is because data from KPNO and Baker, taken in the same filter, are 10 days apart. When combining such data, we arrived with a higher noise level in the amplitude spectrum and a very complex window function. In the case of data from Baker and Mercator, although collected on consecutive nights, they are not in the same filter. As a result, during the pre-whitening process, we can obtain residual (fake) peaks caused by different amplitudes and perhaps phases of modes observed in different filters.
Since the telescope at KPNO is the biggest among those we used, data collected on that site are characterized by the smallest noise level in their amplitude spectrum. These data allow us to detect the highest number of peaks at S/N4 used as our threshold. We detected two peaks in the high frequency region and two in the low frequency region. The dominant peak has a high amplitude and a frequency similar to some other sdBV stars discovered so far. Baran & Fox-Machado (2010) showed that all hybrid sdBV stars detected from ground have a main dominant high frequency peak at similar frequencies around 2.8 mHz. The main peak in J08069+1527 is also located in the same region. What is more, its effective temperature and surface gravity is almost the same as other hybrids, particularly Balloon 090100001. In addition, we found two peaks in the low frequency region. Precise estimation of their significance is rather hard since not all the signal can be pre-whitened from that frequency region. This increases the real noise level. A detection threshold used in our analysis is an average through all frequencies in the amplitude spectrum, which might be a source of underestimation in the low frequency region. To estimate the noise level in that region more reliably, we used the adjoining 0.35–1 mHz region and assumed it to be valid for those two peaks. Although the detection threshold increased, they still remained significant. Amplitude spectra with all pre-whitening steps calculated from KPNO data are shown in Fig.3.

In pre-whitening data taken at Baker, we could safely secure only one peak at the same frequency (within errors) as the dominant one from analysis of KPNO data. Others, if present are below the detection threshold. Only one peak detected here should not be surprising as the average noise level reaches 0.7 mma so only peaks higher than 2.8 mma could be detected with sufficient confidence. Looking at the result from KPNO, none but the dominant peak satisfies this condition. An amplitude spectrum as well as the residual one is shown in Fig.4
At Mercator we obtained data on two consecutive nights. Although here we have better resolution and more points collected, we could not detect more peaks compared to the KPNO data. There is some signal excess in the low frequency domain. Unfortunately, the noise level is too high to confirm any peaks in this region. We can only confirm two peaks in the high frequency region. The dominant peak we detected here has the same frequency as the one detected in KPNO and Baker data while the other has a similar frequency but barely exceeds the error limits. However, apart from amplitude errors, frequency errors are sensitive to the length of observations. That is why we may consider the frequencies derived from Mercator data as the more precise ones. On the other hand, after removing the dominant peak, the residual amplitude spectrum still contains a small peak at the frequency of the removed one (Fig.5). It can mean that this peak is physically unstable, or there may be a mode beating, or some instrumental effects that cause either frequency, or amplitude to be different on each night. From Tab.2 we can see that frequencies are not changing within the given errors. Comparing amplitudes is harder since at Mercator we used a different filter. By comparing KPNO and Baker data, which were obtained in the same filter we can conclude that the amplitude has not changed over 10 days (or is changing with periodicity of about 10 days). Trying to solve this issue we chopped Mercator data into nightly chunks and Fourier analyzed them separately. From the Fourier solution, we found that timing issues between nights is not bigger than 0.5 sec. However, the amplitudes from these two nights are substantially different. We derived 25.72(42) mma and 29.12(42) mma on the first and second nights, respectively. Since the residual of the pre-whitened data roughly equals the difference of the amplitudes from the two nights, we can conclude that the cause is the change in amplitude.

| KPNO | Baker | Mercator | |||||||
|---|---|---|---|---|---|---|---|---|---|
| mode | f [mHz] | A [mma] | phase [rad] | f [mHz] | A [mma] | phase [rad] | f [mHz] | A [mma] | phase [rad] |
| fA | 0.2926(47) | 1.68(18) | 3.74(12) | ||||||
| fB | 0.3577(53) | 1.63(17) | 1.63(12) | ||||||
| f1 | 2.81862(28) | 22.06(16) | 2.237(7) | 2.8188(7) | 21.23(52) | 3.46(02) | 2.81858(4) | 27.29(30) | 2.46(1) |
| f2 | 2.6059(31) | 1.98(16) | 4.45(8) | 2.6119(4) | 2.83(30) | 1.95(11) | |||
4 Time-series spectroscopy
We performed time-series spectroscopy on the night starting on 7 Jan 2010. We used ALFOSC at the Nordic Optical Telescope (NOT) to obtain 472 low resolution spectra. We used grism#16 and, for all but the first few exploratory spectra, we used a 1.3 - arcsec wide vertical slit. Our dataset spans a total of 6 hours and 40 minutes.
We used a small window and 22 binning in the spatial direction to minimize readout-overheads; the window allowed for 28 arcseconds of sky on either side of the stellar spectrum. To avoid under-sampling and to not smear the dominant variability too much, we set the exposure time to 30 sec, achieving a 42 - sec cycle time. In the course of our run we obtained spectra of a helium arc lamp to calibrate the wavelength.
Unfortunately, since the brightness of this star is about 14 mag in the B filter only, we could not achieve very high S/N ratio. For single spectra we had typical S/N15 in the 440-480 nm region, while we reached S/N150 in the average spectrum shown in Fig.6.
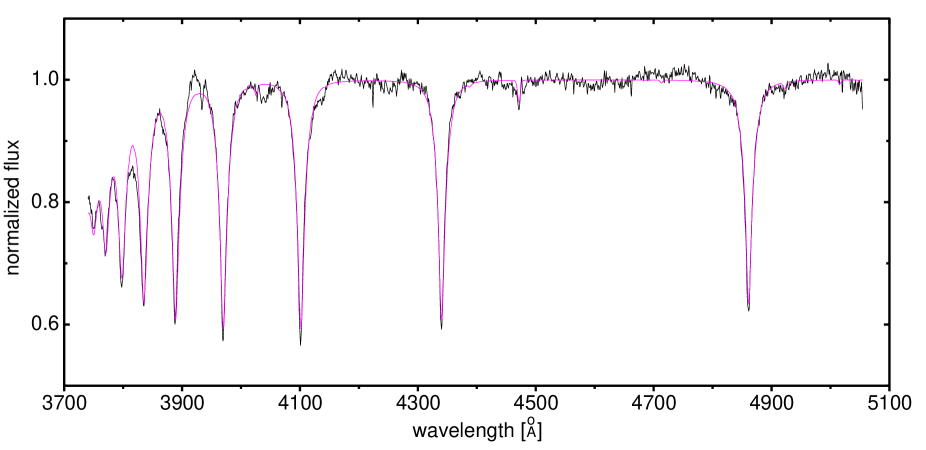
We used standard IRAF procedures to reduce and calibrate the spectra, leading to 472 extracted spectra. We normalized the average spectrum to unity, using a low-order polynomial fit. The resulting spectrum was then fitted with a model spectrum, and the resulting model spectrum was used for guidance in the final normalization of the average spectrum. The stellar parameters we derived from the average spectrum (, and in Fig.7) were consistent for different normalization/rectification methods that either employ straight-line fits around each Balmer line or a multi-order polynomial fit that rectifies the complete spectrum at once. Then all individually extracted spectra were rectified using the fit that was needed to normalize the average spectrum. Finally the individual spectra were scaled to get their continuum at unity, using a simple parabolic fit in the regions with no absorption lines.
We derived = 28,063163 K, = 5.390.02 and = -2.9710.064 dex. These values are different than those derived from spectrum taken in January 2009 so we adopt an average value for all three parameters: = 28,500400 K, = 5.370.05 dex and = -2.960.10. The reader should be aware, though, that systematic effects from the model grid can give shifts on the order of 2000 K and 0.2 dex in and , respectively.
To look for radial velocity (RV) displacements we used the IRAF cross-correlation routine FXCOR, finding the radial-velocity shift of each individual spectrum with respect to that of the average spectrum. We included only the wavelength regions around 7 Balmer lines (H-H10) in the cross-correlation. We fitted a Gaussian function to find the center of the cross-correlation function, which we adopted as a measure of the radial-velocity shift. As a result we obtained Heliocentric Julian Date along with RV shifts and their errors. We present the radial velocity curve in Fig.8. This result was subject to Fourier analysis in order to extract any periodicity from the data. The amplitude spectrum is shown in Fig.9. By means of non linear least square fitting, we detected only one peak which satisfies S/N4. Its frequency, amplitude and phase with errors are: 2.8202(42) mHz, 6.1(1.0) km/s and 5.69(17) rad, respectively. The phase is given at HJD = 2455204.577483. We present the radial velocity curve folded with the period obtained in our analysis in Fig.10. The periodicity detected in a Fourier space barely meet our significance level as S/N = 4.55.


5 Summary and conclusion
In this paper we presented our discovery of a new hybrid pulsating subdwarf B star, J08069+1527. Effective temperature and surface gravity place this object in the instability strip among other hybrid subdwarfs. From our analysis of photometric data we detected four peaks, including two in the low frequency domain, confirming our prediction. As the star is relatively faint, spectroscopic data is not sufficient to detect more than just the dominant mode we found in the discovery data. However, it proved that time-series spectroscopy at 2 m class telescope can support our analysis with radial velocity shifts down to 14 mag hot subdwarf stars, particularly when data are taken over several nights.

As it turns out, physical parameters are not the only similarities J08069+1527 has to other hybrid sdBV stars. As shown in Baran & Fox-Machado (2010, in Fig. 9), some hybrids share a common frequency for their dominant variation and J08069+1527 also has this characteristic. It might be that these stars are in very similar evolutionary state and/or have very similar stellar structure. If so, we could use the result obtained by Baran, Pigulski & O’Toole (2008) to constrain the degree of the dominant mode to = 0. Balloon 090100001 has photometrically constrained pulsation modes using multiplets (Baran et al., 2009). The dominant periodicity in Balloon 090100001, associated with an mode, has a photometric amplitude in a B filter of 53 mma and a radial velocity (RV) amplitude of 19.2 km/s. The amplitude ratio of RV/B is 0.362. The dominant periodicity in J08069+1527 has an amplitude of 27 mma in a B(Geneva) filter and RV = 6.1km/s which results in a ratio of 0.226. The difference in ratio is substantial, however, the amplitude spectrum of J08069+1527 might be unresolved and the amplitude of the dominant mode affected by poor resolution. More data of J08069+1527 taken over several days may help to better compare results on these two interesting stars.
Acknowledgments
AB gratefully appreciates funding from Polish Ministry of Science and Higher Education under project No. 554/MOB/2009/0. JTG was supported by the Missouri Space Grant Consortium, funded by NASA. R.H.Ø acknowledges funding from the European Research Council under the European Community’s Seventh Framework Programme (FP7/2007–2013)/ERC grant agreement N 227224 (prosperity), as well as from the Research Council of K.U.Leuven grant agreement GOA/2008/04. Based on observations made with the Nordic Optical Telescope, operated on the island of La Palma jointly by Denmark, Finland, Iceland, Norway, and Sweden, in the Spanish Observatorio del Roque de los Muchachos of the Instituto de Astrofisica de Canarias.
References
- Baran et al. (2005) Baran A., Pigulski A., Kozieł D., Ogłoza W., Silvotti R., Zoła S., 2005, MNRAS, 360, 737
- Baran, Pigulski & O’Toole (2008) Baran A., Pigulski A., O’Toole S., 2008, MNRAS, 385, 255
- Baran et al. (2009) Baran A. et al., 2009, MNRAS, 392, 1092
- Baran & Fox-Machado (2010) Baran A., Fox-Machado L., 2010, Ap&SS, 329, 193
- Baran et al. (2011) Baran A. et al., 2011, MNRAS, accepted
- Barlow et al. (2010) Barlow B. N. et al., 2010, MNRAS, 403, 324
- Charpinet et al. (1997) Charpinet S., Fontaine G., Brassard P., Chayer P., Rogers F.J., Iglesias C.A., Dorman B., 1997, ApJ, 483, L123
- D’Cruz et al. (1996) D’Cruz N.L., Dorman B., Rood R.T., O’Connell R.W., 1996, ApJ, 466, 359
- Fontaine et al. (2003) Fontaine G., Brassard P., Charpinet S., Green E.M., Chayer P., Billères M., Randall S.K., 2003, ApJ, 597, 518
- Green et al. (2003) Green E. M. et al., 2003, ApJ, 583, L31
- Han et al. (2002) Han Z., Podsiadlowski Ph., Maxted P.F.L., Marsch T.R., Ivanova N., 2002, MNRAS, 336, 449
- Han et al. (2003) Han Z., Podsiadlowski Ph., Maxted P.F.L., Marsh T.R., 2003, MNRAS, 341, 669
- Kawaler et al. (2010) Kawaler S.D. et al., 2010, MNRAS, 409, 1487
- Kilkenny et al. (1997) Kilkenny D., Koen C., O’Donoghue D., Stobie R. S., 1997, MNRAS, 285, 640
- Lutz et al. (2009) Lutz R., Schuh S., Silvotti R., Bernabei S., Dreizler S., Stahn T., Hügelmeyer S.D., 2009, A&A, 496, 469
- Martin et al. (2005) Martin D.C. et al., 2005, ApJ, 619, L1
- Oreiro et al. (2005) Oreiro R., Pérez Hernández F., Ulla A., Garrido R., Østensen R., MacDonald J., 2005, A&A, 438, 257
- Østensen et al. (2010a) Østensen R.H. et al., 2010a, MNRAS, 408, L51
- Østensen et al. (2010b) Østensen R.H. et al., 2010b, A&A, 513, 6
- Østensen (2010c) Østensen R.H., 2010c, Astr. Nachr., 331, 1029
- Reed et al. (2010) Reed M.D. et al., 2010, MNRAS, 409, 1496
- Schuh et al. (2006) Schuh S., Heber U., Dreizler S., Heber U., O’Toole, S.J., Green E.M., Fontaine G., 2006, A&A, 445, 31
- Stetson (1987) Stetson P.B., 1987, PASP, 99, 191
- Vennes, Kawka & Németh (2010) Vennes S., Kawka. A, Németh P., 2010, MNRAS, 410, 2095