Modelling lightcurves and spectra of transient Anomalous X-ray Pulsars
Abstract
We present the first detailed joint modelling of both the timing and spectral properties during the outburst decay of transient anomalous X-ray pulsars. We consider the two sources XTE J1810-197 and CXOU J164710.2-455216, and describe the source decline in the framework of a twisted magnetosphere model, using Monte Carlo simulations of magnetospheric scattering and mimicking localized heat deposition at the NS surface following the activity. Our results support a picture in which a limited portion of the star surface close to one of the magnetic poles is heated at the outburst onset. The subsequent evolution is driven both by the cooling/varying size of the heated cap and by a progressive untwisting of the magnetosphere.
Keywords:
radiation mechanisms: non-thermal — sources (individual): XTE J1810-197, CXOU J164710.2-455216 — stars: magnetic fields — stars: neutron:
97.60.Jd, 98.70.Qy, 98.70.Rz1 Introduction
Anomalous X-ray pulsars (AXPs) and soft gamma repeaters (SGRs) are two classes of X-ray sources whose phenomenology may be explained by the presence of a magnetar111See this volume for alternative scenarios, i.e. an ultra-magnetized neutron star (NS) with a magnetic field as high as G. Both AXPs and SGRs exhibit variability in their persistent X-ray emission over a timescale of years, characterized by large flux changes (factor 10-100) and drastic alterations in the spectral and timing properties. The recently discovered Transient AXPs (TAXPs) represent the far end of this behaviour. Both XTE 1810-197 and CXOU J164710.2-455216 underwent a sudden outburst during which their X-ray flux increased by more than two orders of magnitude and the emission of SGR-like bursts was observed. Their post-outburst decline has continued for a few years after the event and has been monitored extensively with XMM-Newton.
These observations provided a large sample of high-quality data, the analysis of which offers an unprecedented opportunity to unveil the mechanisms responsible for SGRs/AXPs activity. Here we present a detailed joint modelling of both the timing and spectral properties during the outburst decay of these two TAXPs. We describe the source decline in the framework of a twisted magnetosphere model, and make use of the spectral models presented and applied by ntz (NTZ in the following), and za09 , who studied radiative transfer in a globally twisted magnetosphere by means of a 3D Monte Carlo code. Each model is characterized by the magnetospheric twist angle , the electron (constant) bulk velocity , and the seed photon temperature . The polar field is fixed at . Besides, in order to mimick localized heat deposition at the NS surface following the activity, we generalize the original application by NTZ by allowing for a complex thermal surface map. For details on the method of analysis and the observational data, we refer to the original paper by ale and references therein.
2 TAXP Analysis
XTE 1810-197 was serendipitously discovered in 2003 with RXTE, and a comparison with archival RXTE data showed it produced an outburst around Nov 2002, followed by a monotonic decline of the X-ray flux ib04 ; is04 ; gh05 ; gh07 ; pe08 ; be09 . In this investigation we use 8 XMM-Newton observations of the source, covering a baseline of 4 years between Sep 2003 and Sep 2007. As for CXOU J164710.2-455216, we use 6 XMM-Newton observations made from Sep 2006 to Aug 2009, across the Nov 2006 outburst of the source muno07 ; is07 .
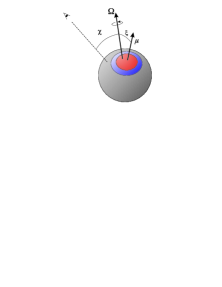
Our strategy proceeds as follows. We first jointly fit the pulse profiles in three energy bands (0.5-10 keV, 0.5-2 keV, 2-10 keV), allowing for the twist angle, electron bulk velocity and thermal map to vary in time (but requiring that, for a given epoch, they are the same in the different energy bands), and imposing that the geometrical viewing angles (see Fig.1) must be the same at all epochs. This step provides us with an estimate of the source parameters and viewing angles. We then use our Monte Carlo code to compute the phase averaged spectra, at the various epochs, for the same sets of parameters and compare with the spectral data. The main reason at the basis of this strategy is that we found that spectral fitting alone is unable to constrain the two geometrical angles, while lightcurve fitting allows for a better control of complex, time-evolving thermal maps.
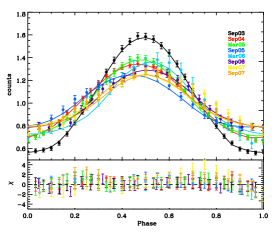
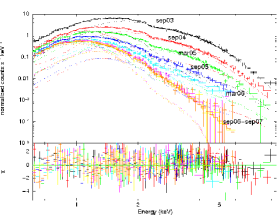
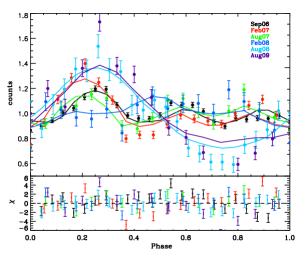
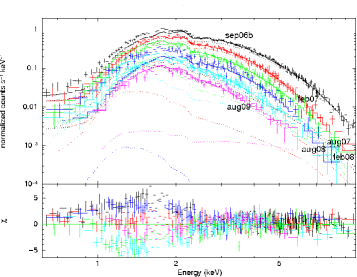
For both sources, we find that the best fit is obtained by using a three temperature map, made of a hot spot, a warm corona and a cooler region (see Fig. 1). In both cases the method was successful and we reached a satisfactory fit of both the pulse profiles and spectra (see Figs. 2,3 and the original paper for details and for the values of the fitting parameters).
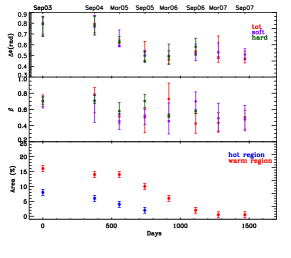
The evolution of the single spectral components during the outburst decay was nevertheless quite different for the two TAXPs. For XTE J1810-197 (see Fig. 4, left), we found that the hot cap decreased in size and temperature, until it became indistinguishable from the warm corona around March 2006. The warm corona also shrinked, but it initially cooled down to keV, and then its temperature remained constant. It was still visible in our last observation (Sep 07), with a size down to 0.5% of the NS surface. The rest of the NS remained at a temperature comparable with that measured in quiescence by ROSAT during the entire evolution, suggesting that the outburst likely involved only a fraction of the star surface (see also be09, ). The best-fitting viewing geometry is given by , .
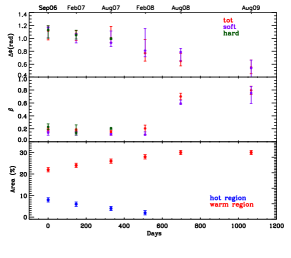
The evolution of CXOU J164710.2-455216 was quite different (Fig. 4, right): in this case the hot cap decreased in and size, and the warm corona remained constant at keV while it increased in size. Interestingly, the area of the hot+warm region is constant ( of the NS surface), while the remaining is cooler, at keV. This may suggest that the thermal map, in quiescence, is made of two components: a warm polar region superimposed to the cooler surface. The outburst might have heated a portion of the warm cap, producing the hot zone which then cooled off; we note that the hot spot disappeared ( Aug 08) when the pulse profile switched from three-peaked to single-peaked. The best-fitting viewing geometry is , .
2.1 Conclusions
To our knowledge this is the first time that a self-consistent spectral and timing analysis, based on a realistic modelling of resonant scattering, is carried out for magnetars, considering simultaneously a large number of datasets over a baseline of years. The results support a picture in which only a limited portion of the magnetosphere was affected by the outburst (twist), and provide identification for the location, meaning and evolution of the various thermal components. Future developments will require detailed spectral calculations in a magnetosphere with a localized twist which decays in time belo09 and will be matter of future investigations.
References
- (1) L. Nobili, R. Turolla, S. Zane, MNRAS 386, 1527-1542 (2008).
- (2) S. Zane, N. Rea, R. Turolla, L. Nobili, MNRAS 398, 1403-1413 (2009).
- (3) A. Albano, R. Turolla, G.L. Israel, S. Zane, L. Nobili, L. Stella, ApJ 722, 788-802 (2010).
- (4) A.I. Ibrahim, et al., ApJ 609, L21-L24 (2004).
- (5) G.L. Israel, et al., ApJ 603, L97-L100 (2004).
- (6) E.V. Gotthelf, & J.P. Halpern, ApJ 632, 1075-1085 (2005).
- (7) E.V. Gotthelf, & J.P. Halpern, Ap&SS 308, 79-87 (2007).
- (8) R. Perna, & E.V. Gotthelf, ApJ 681, 522-529 (2008).
- (9) F. Bernardini, et al., A&A, 498, 195-207 (2009).
- (10) M.P. Muno, et al., MNRAS, 378, L44-L48 (2007).
- (11) G.L. Israel, et al., ApJ, 664, 448-457 (2007).
- (12) A.M. Beloborodov, ApJ, 703, 1044-1060 (2009).