H I CONTENT AND OPTICAL PROPERTIES OF FIELD GALAXIES FROM THE ALFALFA SURVEY. I. SELECTION OF A CONTROL SAMPLE
Abstract
We report results from a study of the H I content and stellar properties of nearby galaxies detected by the Arecibo Legacy Fast ALFA blind 21-cm line survey and the Sloan Digital Sky Survey. We consider two declination strips covering a total area of 9 hr 16 deg in the general direction of the Virgo Cluster. The present analysis focuses on gas-rich galaxies expected to show little or no evidence of interaction with their surroundings. We seek to assemble a control sample suitable for providing absolute measures of the H I content of gaseous objects, as well as to study the relationship between H I emission and widely-used optical measures of morphology. From a database which includes more than H I detections, we have assembled three samples that could provide adequate H I standards. The most reliable results are obtained with a sample of 5647 sources found in low density environments, as defined by a nearest neighbor approach. The other two samples contain several hundred relatively isolated galaxies each, as determined from standard isolation algorithms based either on a combination of spectroscopic and photometric information or solely on photometric data. We find that isolated objects are not particularly gas-rich compared to their low-density-environment counterparts, while they suffer from selection bias and span a smaller dynamic range. All this makes them less suitable for defining a reference for H I content. We have explored the optical morphology of gaseous galaxies in quiet environments finding that, within the volume surveyed, the vast majority of them display unequivocal late-type galaxy features. In contrast, bona fide gas-rich early-type systems account only for a negligible fraction of the 21-cm detections. We argue that H I emission provides the most reliable way to determine the morphological population to which a galaxy belongs. We have also observed that the color distribution of flux-limited samples of optically-selected field H I emitters does not vary significantly with increasing distance, while that of non-detections becomes notably redder. This result suggests that the colors and H I masses of gas-rich galaxies cannot be very closely related.
1 INTRODUCTION
One of the defining characteristics of recent extragalactic research is the execution of wide-area galaxy surveys, which have in many ways revolutionized our understanding of both large-scale structure and galaxy evolution. Most of them have been conducted in the optical/near-infrared regime, where stellar light dominates. Multicolor imaging surveys of virtually the entire sky, some of which contain over a million extended sources, notably the Two Micron All Sky Survey (2MASS; Skrutskie et al., 2006), have been complemented by spectroscopic surveys, such as the fifth edition of the Sloan Digital Sky Survey (SDSS) Quasar Catalog (Schneider et al., 2010), based upon the SDSS Seventh Data Release (DR7), which ranges in redshift from the local universe to near the reionization epoch () when the first galaxies may have appeared.
The improvement in technological capabilities over the past decade has enabled the astronomical community to build large homogeneous samples of extragalactic objects in other regions of the electromagnetic spectrum as well —the radio wavelength regime being one of the most prolific in this respect—, allowing us to develop a more thorough account of the extragalactic realm. While early blind neutral hydrogen (H I) surveys, such as the Arecibo H I Strip Survey (Zwaan et al., 1997) or the Arecibo Dual-Beam Survey (Rosenberg & Schneider, 2002), yielded useful estimates of the H I mass function from shallow samples containing a relatively modest number of detections, the advent of focal plane arrays at 21-cm enabled to carry out wide solid angle surveys that led to a significant increase in the depth and, especially, size of the databases. Between 1997 and 2001, the H I Parkes All-Sky Survey (HIPASS; Meyer et al., 2004) used a thirteen-beam array to sample the entire southern sky and the northern up to , with a beam of 15.5 arcmin and a sensitivity of 17 mJy per beam at a spectral resolution of 18 km s-1. With a velocity range of to km s-1 and more than 4000 H I sources identified in the southern sky alone, HIPASS was the first large untargeted H I survey that approached the dimensions necessary for a fair sampling of the local volume.
Currently, a seven-beam array named ALFA (Arecibo L-band Feed Array), installed at the Arecibo telescope in 2004, is being used to carry out the Arecibo Legacy Fast ALFA Survey (ALFALFA; Giovanelli et al., 2005). Its aim is to map, in the H I line, 7000 square degrees of the high galactic latitude sky between and in declination. ALFALFA offers significantly higher angular () and spectral ( km s-1) resolution, as well as higher sensitivity ( mJy/beam at 10 km s-1 resolution) than any previous survey of its kind. It is also deeper, with a radial extent ( km s-1) and a median depth ( km s-1) that should be sufficient to sample satisfactorily the largest structures seen in numerical simulations in a CDM world model ( Mpc). While HIPASS detected 1 galaxy every square degrees, ALFALFA is detecting galaxies deg-2. The current detection rate suggests that ALFALFA will have detected over 30,000 extragalactic H I line sources when completed. An account of the ALFALFA survey goals and technical characteristics, as well as its main contributions to science, can be found on the website http://egg.astro.cornell.edu/alfalfa/ and references therein.
This is the first of two papers in which we deal with a compilation of the new ALFALFA data, partially released already in several installments (Giovanelli et al., 2007; Saintonge et al., 2008; Kent et al., 2008; Stierwalt et al., 2009; Martin et al., 2009). The data are from two separate sky strips of the northern Galactic hemisphere covering a total area of 9 hr in right ascension and 16 deg in declination. This portion of the survey is especially interesting because it overlaps almost entirely with the SDSS footprint, thus offering the possibility of cross-correlating observations of the cold-gas component with multi-wavelength optical measurements. This synergy between the surveys will be exploited in this paper and the accompanying one (Toribio et al., 2010, hereafter Paper II) in order to carry out a systematic analysis of the fundamental properties of nearby gaseous galaxies and their interrelations. In this way we hope both to gain a more complete understanding of the structure of the baryonic component in these systems and to set up unbiased benchmarks for the normalcy of their H I content that rely on integral attributes that are easily accessible to observation. While this is not the first attempt to conduct this sort of research (e.g. Haynes & Giovanelli, 1984; Roberts & Haynes, 1994; Gavazzi et al., 1996; Solanes et al., 1996; Garcia-Appadoo et al., 2009), both the significant increase in the sample size and the high degrees of homogeneity and completeness of the data will allow us to extend the results of previous studies by addressing issues that fell outside their scope.
In this paper, we describe the main statistical properties of the two large catalogs used in our research. We also: describe the steps followed to cross-correlate the radio and optical sources and to calculate their radial velocities (Section 2); explore different characterizations of the environment of ALFALFA detections that may be useful for defining suitable reference samples for the H I content of galaxies (Section 3); and carry out a comparative study of the distribution of the optical structure, colors, and morphologies of the objects included in the selected datasets (Section 4). In Paper II, we will apply strategies of multivariate data analysis to a complete subset of the H I emitters in low density environments defined here. Our aim in that paper will be both to explore inter-variable correlations and to determine the linear combinations of intrinsic properties that best represent these systems. The relationships we derive will define the standards of normalcy for the neutral gas mass content of field galaxies, and thus provide a fundamental reference for future research into the evolutionary effects of the galactic environment.
Unless otherwise stated, to calculate intrinsic quantities we adopt a reduced Hubble constant km s-1 Mpc.
2 MAIN 21-CM AND OPTICAL CATALOGS
We describe here the primary databases from which we assembled the galaxy samples used in the present study and examine their statistical properties. This section also outlines the steps followed to add information on the radial distance of the selected galaxies to the measurements already available.
2.1 Statistical Properties of Catalogs and Cross-identification of Sources
The main catalog used in this paper contains ALFALFA H I measurements from two regions of the high Galactic latitude sky: , and . This gives a total coverage of 2160 deg2.
The ALFALFA H I detection threshold and completeness limit depend on the source signal-to-noise ratio, , given by the expression cf. Martin et al. 2009:
| (1) |
where is the 21-cm line flux integral in Jy km s-1, which in combination with the cosmological distance to the source, , in Mpc (see Section 2.2), provides its total neutral gas mass in units
| (2) |
is the observed velocity width of the source line profile at the level of the two peaks corrected for instrumental broadening in km s-1, is a smoothing width (either for km s-1 or for km s-1), and is the rms noise figure measured in mJy at a resolution of 10 km s-1. ALFALFA detections are coded according to a scheme dependent on and availability of a prior, e.g., an optical source that matches in angular coordinates or redshift. Code 1 sources are detections with a and thought to be reliable with high confidence level; code 2 sources typically have , but the marginal H I detection is corroborated by a match in position and redshift of an optical source. By searching through the ALFALFA data for code 1 and code 2 sources, we came up with extragalactic objects selected purely on their H I content in the sky region defined above and over the full survey bandwidth.
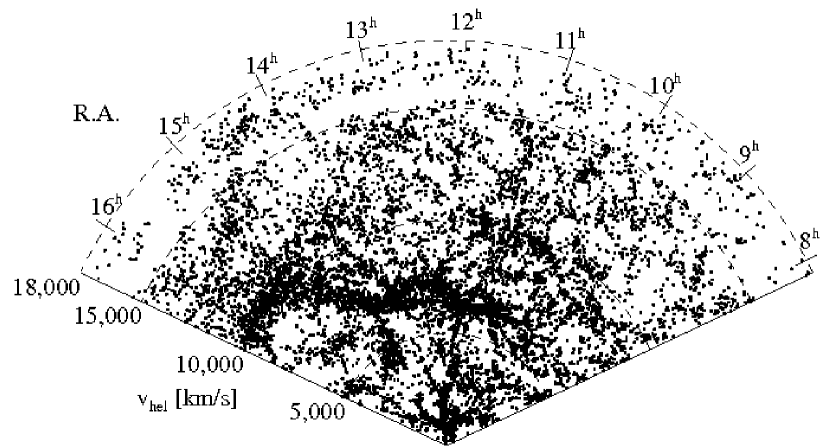
The portion of the ALFALFA survey we use overlaps with other major galaxy surveys such as 2MASS and SDSS. The latter —which has scanned about one quarter of the northern Galactic cap sky in the bands , , , , and , reaching objects up to a total magnitude of 22.2 in band (Stoughton et al., 2002)— is especially interesting for our purposes, as it provides a uniform, very extensive list of photometric and spectroscopic measurements suitable for carrying out an exhaustive study of the correlations between the gaseous and stellar properties of galaxies. Here we make use of SDSS data coming from the full survey (SDSS DR7; Abazajian et al., 2009), which also provides radial velocity measurements for a considerable number of its main targets. The spectroscopic observations, which are complete to a Petrosian -band magnitude of 17.77 after correcting for Galactic extinction (but not for internal reddening), offer a redshift coverage that is deep enough to allow the identification of the most probable optical counterpart to all ALFALFA detections found out to Mpc within the sky region where the two surveys overlap111See http://egg.astro.cornell.edu/alfalfa/images/alfalfa_sdss_coverage.jpg for an image of the footprint of ALFALFA on the SDSS, whose geometry we defined using mangle polygons (Hamilton & Tegmark, 2004).. A graphical representation of the positions of the ALFALFA sources in the overlapping region is provided in Figure 1 by means of a wedge diagram in right ascension. The total number of H I detections coded 1 and 2 in the SDSS overlap region is after discarding objects that lie closer than 1.5 deg to M87, where H I sources cannot be reliably detected because of the strong radio continuum emission.
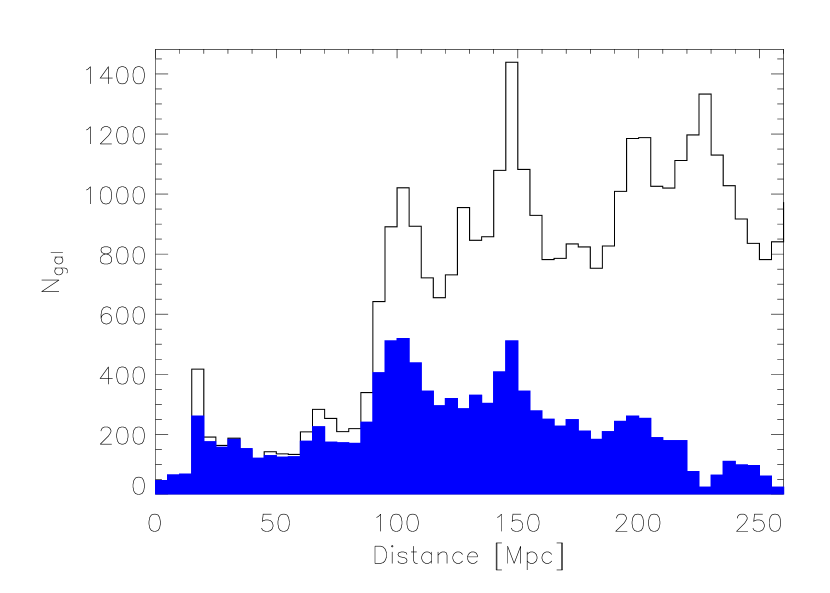
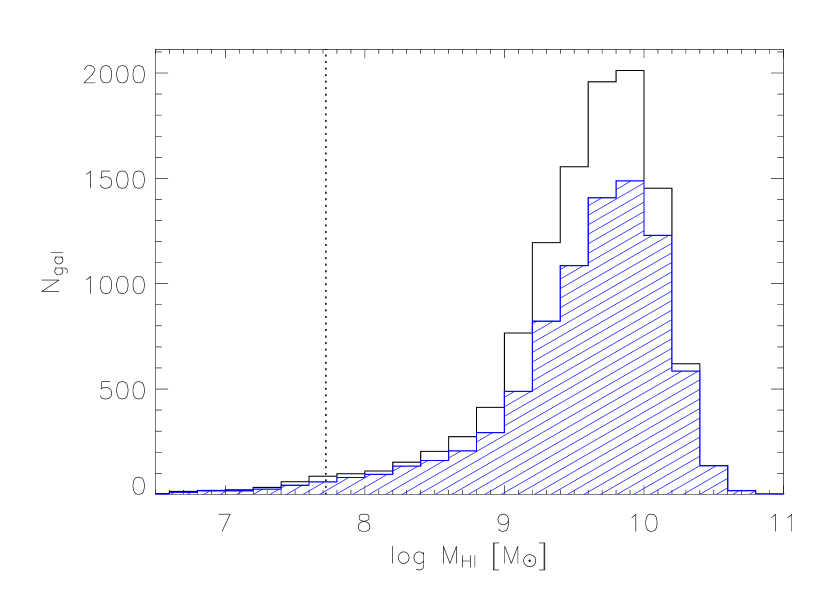
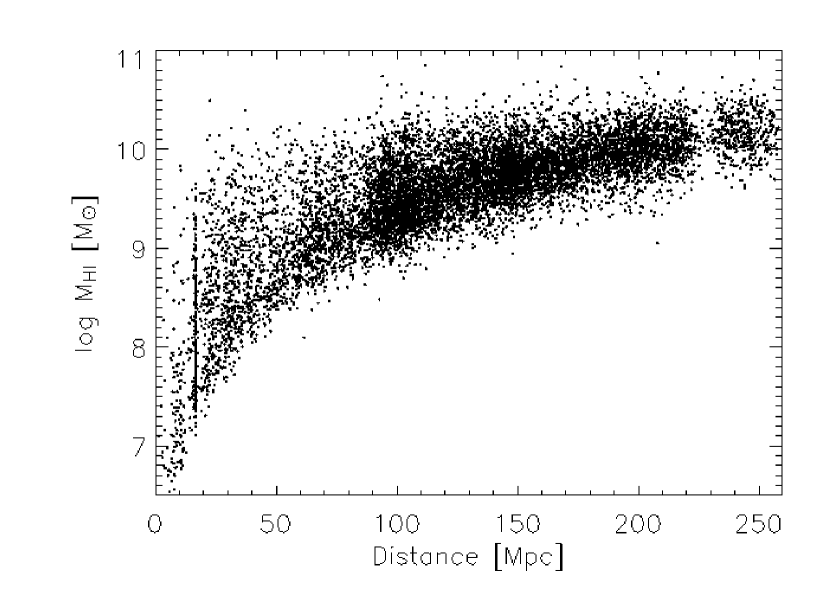
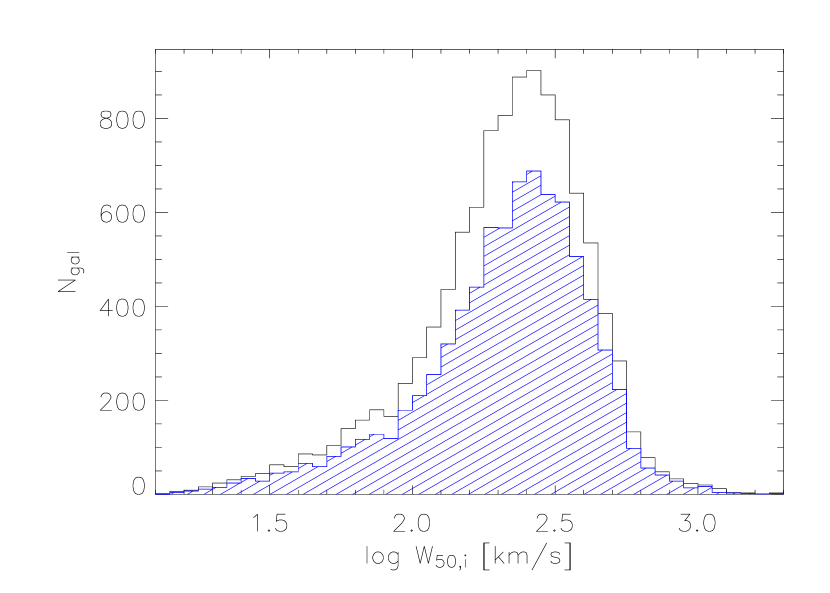
Some of the main statistical properties of this latter data set are displayed in Figure 2. In the top left panel, we show the distance distribution of the ALFALFA sources. The most important large-scale features are reflected in the various peaks between and Mpc (see also Figure 1). The shape of this histogram follows that produced by the distance distribution of SDSS galaxies (black solid line) closely, except for the narrow artificial dip seen near Mpc and the broader one between and Mpc. Both of these are related to the important loss in sensitivity of the ALFALFA survey due to radio frequency interference (RFI) coming from the San Juan airport’s radar (Giovanelli et al., 2007). The H I mass distributions for the full data set and from code 1 detections only (hatched histogram) are shown in the top right panel of Figure 2. The vertical dotted line illustrates the minimum detectable H I mass arising from the lower heliocentric velocity cutoff of 2000 km s-1 adopted in Section 3.1 so as not to include the most uncertain values of this quantity. (Note that this also leaves many nearby dwarfs that are rich in neutral gas out of the present study.) Below, the bottom left panel features the Spänhauer diagram, detailing the H I mass vs. CMB distance. The broad gap in detections associated with the region most affected by the intrusion of RFI is clearly visible near the right-hand end. Finally, the bottom right panel of Figure 2 shows the intrinsic velocity width distribution. As in the top right panel, we also depict the distribution arising only from code 1 objects to demonstrate that the inclusion of code 2 detections does not bias the results.
Unlike other H I surveys, the improved angular resolution of ALFALFA —which leads to positional accuracies typically better than 20 arcsec (Giovanelli et al., 2007)— usually makes the identification of the optical counterpart of a given H I source an unambiguous task. Furthermore, the fact that, for each H I detection, the ALFALFA catalog provides the centroid of the optical galaxy that appears to be the most plausible counterpart according to proximity in -space, color, and morphology (Giovanelli et al., 2007), enabled us to perform a semi-automated catalog cross-correlation. Specifically, we assumed that the optical counterpart of a H I detection provided by the ALFALFA catalog and a spectroscopic SDSS detection are the same object if their projected separation on the plane of the sky is not larger than the size of the optical source and the difference in the reported velocities is less than 300 km s-1. We allow for such a relatively large discrepancy between the observed heliocentric velocities in order to account for the fact that SDSS spectroscopic measurements on an extended object do not always reflect the radial velocity of the object’s centroid, so a positive match between two galaxies relies essentially on the similarity of their sky coordinates. In practice, however, the dispersion in the difference between radial velocities of matched pairs is only of km s-1 (see Figure 3). For the cases in which ALFALFA sources were lacking a spectroscopic counterpart, the photometric criterion was applied. Human intervention was reduced to only cases of doubtful identification.
Table 1 lists the numbers (and fractions) of ALFALFA objects with a photometric or a spectroscopic counterpart in the SDSS for different bins of radial heliocentric velocity. Only of the H I sources are not associated with galaxies listed in the SDSS photometric catalog, while there is a somewhat larger percentage, , of H I detections without a spectroscopic counterpart. Note also how the slight incompleteness of the SDSS DR7 data set that affects mainly the galaxies with the largest apparent brightness (e.g., Strauss et al., 2002) leaves its imprint in the form of reduced fractions for the first two velocity bins of the third and fourth columns of the table. Also included in Table 1 are the numbers (and fractions) of ALFALFA objects detected within the ’SDSS spectroscopic galaxy sample’, SDSS-spec sample for short. From now on, we will use this shorter designation to refer to the subset of SDSS sources with both photometric and spectral morphology classified as of galaxy type, and with mag. About one in every five galaxies in this subset is also an ALFALFA detection, although the fraction rises to one in two for km s-1. The small value quoted in the higher velocity entry of the last column of Table 1 also reflects the impact of the substantial incompleteness of the ALFALFA data due to RFI above km s-1. The effects on the completeness of a few other narrower RFI features present in the spectral bandpass are comparatively modest.
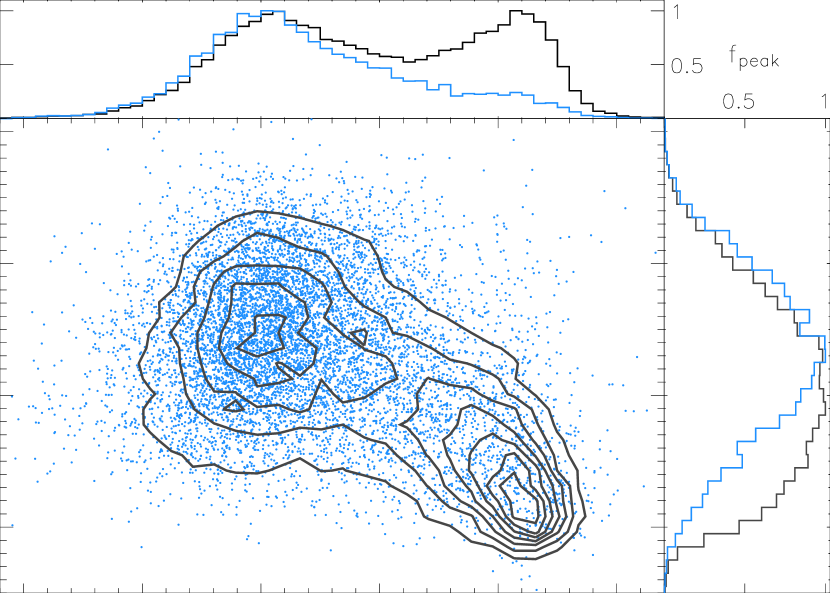
Figure 4 shows how the galaxies in both catalogs are distributed in a global color-light concentration parameter space. The plot shows color versus inverse light concentration index, defined as the ratio of the radii containing and of the Petrosian galaxy light, , which we calculate in the -band. The density contours delineate the behavior of the galaxies within the SDSS-spec sample, while the data points correspond to those objects that are also ALFALFA members. It is clear from this figure that SDSS galaxies show a clear bimodality and separate into two main classes with comparable numbers of objects that can be addressed as the blue- and red-sequence galaxies (e.g. Blanton et al., 2003). In contrast, H I detections mostly populate the locus corresponding to the bluer, late-type, star-forming systems. This trend has been known about for a very long time (e.g., Roberts & Haynes, 1994) and it is in very good agreement with the similar offset found by West et al. (2009) using 195 H I-selected galaxies from the Parkes Equatorial Survey (Garcia-Appadoo et al., 2009). We will show in Section 4.1 that, while the bimodality of the optically-selected sources is reinforced when looking at the global trend with increasing radial velocity, and hence with increasing typical luminosity of the galaxies, the H I detections are distributed in a similar way independently of their distance from the observer.
2.2 Velocity and Radial Distance of Sources Referred to the CMB Frame
To calculate radial velocities and distances referred to the Cosmic Microwave Background (CMB) standard of rest for the galaxies in both the ALFALFA and SDSS spectroscopic data sets, we first correct the heliocentric velocities listed in these two catalogs for peculiar motions. This is done by adopting the multiattractor model of the local peculiar velocity field determined by Masters (2005) from the best fit to data from the new -band Tully-Fisher catalog SFI++ (Springob et al., 2007). This model includes the spherical infall into Virgo and the Hydra-Centaurus supercluster, a quadrupole correction to account for the smaller than average expansion out of the supergalactic plane, as well as a residual dipole pointing towards the Hydra-Centaurus/Shapley superclusters. The predicted peculiar motion corrections, typically of the order of 200 km s-1, are non-negligible for objects within 6000 km s-1. Beyond that radial velocity we assume the Hubble law is exact. The peculiar velocities are tapered to zero between 5000 and 6000 km s-1 in order to provide a smooth transition between these two regimes. For transformations between heliocentric and CMB frames of reference, we apply the corrections quoted in Kogut et al. (1993). For conversion to a CMB luminosity distance, we assume Euclidean properties of space, an approximation that is maintained for the calculation of any intrinsic galactic property involved in the present study.
To minimize the impact of redshift-space distortions in the assignment of distances (and, consequently, in local density estimates; see Section 3.1) to galaxies lying in the vicinity of the groups and clusters present in the cosmic volume targeted by ALFALFA, we adopt a strategy that can easily be applied in a systematic way to any virialized aggregation of galaxies independently of its scale. It consists of estimating the virial radius of the system, , and its velocity dispersion along the line-of-sight, , and then using this information to assign the corresponding system distance to all galaxies with projected distances to the center of one of these overdense environments of less than and systemic velocities with respect to the system mean velocity less than . To calculate in Mpc, we use the following approximation to the halo density-radius relation based on a singular isothermal sphere with mean interior density 200 times the current value of the critical density of the universe (cf. Carlberg, Yee, & Ellingson 1997):
| (3) |
Values for , in km s-1, mostly come from the compilation of Abell cluster properties by Struble & Rood (1991), while for the few galaxy aggregations whose velocity dispersion is not quoted in that catalog, we use the membership assignments carried out by Springob et al. (2007) in the standard estimator (e.g., Tago et al., 2008)
| (4) |
where the sum is intended over the members of the aggregation with measured velocity , and is the mean system redshift.
3 H I CONTROL SAMPLES
Because the cold gas component of galaxies is both a good indicator of their potential for star formation and an excellent probe of the physical conditions of the intergalactic medium, the quantification of the H I content in galaxies is a useful diagnostic tool for studying the evolutionary effects of their surroundings.
The definition of a benchmark suitable for absolute measures of H I content necessitates a control sample as bias-free as possible formed by galaxies expected to show little or no evidence of environmental interactions. In this section, we study different characterizations of the local environment of ALFALFA detections, define three possible control samples (see Table 2), and explore their relative degree of adequacy.
3.1 Local Number Density Measurements for ALFALFA and SDSS Galaxies
The environment of a galaxy can be defined in terms of the density of galaxies located in its immediate vicinity. To calculate the underlying three-dimensional galaxy number density at a given position, we use the galaxies in the SDSS-spec data set as the nodes of a th-nearest neighbor network. This calculation is carried out for both ALFALFA and SDSS sources, excluding galaxies lying in those regions in which the results are affected by large errors or where detections are very scarce and/or unreliable. In particular, we impose a lower heliocentric velocity limit of 2000 km s-1 to avoid those galaxies likely having the largest relative uncertainty in distance arising from peculiar motions not duly accounted for —a constraint that also removes the closest cosmic volume where the SDSS pipeline photometry of large, extended galaxies is most inaccurate—, and a velocity cutoff ranging from 15,000 km s-1 up to 16,000 km s-1 that embraces the deep trough in sensitivity of the ALFALFA’s spectral window due to RFI (see Figures 1 and 2).
We follow Casertano & Hut (1985) and compute a local, continuous measure of environment from the unbiased estimator
| (5) |
where is the three-dimensional (comoving) distance to the 6th-nearest neighbor in the SDSS-spec sample in Mpc. In an effort to correct for redshift-space distortions222We do not correct for survey edge effects given the large size of the catalogs. and improve the accuracy of our density measures in overdense environments, is calculated, for those galaxies assigned to a cluster (Section 2.2), using instead projected separations scaled by a factor of to convert them into a three-dimensional measure of distance (Cooper et al., 2005).
Local densities calculated this way are then corrected for the magnitude cutoff of the SDSS catalog by multiplying them by the inverse of the selection function
| (6) |
which we calculate by integrating the differential luminosity function, , of the SDSS provided by Blanton et al. (2001). In equation (6), and are, respectively, the faintest magnitudes detectable because of the optical flux limitation at the galaxy redshift and at a fiducial redshift, , which we match up with that corresponding to the low velocity cutoff of 2000 km s-1 imposed to the samples, while is the extinction correction as a function of right ascension () and declination (), for which we use the Schlegel, Finkbeiner, & Davis (1998) values loaded in the SDSS database.
It is worth noting, however, that this measure of the local density cannot be expanded to the full ALFALFA survey, which is also carrying observations within the solid angle and , not scanned by the SDSS. In this case, the 2MASS (Skrutskie et al., 2006), with its full sky coverage ( for the extended source catalog), offers the most sensible alternative to characterizing the environment in which ALFALFA detections reside. Thus, in anticipation of future research, we also assigned a surface density parameter to each optical and gaseous spectroscopic source from the formula
| (7) |
with the projected distance to the 6th-nearest neighbor, in degrees, derived taking into account the underlying 2MASS galaxy distribution on the sky in the band down to 13.0 mag, where the 2MASS extended source catalog has been estimated to be at least complete for most of the sky (Jarrett et al., 2000). We do not correct this surface density estimator for Galactic absorption, because at this extreme near-infrared wavelength the opacity is insignificant for . It should not be forgotten, however, that this immunity to the effects of the Milky Way’s dust arising from 2MASS being a survey in the near-infrared, biases its sensitivity regarding the morphology of the detected galaxies toward early-type spirals and ellipticals.
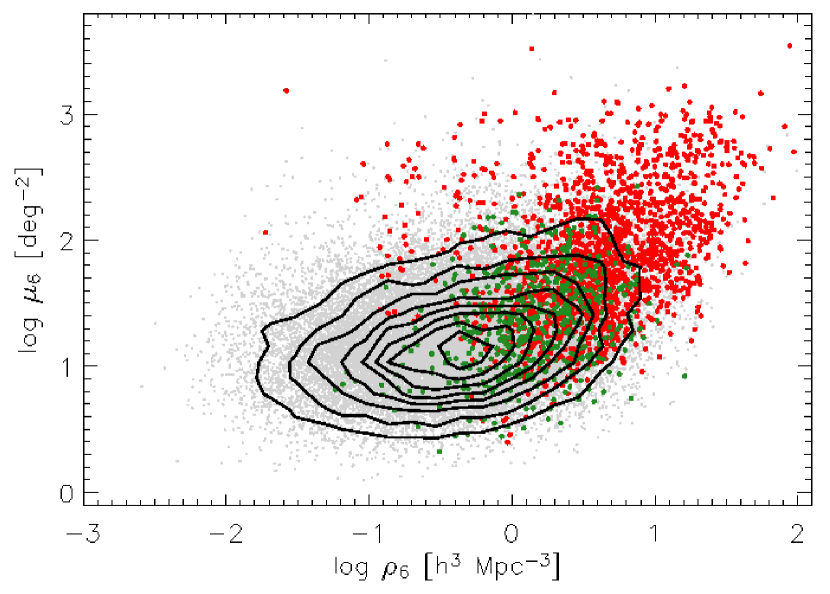
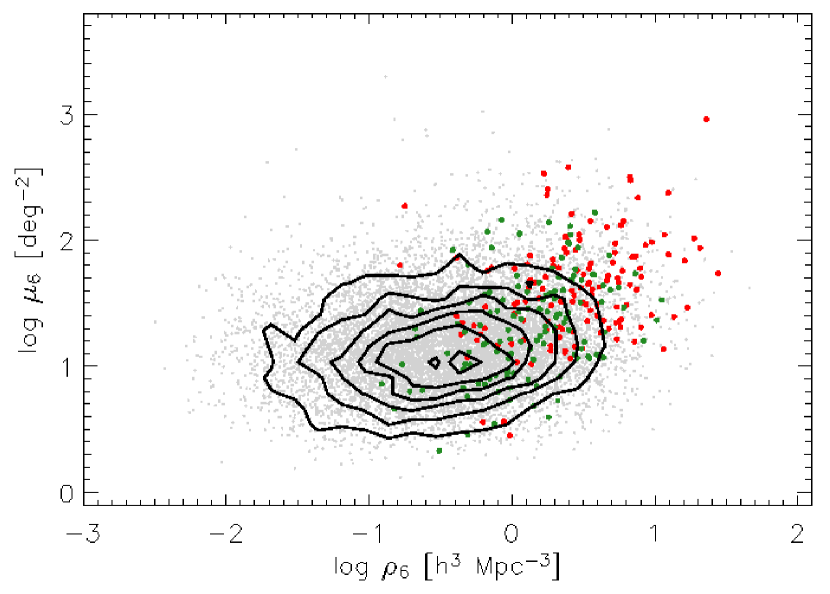
In Figure 5, we compare the values of (uncorrected for redshift-space distortions) and for galaxies in the SDSS-spec (top) and ALFALFA (bottom) data sets. The plots show that these two local density tracers follow a weak, non-linear relationship, with the three-dimensional measure of environment spanning a somewhat larger dynamic range. Note the relatively few observations associated with clusters in the bottom plot caused by the undersampling of the highest density environments by ALFALFA (see also next section).
3.2 The Low Density Environment H I Galaxy Sample
One possibility to define a sample of galaxies whose evolution is hypothetically less influenced by external, disruptive processes is to select those objects least affected by the clustering phenomenon. According to observational findings the influence of the cluster environment on the properties of galaxies can extend up to about twice the cluster virial radius (e.g., Balogh et al., 1998; Solanes et al., 2001). Therefore, any density threshold adopted to extract a control sample of unperturbed galaxies from a given catalog should be low enough to leave out of it, not only bona fide cluster and group members, but also those objects located in adjacent regions.
We studied the relationship between the neutral gas content of ALFALFA galaxies and their local three-dimensional number density measured in the previous section to see if we can identify the density threshold above which environmental interactions start to become important. Following the works by Haynes & Giovanelli (1984) and Solanes et al. (1996), the former property has been quantified by means of a H I-deficiency parameter, , that compares (the decimal logarithm of) the observed H I mass, , in solar units, with the value expected from a galaxy free of external influences of the same observed morphological type, , and optical linear diameter, , expressed in kpc. Specifically:
| (8) |
so positive values of indicate H I deficiency. This test has been restricted to those ALFALFA detections with Hubble types and (apparent) blue visual sizes available on the Arecibo General Catalog (AGC), a private galaxy database maintained by MPH and RG. In order to increase sample size and reduce statistical errors, we inferred expectation values for the H I mass for 2615 disk galaxies with Sa–Sd morphologies using the maximum likelihood linear regressions of on given in Solanes et al. (1996). Since in that work the standards of normalcy for the H I content were defined specifically for galaxies of type Sa–Sc, we thus assigned Scd–Sd types to be the same as Sc.
We present in Figure 6 a plot of the median in bins of local number density. We show results inferred using sources with radial velocities between 2000 and 18,000 km s-1, as well as separately for three sub-intervals of this velocity range. Looking at the different panels one can see moderate oscillations in the central values of . Nonetheless, these are always well within the quoted uncertainties and therefore not statistically significant, hinting at best a mild increase of gas deficiency with density. The weak dependence of the gas content of ALFALFA sources with the local density is the consequence of limiting the effective integration time of the survey to about 48 seconds per beam area. While ALFALFA has been designed to detect from massive spirals at to dwarfs with H I masses as low as at the Virgo distance (e.g., di Serego Alighieri et al., 2007), the highly gas-deficient galaxies that are expected to reside in the densest regions of the surveyed volume should escape detection unless they are located nearby (see also Figure 5). It is also important to stress that the observed behavior of the gas content with local density is not affected by the negative offset shown by the inferred median values. Such a bias obeys to several factors. On one hand, as mentioned above, we are underestimating the expected gaseous content of Scd–Sd galaxy types, which lowers the median of our dataset about units. Moreover, it is the fact that ALFALFA is detecting total 21-cm fluxes for individual galaxies that, on average, are around larger than their AGC counterparts. This reduces the average value of by additional units. The rest of the drop in the H I deficiency can be attributed to differences in the object selection with respect to Solanes et al. (1996). Note that the ALFALFA survey extends further in redshift than the sample used in this former work, which was centered on the Pisces-Perseus Supercluster. This allows us to deal with a significantly large number of high-H I-mass objects. Besides, due to a less robust selection of the control sample, we cannot discard the presence in the Solanes et al.’s data of a non-negligible fraction of galaxies with a disturbed H I mass, which might have contributed to further reduce the standard values of this quantity calculated in that paper.
The lack of a clear H I content-density correlation for the portion of the ALFALFA spring-sky survey under study notwithstanding, we prefer to be conservative and, as indicated at the beginning of the section, define a control sample that does not include galaxies located in the vicinity of an overdensity. After testing different density thresholds, we find that the condition galaxies Mpc-3 discards all SDSS galaxies with spectroscopic information cataloged as cluster members in the surveyed region —the corresponding threshold based on the 2MASS galaxy distribution would be galaxies deg-2—, as well as more than 91 (96) per cent of these objects with system-centric distances between 1.5– (1.5–) and systemic velocities within of the cluster mean, which may be considered representative of the system outskirts population. This threshold performs similarly well applied to ALFALFA detections. The Low Density Environment (hereafter LDE) H I galaxy sample that results from selecting those ALFALFA detections obeying the above density constraint has a total of 5647 objects. Wedge diagrams in right ascension of the spatial distribution of this data set, as well as the H I detections discarded for lying in higher density environments, are shown in Figure 7.
3.3 Isolated Galaxy Samples
By selecting galaxies in low density regimes one may confidently exclude objects associated with clusters and large groups, but cannot guarantee that such galaxies have not interacted at some point with nearby companions. That is the reason why we also studied the possibility of defining control samples from the ALFALFA catalog that maximize the chances of dealing with galaxies whose evolution has not been influenced by other objects in the recent past. Here we build two samples of isolated galaxies by applying two different kinds of isolation criteria.
As a first approach, we devised a selection technique for the SDSS spectroscopic data set, similar to the one used by Prada et al. (2003), that combines spectroscopic with photometric information to detect galaxies without dynamically relevant companions inside a given volume in -space. Thus, we classify a galaxy with apparent -band total magnitude at coordinates as a good candidate for a sample of isolated galaxies if it has no neighbor with mag within the cylindrical volume, centered on its position, of radius and semi-axis
| (9) |
respectively, where Mpc is the linking-length at the adopted fiducial redshift of 2000 km s-1, , and is the selection function defined in equation (6) that keeps constant the probability of finding a galaxy in a given volume regardless of distance. In equation (9), the term km s-1 is added in order to account for the distortion on the intergalactic distances along the line-of-sight induced by the one-dimensional pairwise velocity dispersion of field galaxies (Guzzo et al., 1997; Landy, 2002). The preference of a Mpc linking-length has been dictated from the fact that it would take almost 3 Gyr for a galaxy with a peculiar velocity of km s-1 to cover such a distance, while the magnitude constraint is set to take into account neighbors that have at least one-tenth of the target mass (assuming light is a proxy for mass). This technique identifies 461 SDSS-spec galaxies that are also H I detections as members of this first isolated galaxy (hereafter IG1) sample.
A second isolated galaxy (IG2) sample has been defined by applying the sort of prescription typically used for photometric samples —usually much deeper than the spectroscopic ones—, which takes into account in a semi-empirical way the distance to companions. Perhaps the best known example is the nearest neighbor algorithm by Karachentseva (1973) based on the comparison of apparent angular diameters between candidate isolated galaxies and their neighbors. Recently, Allam et al. (2005) have implemented a variation of Karachentseva’s technique to detect isolated galaxies in the SDSS DR1 that we adopt here with a slight modification. Thus, we consider a target galaxy with a -band total magnitude and -band Petrosian radius to be isolated if the projected sky separation with respect to any neighboring galaxy satisfies the conditions
| (10) |
where the 2.5 magnitude difference corresponds to about a factor 9 in brightness for a galaxy with a flat surface brightness profile. We also took into account the fact outlined by Allam et al. (2005) that the application of these selection criteria to SDSS data effectively reduces the magnitude range of the candidate isolated galaxies at both ends (see, for instance, their Figures 11 and 12). Thus, by considering only candidates with Galactic-extinction-corrected -band magnitudes in the range , we extracted a total of 236 isolated H I emitters333Had we followed the same approach, but imposing instead the more restrictive conditions mag with mag used in Allam et al.’s paper, the number of retrieved isolated H I galaxies would had drop to 67 within the region surveyed by ALFALFA..
Given that the spectro-photometric algorithm imposes the restriction on the magnitude of IG1 members, there is only a small overlap in the range of apparent brightnesses of the galaxies that are included in both subsets of isolated objects. In practice, this means that only 7 ALFALFA detections end up obeying simultaneously the two isolation criteria. If we eliminate from the photometric prescription the constraint mag to make the overlap of both subsets of isolated galaxies easier, then the number of IG2 members rises to 470. Even so, this enlarged sample includes only 83 of the 461 isolated galaxies selected by the spectro-photometric algorithm. Therefore, isolated galaxies in -space are not necessarily considered so when their environment is examined in projection and vice versa.
As done in the previous section for the LDE H I galaxy sample, we also studied the environment of the ALFALFA galaxies in the IG1 and IG2 subsets. As an example, we display in Figure 8 a graphical representation of the H I-deficiency versus local density for IG1 galaxies. As before, we focus only on sources having optical diameters and spiral types from Sa to Sd listed on the AGC. As shown in this figure, while isolated galaxies obtained through automated systematic searches avoid the densest regions of the universe, a non-negligible fraction of them inhabit regions of moderate local galaxy density having values of larger than the upper density threshold adopted to define our LDE H I galaxy sample. This demonstrates that the definitions of isolation and low density environment are not necessarily equivalent; local number density measurements associated with isolated galaxies can span quite a broad range of values (for a similar conclusion, see Verley et al., 2007). Alongside this fact, Figure 8 also shows that although the different approaches adopted to identify field galaxies assemble samples of significantly different sizes, the corresponding gas content distributions are quite similar. There is therefore no evidence that our searches of isolated galaxies selected objects that are particularly gas-rich compared to those in the LDE galaxy sample.
4 UNDERLYING PROPERTIES OF GALAXIES IN THE H I CONTROL SAMPLES
Here we use several independent classification schemes based on the photometric data for the galaxies in the three candidate control samples defined in the previous section to provide more details and increase our understanding of the objects that inhabit quiet environments. These measures are all sensitive to the morphology and they are objective, easily reproducible, and applicable to data sets in which the morphological classification by direct inspection of the galaxy images is impractical, given the large number of objects involved.
4.1 Structure, Colors, and Morphology of the LDE Galaxies
Since we are focusing our attention on subsets of non-clustered, gas-rich galaxies, predictably of late type, we first apply the criterion used by Maller et al. (2009; hereafter Mal09) to select disk galaxies from the SDSS. As stated by those authors, almost pure disk samples can be obtained by selecting galaxies that obey at least one of these requirements: Sérsic index or observed axial ratio , where the parameter —which in our case has been extracted from the NYU Value-Added Galaxy Catalog (Blanton et al., 2005)— measures the shape of the observed -band luminosity profile of a galaxy fitted using the Sérsic formula with elliptical isophotes. We note that these constraints include S0 galaxies in the ’disk’ class, because the presence of a disk makes their measured axial ratio more important in determining their apparent inclination than the intrinsic ellipticity of the spheroidal component. According to Mal09, the completeness of their classification scheme reaches for disk galaxies, with a reliability of when applied to SDSS data. The completeness is the fraction of galaxies of a given type that are successfully selected from the original sample by the classification scheme. The reliability is the fraction of galaxies of the desired type in the selected subset.
In good agreement with expectations, Table 3 shows that the fraction of members of the SDSS-spec sample in low density environments ( galaxies Mpc-3) that obey Mal09’s criterion is very high ( on average), and even higher for the subset of ALFALFA detections (). Our global percentages of late-type objects are, however, slightly lower than those obtained by Mal09. This result can be attributed to the fact that they were inferred for a very shallow data set with mag (note that the agreement between our results and Mal09’s becomes almost perfect if we restrict the comparison to our lowest velocity bin). In principle, the decrement in the fraction of galaxies assigned to the disk class with increasing radial velocity illustrated in Table 3 can be interpreted as an indication of the fact that most luminous galaxies tend to be of early type, in qualitative accordance with previous work (e.g., Strateva et al., 2001; Blanton et al., 2003; Baldry et al., 2004). Yet we find that in the highest velocity bin of the ALFALFA galaxies are not classified as disks, while at these relatively large distances H I detections should arise almost exclusively from late-type objects: at km s-1 the minimum H I mass detectable in the survey is . Accordingly, our results seemingly highlight the difficulties in morphology assignment that selection rules like Mal09’s, based on global measures of galaxy structure, encounter for faint objects due to the inherent noisiness of the images.
The inverse light concentration index, , is another measure of galaxy structure that can be used as a morphological divider (Shimasaku et al., 2001; Strateva et al., 2001). As with the Sérsic index, this parameter is expected to be correlated with galactic morphology. Indeed, the two indexes can be interchanged for an ideal galaxy with a Sérsic profile in the absence of seeing. Early-type galaxies have a dominant bulge component, so their light is concentrated, while late-type galaxies, which harbour bulges of varying size, have their light more dispersed due to the presence of an extended exponential disk component and hence larger values. In practice, however, the concentration index is a morphological separator that is useful for broadly dividing galaxies into two populations: early-type (E, S0, Sa) and late-type (Sb, Sc, Irr) objects. We follow Strateva et al. (2001) and adopt an separator in the -band, which provides a cut giving equally complete subsamples of both morphological populations, while at the same time it reduces the contamination of the late-type galaxy class by early-type objects to . When applied to galaxies in LDEs, we find that most galaxies have , indicating the dominance of disks. As was to be expected, this tendency is again more marked for ALFALFA detections, about of them fall into the light-concentration-index late-type class, than for the optical subset, which has a late-type galaxy fraction of .
Given the correlation between color and morphology, early-type galaxies being generally redder than late-types, galaxy colors can also be used as a morphological classification tool, as well as to provide a coarse separation of galaxies in terms of their star formation activity. We adopt the classification scheme of Baldry et al. (2004), which uses the SDSS model magnitudes (Stoughton et al., 2002) to measure color from the difference between the fluxes in the and filters and to calculate the absolute magnitude in the band, , for which we adopt the CMB distance inferred in Section 2.2. As well as being an optimal color for separating galaxies into red and blue classes (Strateva et al., 2001), is a good indicator of star formation activity (Deng & Zou, 2009), while the filter contains the peak of the light curve for most SDSS galaxies. In this analysis, we do not apply -corrections since the samples studied are shallow.
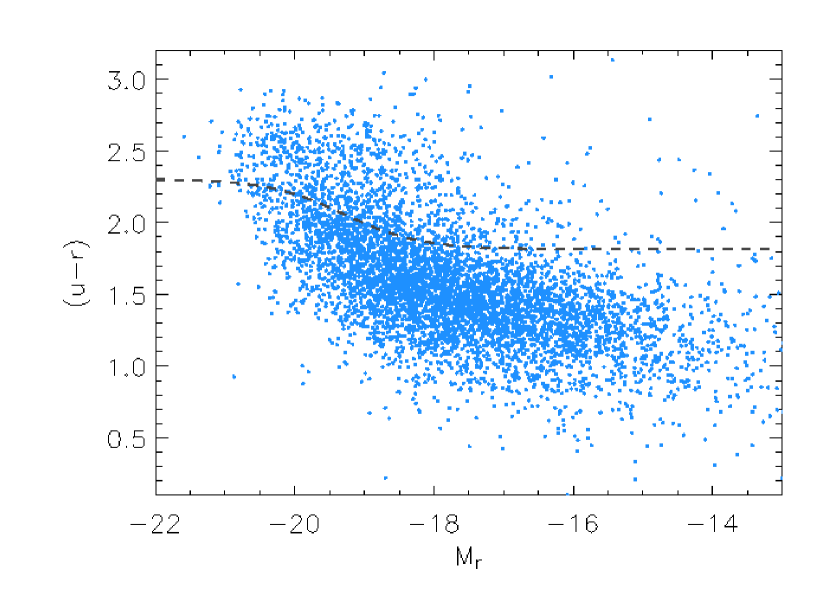
Figure 9 shows the color-magnitude diagram for ALFALFA detections in the LDE sample with the Baldry et al. delimiter,
| (11) |
superposed. Not surprisingly, we see quite a few more sources on the blue, active population side of the divider (below the curve) than on the red, passive side: and of the total, respectively. Moreover, we note that most of the H I galaxies above the separator reside in an area of the color-magnitude diagram around mag and mag where the blue and red galaxy populations identified by Baldry et al. (2004) overlap in this space (see their Figure 9). Therefore, it is not unlikely that many of these galaxies are actually blue interlopers. Indeed, if we repeat the same exercise after correcting the SDSS magnitudes and colors to face-on values, following respectively Shao et al. (2007) and Masters et al. (2010a), and keeping the same separator, the fraction of H I detections assigned to the blue group increases to . This highlights the importance of defining morphological separators corrected for internal extinction, since the effects of dust on the colors and concentration of late-type galaxies can be significant for edge-on systems.
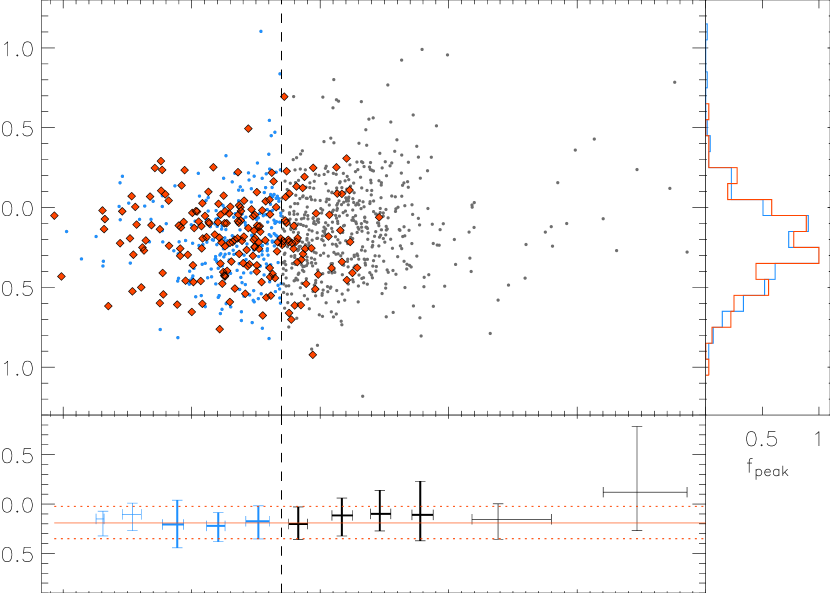
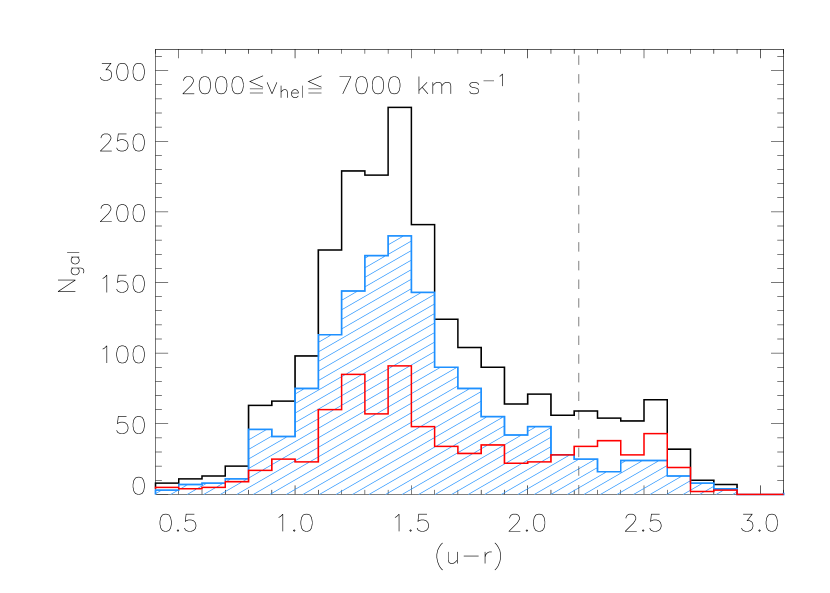
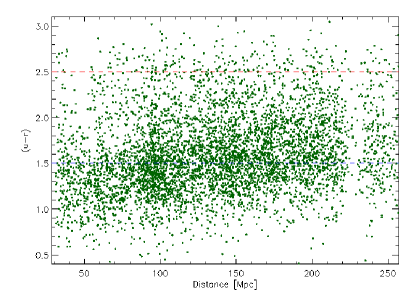
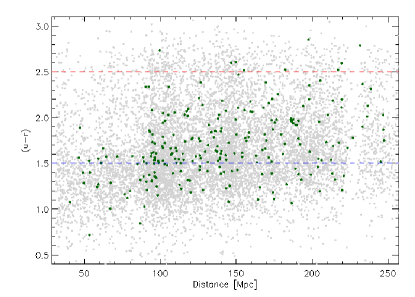
A slightly coarser color division, but one that facilitates the analysis of the data, is provided by the luminosity-independent color cut of 2.22 mag —also uncorrected for internal extinction— suggested by Strateva et al. (2001). In the four panels of Figure 10, we show the observed color distributions of the SDSS-spec galaxies in LDEs separated into H I-detections and non-detections for different bins of radial heliocentric velocity. As illustrated by the histograms, the global fraction of SDSS galaxies in LDEs that are of red-/early-type becomes notably higher with increasing distance, in agreement with the well-known color-luminosity-morphology(-star formation activity) correlation (see also Figure 9), which appears to hold regardless of local galaxy density (e.g., Ball, Loveday, & Brunner, 2008). Yet it is obvious from these plots that the observed behavior arises almost exclusively from the contribution of galaxies undetected in H I. For these systems, the fraction of red objects, according to the Strateva et al. (2001) separator, grows steadily from less than in the lowest velocity bin, to about in the highest one, where of the SDSS galaxies redder than the divider are H I non-detections. In sharp contrast, field H I emitters consist of (mostly blue) objects whose color distribution shifts only very slighty redwards with increasing distance, to the point that the ratio between the blue and red fractions for this subset remains nearly constant at in all redshift bins ( if one uses colors corrected for internal extinction) and, hence, approximately independent of the mean H I mass of the detections. This result contrasts with previous claims, based on optically-selected sources, that blue exponential systems, just as with red concentrated ones, become monotonically redder with increasing luminosity (e.g. Blanton et al., 2003; Ball et al., 2008) and suggests that the color and H I mass of gaseous galaxies cannot be very strongly related (see also Section 4.2). In Paper II we will return to this issue, which also has fundamental implications for the theory of galaxy formation regarding the number of independent physical parameters that determine the properties of individual galaxies (Gavazzi et al., 1996; Disney et al., 2008; Gavazzi, 2009).
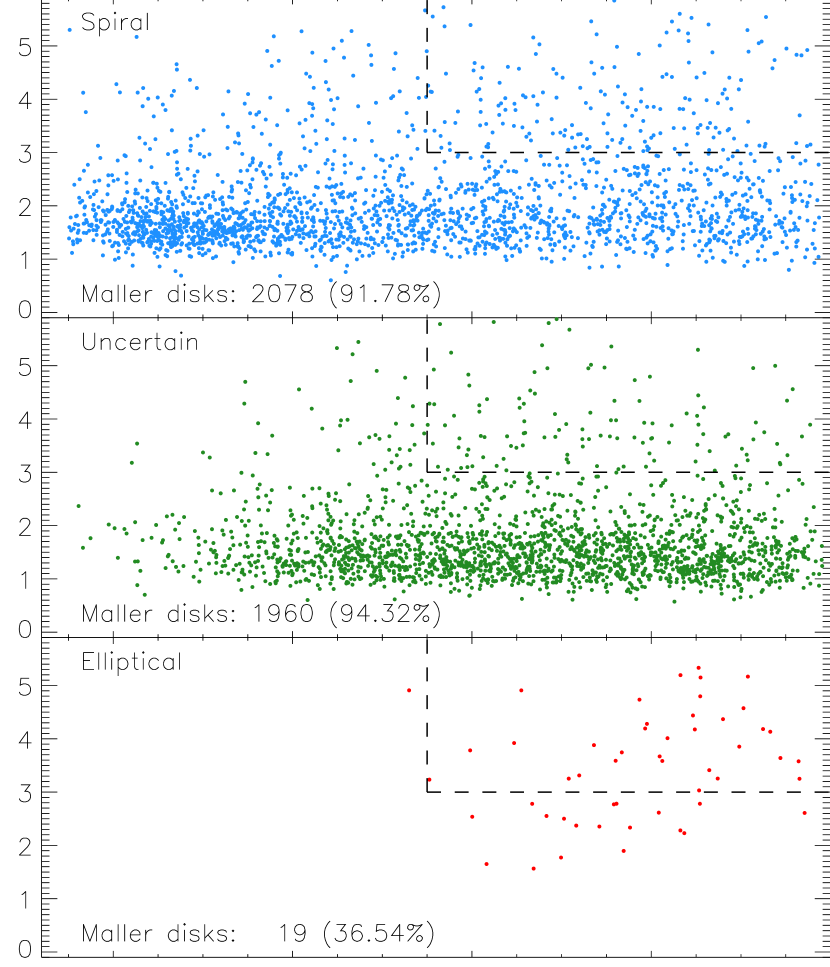
The Galaxy Zoo 1 (GZ1) clean catalog (Lintott et al., 2010), which provides visual morphological classifications for nearly 900,000 SDSS galaxies, offers the possibility of directly inspecting the basic morphology of a highly significant fraction of our H I detections. To this end, we focused our attention on the subset of 4599 GZ1 objects that are members of the SDSS DR7 spectroscopic survey and are also included in our LDE H I galaxy sample. Following Lintott et al., we were rather strict in assigning GZ1 morphologies to our ALFALFA objects by requiring that they have a ’spiral’ or an ’elliptical’ flag in the clean catalog, i.e., with more than confidence in category assignation after debiasing corrections. All other galaxies were classified as of uncertain type —as shown in Figure 11, most of the ALFALFA detections with uncertain GZ1 morphology are objects with but . Comparison with the Hubble types listed in the AGC indicates that the reliability of this classification scheme for the spiral class is higher than , with a contamination from S0/S0a galaxies, in good agreement with estimates by Lintott et al. (2008) and Bamford et al. (2009). In this manner, we infer that of our H I detections can confidently be assigned a spiral (disk with spiral arms) morphology, whereas only are galaxies with a high probability of belonging to the elliptical class (E and S0 galaxies). The fact that all the objects in the latter class have and that most of them have (-band values) implies that prescriptions like that used by Mal09 are very effective at separating out objects of early-type morphology. Indeed, we find that only 19 of the 4057 Mal09 disks identified in this subset of GZ1 members are classified by the Galaxy Zoo as bona fide ellipticals. We note in addition that just 78 of the 4599 members of the LDE-GZ1 H I subset have a weighted-merger-vote fraction larger than (Darg et al., 2010).
We extended this a step further by examining by eye the SDSS images of those LDE gaseous galaxies that show optical early-type characteristics according to both their color and Sérsic index. We concentrated our efforts on objects with extreme inclinations that meet the following criteria: mag, , and or (the latter two parameters measured in the -band). In agreement with Mal09, we found that most of our edge-on, red, concentrated H I sources have a clear disk-like morphology suggesting that they owe their early-type classification to large amounts of dust reddening. This morphology also appears to be the dominant one among the face-on gas-rich galaxies identified with large Sérsic indexes and red colors, in which luminous red central regions and large bars are plentiful. We speculate that these latter objects represent a stage of spiral evolution that is not as advanced as that assigned to the population of red spirals recently studied by Masters et al. (2010b), since ours still have very blue, but faint, outer disks and are quite rich in neutral gas (several of them have ), in good agreement with the findings of the GALEX Arecibo SDSS Survey (Wang et al., 2010). Therefore, we are left with only a handful of cases that may correspond to genuine gas-rich early-type galaxies (ETGs) in which the cold gas could have a recent external origin. While the scarcity of this sort of ’hybrid system’ in our LDE sample is consistent with the very few large ETGs detected in H I in the Virgo cluster region (di Serego Alighieri et al., 2007), it seems to be at odds with the preliminary results of the ATLAS3D survey of 262 nearby galaxies that lack spiral arms in optical images (Serra et al., 2010), which hint at the possibility that isolated ETGs embedded in massive H I disks are relatively abundant.
The results discussed above, plus the fact that the automated classification of galaxies into two major populations using extensive stellar parameters leads to subdivisions that are partially contaminated by members of the other class, and therefore to the standardization of the trends, lead us to conclude that H I emission offers the most reliable (and clear) way to determine whether a galaxy has genuinely an early-type or late-type morphology.
4.2 Structure, Colors, and Morphology of the Members of the IG1 and IG2 Subsets
The exercises reported in the previous section for ALFALFA detections and non-detections in LDEs were repeated for the samples of isolated galaxies.
As illustrated in Figure 12, we find that, regardless of the isolation criterion adopted, the population of H I detections is notably bluer than that of non-detections, in good agreement with our results for galaxies in LDEs. There are, however, significant differences in the color distributions of both samples of isolated galaxies. Thus, while the colors of the IG2 members mimic the behavior shown by the LDE galaxies at the median depth of the ALFALFA survey (bottom-left panel of Figure 10), the IG1 members display nearly unimodal distributions —there is a hint of bimodality in the histogram of H I detections— strongly skewed to the red. Likewise, we find that IG1 galaxies tend to have both smaller light concentration indexes and a lower fraction of Mal09 disks than galaxies in both the IG2 and LDE data sets, as would be expected from a population more dominated by early-type objects. Indeed, if we restrict our attention to just the ALFALFA galaxies with Hubble types listed in the AGC, we find that the latter two samples are considerably richer in Scd and Sd spiral subtypes than the IG1 subset is.
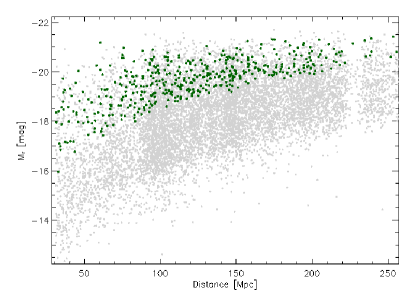
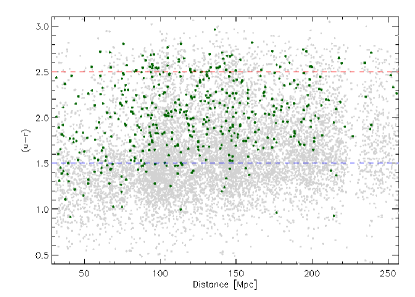
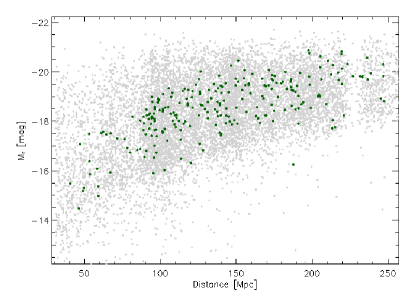
These discrepancies, however, do not stem from fundamental differences between the properties of the objects belonging to the IG1 and IG2 samples, but from the distinct selection criteria adopted to draw up their member galaxies. As illustrated by the top panels of Figure 13, while the luminosity distribution of the LDE galaxies (as well as that of the full ALFALFA catalog) moves clearly towards brighter values with increasing distance, the corresponding color distribution, which can be reasonably approximated by a unimodal function peaking around the characteristic color of the blue sequence and having a long red tail (see also Figure 10), shows a modest variation. This rough distance-invariance is reinforced by the lack of a substantial red-sequence component for the H I emitters, which start contributing significantly to the color distribution of the entire galactic population at somewhat larger redshifts than the blue one. On the other hand, the isolation selection techniques we used place limits on the apparent brightness that the candidate galaxies can have. This inevitably leads to choosing from among the brightest objects that are within the allowed magnitude range and, consequently, also among the reddest. Such a bias is stronger in the case of our spectro-photometric IG1 sample, which excludes objects fainter than mag. As a result, most of the H I sources around the peak of the blue sequence are missing from the color distribution of this subset, which only preserves its red tail (middle right panel of Figure 13). In contrast, the almost disjoint constraint mag adopted for the definition of the IG2 sample from the relatively shallow ALFALFA data set has led us to select galaxies that are just slightly intrinsically brighter and, therefore, slightly redder too, than the average LDE members (bottom panels of Figure 13). Note, however, that the application of the photometric isolation prescription by Allam et al. (2005) to the much deeper SDSS DR1 catalog led these authors to obtain an isolated galaxy sample with a light concentration index distribution that suggested a fifty-fifty morphological composition between early and late galaxy types, closer to what we observe here for the IG1 subset.
5 SUMMARY AND CONCLUSIONS
We have used measurements in the 21-cm emission line from the ALFALFA blind survey in a region of the sky also scanned by the SDSS DR7 in order to study the physical properties of gas-rich galaxies expected to show little or no evidence of interaction with their surroundings. The goal has been twofold: 1) to improve the understanding of the nature of extragalactic H I sources; and 2) to identify an observational sample of gaseous galaxies as unperturbed as possible by the environment and therefore suitable to set up standards for their neutral gas content.
Different parametric estimates of the environment of H I sources have been explored, in order to establish their suitability in providing a catalog of gaseous systems whose properties are minimally affected by external influences. Among the environmental measures tested, the local number density estimate based on the distance to the 6th-nearest spectroscopic SDSS neighbor of a galaxy has emerged as the most appropriate. By applying this estimator to the H I detections identified in the overlapping region of the radio and optical surveys, we have extracted a subset of 5647 H I sources in low density environments. We have also defined two different subsets of isolated galaxies by applying standard isolation criteria based either on the combination of spectroscopic and photometric information or solely on photometric data. In spite of the marked differences in size and membership between the LDE and isolated subsets, their respective H I content distributions have proven to be all pretty similar.
In combination with SDSS data, we have studied the distributions of light concentration indexes, colors, and other proxies of morphology for the members of these three control samples. All the evidence analyzed indicate that H I emission is detected essentially in objects that are structurally similar to galaxies with late-type optical characteristics. Thus, over of H I sources residing in a quite environment obey the disk selection rule by Mal09, while some 82 per cent have inverse light concentration indexes representative of this class. These fractions could be considered actually a lower limit, as the determination of the structural parameters of distant objects is quite imprecise. Likewise, from evidence gathered by studying the color distributions, we have found that at least between and of the ALFALFA detections outside overdense regions are classified as blue, star-forming galaxies. These fractions are even higher when extinction-corrected colors are used. In contrast, the structural properties and colors of H I non-detections are typical of a population substantially richer in early-type, red objects. The assignment of morphologies to a subset of ALFALFA galaxies in LDEs from the GZ1 catalog corroborates these conclusions, as only a very small fraction ( per cent) of the objects studied have been classified into the elliptical class with high reliability. These results suggest that the more reliable automated way to determine whether a galaxy has genuinely an early- or late-type morphology is by measuring its H I emission.
The standard view that red galaxies and, consequently, passive objects of type S0/Sa or earlier, tend to have less neutral hydrogen than bluer, star-forming late-type systems is therefore confirmed. Our research also corroborates the prediction, based on the positive tight correlation between global color and intrinsic luminosity inferred from optically-selected galaxies, that the fraction of red-/early-type galaxies in our SDSS-spec LDE sample should increase with increasing radial velocity of the sources. We observe, however, that while the color distribution of the objects undetected in H I clearly becomes redder, that of the gas-rich population does not change significantly as a function of redshift. This suggests that the color and gaseous mass of field H I emitters are not very strongly interrelated. Likewise, we have shown that the close connection between color and luminosity can have an important impact on isolation criteria, favoring the selection of the redder/earlier members of a catalog, the shallower the survey the most notorious the bias. Awareness of this selection effect, together with the relatively modest sizes and reduced dynamic range subtended by the properties of the members of our isolated galaxy samples —which are a direct consequence of the severe restrictions imposed by the selection algorithms on the range of apparent magnitudes—, leads us to conclude that the LDE approach provides the most suitable and statistically sounder control sample to set standards of reference for the H I content of galaxies. In Paper II we will present a detailed derivation of such standards by applying a non-parametric principal component analysis to a flux-limited subset of this latter dataset.
References
- Abazajian et al. (2009) Abazajian, K. N., et al. 2009, ApJS, 182, 543
- Allam et al. (2005) Allam, S. S., Tucker, D. L., Lee, B. C., & Smith, J. A. 2005, AJ, 129, 2062
- Baldry et al. (2004) Baldry, I. K., Glazebrook, K., Brinkmann, J., Ivezić, Ž., Lupton, R. H., Nichol, R. C., & Szalay, A. S. 2004, ApJ, 600, 681
- Ball et al. (2008) Ball, N. M., Loveday, J., & Brunner, R. J. 2008, MNRAS, 383, 907
- Balogh et al. (1998) Balogh, M. L., Schade, D., Morris, S. L., Yee, H. K. C., Carlberg, R. G., & Ellingson, E. 1998, ApJ, 504, L75
- Bamford et al. (2009) Bamford, S. P., et al. 2009, MNRAS, 393, 1324
- Blanton et al. (2001) Blanton, M. R., et al. 2001, AJ, 121, 2358
- Blanton et al. (2003) Blanton, M. R., et al. 2003, ApJ, 594, 186
- Blanton et al. (2005) Blanton, M. R., et al. 2005, AJ, 129, 2562
- Carlberg et al. (1997) Carlberg, R. G., Yee, H. K. C., & Ellingson, E. 1997, ApJ, 478, 462
- Casertano & Hut (1985) Casertano, S., & Hut, P. 1985, ApJ, 298, 80
- Conselice (2006) Conselice, C. J. 2006, MNRAS, 373, 1389
- Cooper et al. (2005) Cooper, M. C., Jeffrey, A. N., Madgwick, D. S., Gerke, B. F., Renbin, Y., & Davis, M. 2005, ApJ, 634, 833
- Darg et al. (2010) Darg, D. W., et al. 2010, MNRAS, 401, 1043
- Deng & Zou (2009) Deng, X.-F., & Zou, S.-Y. 2009, Astroparticle Physics, 32, 129
- di Serego Alighieri et al. (2007) di Serego Alighieri, S., et al. 2007, A&A, 474, 851
- Disney et al. (2008) Disney, M. J., Romano, J. D., Garcia–Appadoo, D. A., West, A. A., Dalcanton, J. J., & Cortese, L., 2008, Nature, 455, 1082
- Garcia-Appadoo et al. (2009) Garcia-Appadoo, D. A., West, A. A., Dalcanton, J. J., Cortese, L., & Disney, M. J. 2009, MNRAS, 394, 340
- Gavazzi et al. (1996) Gavazzi, G., Pierini, D., & Boselli, A. 1996, A&A, 312, 397.
- Gavazzi (2009) Gavazzi, G. 2009, in A Long Walk Through Astronomy: A Celebration of Luis Carrasco’s 60th Birthday, ed. E. Recillas, A. Luna, & Y. D. Mayya, RevMexAA Conference Series, 37, 72
- Giovanelli & Haynes (1985) Giovanelli, R., & Haynes, M. P. 1985, ApJ, 292, 404
- Giovanelli et al. (2005) Giovanelli, R., et al. 2005, AJ, 130, 2598
- Giovanelli et al. (2007) Giovanelli, R., et al. 2007, AJ, 133, 2569
- Guzzo et al. (1997) Guzzo, L., Strauss, M. A., Fisher, K. B., Giovanelli, R., & Haynes, M. P. 1997, ApJ, 489, 37
- Hamilton & Tegmark (2004) Hamilton, A. J. S., & Tegmark, M. 2004, MNRAS, 349, 115
- Haynes & Giovanelli (1984) Haynes, M. P., & Giovanelli, R. 1984, AJ, 89, 758
- Hubble (1926) Hubble, E. 1926, ApJ, 64, 321
- Jarrett et al. (2000) Jarrett, T. H., Chester, T., Cutri, R., Schneider, S., Rosenberg, J., Huchra, J. P., & Mader, J. 2000, AJ, 120, 298
- Karachentseva (1973) Karachentseva, V. E. 1973, Comm. Spec. Astrophys. Obs., 8, 3
- Kent et al. (2008) Kent, B. R., Giovanelli, R., Haynes, M. P., Martin, A. M., Saintonge, A., Stierwalt, S., Balonek, T. J., Brosch, N., & Koopmann, R. A. 2008, AJ, 136, 713
- Kogut et al. (1993) Kogut, A., et al. 1993, ApJ, 419, 1
- Landy (2002) Landy, S. D. 2002, ApJ, 567, L1
- Lang et al. (2003) Lang, R. H., et al. 2003, MNRAS, 342, 738
- Lintott et al. (2008) Lintott, C. J., et al. 2008, MNRAS, 389, 1179
- Lintott et al. (2010) Lintott, C. J., et al. 2010, MNRAS, 410, 166
- Mal09 (2009) Maller, A. H., Berlind, A. A., Blanton, M. R., & Hogg, D. W. 2009, ApJ, 691, 394 (Mal09)
- Martin et al. (2009) Martin, A. M., Giovanelli, R., Haynes, M. P., Saintonge, A., Hoffman, G. L., Kent, B. R., & Stierwalt, S. 2009, ApJS, 183, 214
- Masters (2005) Masters, K. L. 2005, Ph.D. thesis, Cornell University
- Masters et al. (2010a) Masters, K. L., et al. 2010a, MNRAS,404, 792
- Masters et al. (2010b) Masters, K. L., et al. 2010b, MNRAS, 405, 783
- Meyer et al. (2004) Meyer, M. J., et al. 2004, MNRAS, 350, 1195
- Prada et al. (2003) Prada, F., et al. 2003, ApJ, 598, 260
- Ramella et al. (1992) Ramella, M., Geller, M. J., & Huchra, J. P. 1992, ApJ, 384, 404
- Roberts & Haynes (1994) Roberts, M. S., & Haynes, M. P. 1994, ARA&A, 32, 115
- Rosenberg & Schneider (2002) Rosenberg, J. L., & Schneider, S. E. 2002, ApJ, 567, 247
- Saintonge (2007) Saintonge, A. 2007, AJ, 133, 2087
- Saintonge et al. (2008) Saintonge, A., Giovanelli, R., Haynes, M P., Hoffman, G. L., Kent, B. R., Martin, A. M., Stierwalt, S., & Brosch, N. 2008, AJ, 135, 588
- Shao et al. (2007) Shao, Z., Xiao, Q., Shen, S, Mo, H. J., Xia, X., & Deng, Z. 2007, ApJ, 659, 1159
- Schlegel et al. (1998) Schlegel, D. J., Finkbeiner, D. P., & Davis, M. 1998, ApJ, 500, 525
- Schneider et al. (2010) Schneider, D. P., et al. 2010, AJ, 139, 2360
- Serra et al. (2010) Serra, P., et al. 2010, in Galaxies in Isolation: Exploring Nature versus Nurture, ed. L. Verdes-Montenegro, A. del Olmo, and J. W. Sulentic, ASP Conference Series, 421, 49
- Shimasaku et al. (2001) Shimasaku, K., et al. 2001, AJ, 122, 1238
- Skrutskie et al. (2006) Skrutskie, M. F., et al. 2006, AJ, 131, 1163
- Springob et al. (2007) Springob, C. M., Masters, K. L., Haynes, M. P., Giovanelli, R., & Marinoni, C. 2007, ApJS, 172, 599
- Solanes et al. (1996) Solanes, J. M., Giovanelli, R., & Haynes, M. P. 1996, ApJ, 461, 60
- Solanes et al. (2001) Solanes, J. M., Manrique, A., González-Casado, G., García-Gómez, C., Giovanelli, R., & Haynes, M. P. 2001, ApJ, 548, 97
- Spearman (1904) Spearman, C. 1904, Am. J. Psychol., 15, 72
- Stierwalt et al. (2009) Stierwalt, S., Haynes, M. P., Giovanelli, R., Kent, B. R., Martin, A. M., Saintonge, A., Karachentsev, I. D., & Karachentseva, V. E. 2009, AJ, 138, 338
- Stoughton et al. (2002) Stoughton, C., et al. 2002, AJ, 123, 485
- Strateva et al. (2001) Strateva, I., et al. 2001, AJ, 122, 1861
- Strauss et al. (2002) Strauss, M. A., et al. 2002, AJ, 124, 1810
- Struble & Rood (1991) Struble, M. F., & Rood, H. J. 1991, ApJS, 77, 363
- Tago et al. (2008) Tago, E., Einasto, J., Saar, E., Tempel, E., Einasto, M., Vennik, J., & Müller, V. 2008, A&A, 479, 927
- Toribio et al. (2010) Toribio, M. C., Solanes, J. M., Giovanelli, R., Haynes, M. P., & Martin, A. M. 2010, ApJ, in press (Paper II)
- Verley et al. (2007) Verley, S., et al. 2007, A&A, 472, 121
- Wang et al. (2010) Wang, J., et al. 2010, MNRAS, in press (astro-ph/1011.0829)
- West et al. (2009) West, A. A., Garcia-Appadoo, D. A., Dalcanton, J. J., Disney, M. J., Rockosi, C. M., & Ivezić, Ž. 2009, AJ, 138, 796
- Zwaan et al. (1997) Zwaan, M. A., Briggs, F. H., Sprayberry, D., & Sorar, E. 1997, ApJ, 490, 173
| ALFA | ALFA/SDSS-phot | ALFA/SDSS-spec* | SDSS-spec | SDSS-spec/ALFA | |
|---|---|---|---|---|---|
| (km s-1) | () | () | () | ||
| 71 | 65 (91%) | 50 (77%) | 37 | 18 (49%) | |
| 500–4000 | 1523 | 1417 (93%) | 1024 (72%) | 1702 | 910 (53%) |
| 4000–7500 | 3104 | 3066 (99%) | 2529 (82%) | 5102 | 2420 (47%) |
| 7500–11,000 | 3385 | 3353 (99%) | 2947 (88%) | 9196 | 2853 (31%) |
| 11,000–14,500 | 2280 | 2261 (99%) | 2025 (89%) | 9341 | 1977 (21%) |
| 14,500–18,000 | 876 | 871 (99%) | 807 (93%) | 10187 | 787 ( 8%) |
| Totals | 11,239 | 11,033 (98%) | 9382 (85%) | 35,565 | 8965 (25%) |
Note. — Numbers in different velocity bins of ALFALFA galaxies (ALFA), H I detections with a photometric counterpart in SDSS (ALFA/SDSS-phot), and H I detections with a spectroscopic counterpart in SDSS (ALFA/SDSS-spec*), regardless of the morphological classification of their SDSS spectrum, in the region where both catalogs overlap. SDSS-spec designates the sample of SDSS sources with both photometric and spectral morphology classified as of galaxy type and having mag, while SDSS-spec/ALFA identifies the subset of SDSS-spec galaxies with an ALFALFA counterpart. Fractions are given in parentheses.
| Acronym | Selection criterion | |
|---|---|---|
| LDE | 5647 | Low local galaxy density environment ( galaxies Mpc-3) |
| IG1 | 461 | Isolation inferred from spectro-photometric information (Equation 9) |
| IG2 | 236 | Isolation inferred from photometric information (Equation 10) |
| SDSS-spec | SDSS-spec/ALFA | |||
|---|---|---|---|---|
| (km s-1) | () | () | ||
| 2000–7000 | 2063 | 1893 () | 1330 | 1257 () |
| 7000–11,000 | 3912 | 3403 () | 1529 | 1411 () |
| 11,000–18,000 | 7889 | 6472 () | 1555 | 1414 () |
| Totals | 13864 | 11768 () | 4414 | 4082 () |
Note. — Numbers in different velocity bins of SDSS-spec and SDSS-spec/ALFA galaxies (the definition of these subsets can be found in the caption of Table 1) in low density environments satisfying Mal09’s disk-identification criterion (). We only consider galaxies with (-band) Sérsic index and axis ratio . Fractions are given in parentheses.


 |
 |
 |
 |
 |
 |