Numerical convergence of the block-maxima approach to the Generalized Extreme Value distribution
Abstract
In this paper we perform an analytical and numerical study of Extreme Value distributions in discrete dynamical systems. In this setting, recent works have shown how to get a statistics of extremes in agreement with the classical Extreme Value Theory. We pursue these investigations by giving analytical expressions of Extreme Value distribution parameters for maps that have an absolutely continuous invariant measure. We compare these analytical results with numerical experiments in which we study the convergence to limiting distributions using the so called block-maxima approach, pointing out in which cases we obtain robust estimation of parameters. In regular maps for which mixing properties do not hold, we show that the fitting procedure to the classical Extreme Value Distribution fails, as expected. However, we obtain an empirical distribution that can be explained starting from a different observable function for which Nicolis et al. (2006) have found analytical results.
1 Introduction
Extreme Value Theory (EVT) was first developed by Fisher and Tippett (1928) and formalized by Gnedenko (1943) which showed that the distribution of the block-maxima of a sample of independent identically distributed (i.i.d) variables converges to a member of the so-called Extreme Value (EV) distribution. It arises from the study of stochastical series that is of great interest in different disciplines: it has been applied to extreme floods (Gumbel, 1941), (Sveinsson and Boes, 2002), (P. and Hense, 2007), amounts of large insurance losses (Brodin and Kluppelberg, 2006), (Cruz, 2002); extreme earthquakes (Sornette et al., 1996), (Cornell, 1968), (Burton, 1979); meteorological and climate events (Felici et al., 2007a), (Felici et al., 2007b),(Vitolo et al., 2009b), (Altmann et al., 2006), (Nicholis, 1997), (Smith, 1989). All these events have a relevant impact on socioeconomic activities and it is crucial to find a way to understand and, if possible, forecast them (Hallerberg and Kantz, 2008), (Kantz et al., 2006).
The attention of the scientific community to the problem of modeling extreme values is growing. An extensive account of recent results and relevant applications is given in Ghil et al. (2011). Such an interest is mainly due to the fact that this theory is also important in defining risk factor in a wide class of applications such as the modeling of financial risk after the significant instabilities in financial markets worldwide (Gilli and Këllezi, 2006), (Longin, 2000), (Embrechts et al., 1999), the analysis of seismic and hydrological risk (Burton, 1979), (Martins and Stedinger, 2000). Even if the probability of extreme events decreases with their magnitude, the damage that they may bring increases rapidly with the magnitude as does the cost of protection against them Nicolis et al. (2006).
From a theoretical point of view, extreme values represent extreme fluctuations of a system. Very recently, many authors have shown clearly how the statistics of global observables in correlated systems can be related to EV statistics (Dahlstedt and Jensen, 2001), (Bertin, 2005). Clusel and Bertin (2008) have shown how to connect fluctuations of global additive quantities, like total energy or magnetization , by statistics of sums of random variables in such a way that it is possible to identify a class of random variables whose sum follows an extreme value distributions.
The so called block-maxima approach is widely used in EVT since it represents a very natural way to look at extremes. It consists of dividing the data series of some observable into bins of equal length and selecting the maximum (or the minimum) value in each of them (Coles et al., 1999).
When dealing with climatological or financial data, since we usually have limited data-set, the main problem in applying EVT is related to the choice of a sufficiently large statistics of extremes provided that each bin contains a suitable number of observations. Therefore a smart balance between number of maxima and observations per bin is needed (Felici et al., 2007a), (Katz and Brown, 1992), (Katz, 1999), (Katz et al., 2005).
Recently a number of alternative approaches have been studied. One consists in looking at exceedance over high thresholds rather than maxima over fixed time periods. While the idea of looking at extreme value problems from this point of view is very old, the development of a modern theory has started with Todorovic and Zelenhasic (1970) that have proposed the so called Peaks Over Threshold approach. At the same time there was a mathematical development of procedures based on a certain number of extreme order statistics (Pickands III, 1975), (Hill, 1975) and the Generalized Pareto distribution for excesses over thresholds (Smith, 1984), (Davison, 1984), (Davison and Smith, 1990).
Since dynamical systems theory can be used to understand features of physical systems like climate and forecast financial behaviors, many authors have studied how to extend EVT to these field. When dealing with dynamical systems we have to know what kind of properties (i.e. stability, degree of mixing, correlations decay) are related to Gnedenko’s hypotheses and also which observables we must consider in order to obtain an EV distribution. Furthermore, even if the convergence is achieved, we should evaluate how fast it is depending on all parameters and properties used. Empirical studies show that in some cases a dynamical observable obeys to the extreme value statistics even if the convergence is highly dependent on the kind of observable we choose (Vannitsem, 2007), (Vitolo et al., 2009b), (Vitolo et al., 2009a). For example, Balakrishnan et al. (1995) and more recently Nicolis et al. (2006) and Haiman (2003) have shown that for regular orbits of dynamical systems we don’t expect to find convergence to EV distribution.
The first rigorous mathematical approach to extreme value theory in dynamical systems goes back to the pioneer paper by P. Collet in 2001 (Collet, 2001). Collet got the Gumbel Extreme Value Law (see below) for certain one-dimensional non-uniformly
hyperbolic maps which admit an absolutely continuous invariant measure and exhibit exponential decay of correlations. Collet’s approach used Young towers (Young, 1999), (Young, 1998) and his suggestion was successively applied to other systems. Before quoting them, we would like to point out that Collet was able to establish a few conditions (usually called and ) and which have been introduced by Leadbetter (Leadbetter et al., 1983) with the aim to associate to the stationary stochastic process given by the dynamical system, a new stationary independent sequence which enjoyed one of the classical three extreme value laws, and this law could be pulled back to the original dynamical sequence. Conditions and require a sort of independence of the stochastic dynamical sequence in terms of uniform mixing condition on the distribution functions. Condition was successively improved by Freitas and Freitas (Freitas and Freitas, 2008a), in the sense that they introduced a new condition, called , which is weaker than and that could be checked directly by estimating the rate of decay of correlations for Hölder observables 111We briefly state here the two conditions, we defer to the next section for more details about the quantities introduced. If is a stochastic process, we define and we put . Moreover we set and two normalising sequences and , where is a real number, cf. next section for the meaning of these variables. The condition holds for the sequence if for any integer we have , where is non-increasing in for each and as for some sequence , .
We say condition holds for the sequence if . Whenever the process is given by the iteration of a dynamical systems, the previous two conditions could also be formulated in terms of decay of correlation integrals, see Freitas and Freitas (2008b), Gupta (2010).. We notice that conditions and allow immediately to get Extreme Value Laws for absolutely continuous invariant measures for uniformly one-dimensional expanding dynamical systems: this is the case for instance of the 1-D maps with constant density studied in Sect. 3 below. Another interesting issue of Collet’s paper was the choice of the observables ’s whose values along the orbit of the dynamical systems constitute the sequence of events upon which we successively search for the partial maximum. Collet considered a function of the distance with respect to a given point , with the aim that achieves a global maximum at almost all points in the phase space; for example . Using a different , Freitas and Freitas (Moreira Freitas and Freitas, 2008) were able to get the Weibull law for the family of quadratic maps with the Benedicks-Carlesson parameters and for taken as the critical point or the critical value, so improving the previous results by Collet who did not keep such values in his set of full measure.
The latter paper (Moreira Freitas and Freitas, 2008) strongly relies on condition ; this condition has also been invoked to establish the extreme value laws on towers which model dynamical systems with stable foliations (hyperbolic billiards, Lozi maps, Hénon diffeomorphisms, Lorenz maps and flows). This is the content of the paper by Gupta, Holland and Nicol (Gupta et al., 2009). We point out that the observable was taken in one of three different classes , see Sect. 2 below, each one being again a function of the distance with respect to a given point . The choice of these particular forms for the ’s is just to fit with the necessary and sufficient condition on the tail of the distribution function , see next section, in order to exist a non-degenerate limit distribution for the partial maxima (Freitas et al., 2009), (Holland et al., 2008). The paper Gupta et al. (2009) also covers the easier case of uniformly hyperbolic diffeomorphisms, for instance the Arnold Cat map which we studied in Sect. 3.2.
Another major step in this field was achieved by establishing a connection between the extreme value laws and the statistics of first return and hitting times, see the papers by Freitas, Freitas and Todd (Freitas et al., 2009), (Freitas et al., 2010b). They showed in particular that for dynamical systems preserving an absolutely continuous invariant measure or a singular continuous invariant measure , the existence of an exponential hitting time statistics on balls around almost any point implies the existence of extreme value laws for one of the observables of type described above. The converse is also true, namely if we have an extreme value law which applies to the observables of type achieving a maximum at , then we have exponential hitting time statistics to balls with center . Recently these results have been generalized to local returns around balls centered at periodic points (Freitas et al., 2010a). We would like to point out that the equivalence between extreme values laws and the hitting time statistics allowed to prove the former for broad classes of systems for which the statistics of recurrence were known, for instance for expanding maps in higher dimension.
In this work we consider a few aspects of the extreme value theory applied to dynamical systems throughout both analytical results and numerical experiments. In particular we analyse the convergence to EV limiting distributions pointing out how robust are parameters estimations. Furthermore, we check the consistency of block-maxima approach highlighting deviations
from theoretical expected behavior depending on the number of maxima and number of block-observation. To perform our analysis we use low dimensional maps with different properties: mixing maps in which we expect to find convergence to EV distributions and regular maps where the convergence is not ensured.
The work is organised as follow: in section 2 we briefly recall methods and results of EVT for independent and identical distributed (i.i.d.) variables and dynamical systems. In section 3 we explicitly compute theoretical expected distributions parameter in respect to the observable functions of type for map that have constant density measure. Numerical experiments on low dimensional maps are presented. In section 4 we show that it is possible to derive an asymptotic expression of normalising sequences when the density measure is not constant. As an example we derive the explicit expressions for the Logistic map. Eventually, in section 5 we repeat the experiment for regular maps showing that extreme values laws do not follow from numerical experiments.
2 Background on EVT
Gnedenko (1943) studied the convergence of maxima of i.i.d. variables
with cumulative distribution (cdf) of the form:
Where and are normalising sequences and . It may be rewritten as where . Such types of normalising sequences converge to one of the three type of Extreme Value (EV) distribution if necessary and sufficient conditions on parent distribution of variables are satisfied (Leadbetter et al., 1983). EV distributions include the following three families:
-
•
Gumbel distribution (type 1):
(1) -
•
Fréchet distribution (type 2):
(2) -
•
Weibull distribution (type 3):
(3)
Let us define the right endpoint of a distribution function as:
| (4) |
then, it is possible to compute normalising sequences and using the following corollary of Gnedenko’s theorem :
Corollary (Gnedenko): The normalizing sequences and in the convergence of normalized maxima may be taken (in order of increasing complexity) as:
-
•
Type 1: ;
-
•
Type 2: ;
-
•
Type 3: ;
where
| (5) |
| (6) |
and is a constant. It is important to remark that the choice of normalising sequences is not unique (Leadbetter et al., 1983). For example for of type 2 distribution it is possible to choose
either or . In particular, we will use the last one since it is a more general choice that ensure the convergence for a much broader class of initial distributions (Beirlant, 2004).
Instead of Gnedenko’s approach it is possible to fit unnormalized data directly to a single family of generalized distribution called GEV distribution with cdf:
| (7) |
which holds for , using (location parameter) and (scale parameter) as scaling constants in place of , and (Pickands III, 1968). is the shape parameter also called the tail index: when , the distribution corresponds to a
Gumbel type. When the index is negative, it corresponds to a Weibull; when the index is positive,
it corresponds to a Fréchet.
In order to adapt the extreme value theory to dynamical systems, we will consider the stationary stochastic process given by:
| (8) |
where ’dist’ is a Riemannian metric on , is a given point and is an observable function, and whose partial maximum is defined as:
| (9) |
The probability measure will be here an invariant measure for the dynamical system. As we anticipated in the Introduction, we will use three types of observables , suitable to obtain one of the three types of EV distribution for normalised maxima:
| (10) |
| (11) |
| (12) |
where is a constant and .
These three type of functions are representative of broader classes which are defined, for instance, throughout equations (1.11) to (1.13) in Freitas et al. [2009]; we now explain the reasons and the meaning of these choices. First of all these functions have in common the following properties: (i) they are defined on the positive semi-axis with values into ; (ii) is a global maximum, possibly equal to ; (iii) they are a strictly decreasing bijection in a neighborhood of with image . Then we consider three types of behavior which generalize the previous specific choices:
Type 1: there is a strictly positive function such that we have
Type 2: and there exists such that we have
Type 3: and there exists such that we have
The Gnedenko corollary says that the different kinds of extreme value laws are determined by the distribution of and by the right endpoint of , . We will see in the next section that the local invertibility of in the neighborhood of together with the Lebesgue’s differentiation theorem (which basically says that whenever the measure is absolutely continuous with respect to Lebesgue with density , the the measure of a ball of radius centered around almost any point scales like ), allow us to compute the tail of , in fact we have
where is any of the three types of functions introduced in (10) to (12) and denotes the diameter of the set . As we said above the tail of determines the three limit laws for partial maximum of i.i.d. sequences. In particular Th. 1.6.2. in Leadbetter et al. (1983) specifies what kind of conditions the distribution function must verify to get one specific law: the above type 1,2,3 assumptions are just the translation in terms of the shape of of the conditions on the tail of .
3 Distribution of Extremes in mixing maps with constant density measure
Our goal is to use a block-maxima approach and fit our unnormalised data to a GEV distribution; for that it will be necessary to find a linkage among , , and . At this regard we will use Gnedenko’s corollary to compute normalising sequences showing that they correspond to the parameter we obtain fitting directly data to GEV distribution.
We derive the correct expression for mixing maps with constant density measure and the asymptotic behavior for logistic map that is a case of non-constant density measure.
3.1 Asymptotic sequences
In this section we will consider the case of uniformly hyperbolic maps which preserve the Lebesgue measure (the density ) and satisfy the conditions and , sufficient to get extreme valuers distributions. For the second map, the algebraic automorphisms of the torus better known as the Arnold cat map, the existence of extreme value laws follows from the theory developed in Gupta et al. (2009). Starting from the definitions provided by Gnedenko we derive as a novel result the exact expression for the normalising sequences and .
Case 1: (x)= -log(dist(x,)).
and the last line is justified by using Lebesgue’s Differentiation Theorem. Then, for maps with constant density measure, we can write:
| (14) |
where is the dimension of the space and is a constant. To use Gnedenko corollary it is necessary to calculate
in this case .
Using Gnedenko equation 6 we can calculate as follows:
| (15) |
According to the Leadbetter et al. (1983) proof of Gnedenko theorem we can study both and or convergence as:
| (16) |
then we can use the connection between and normalising sequences to find and .
so that:
Case 2: (x)=dist(x,.
We can proceed as for :
| (17) |
in this case .
| (18) |
where is a constant.
Case 3: (x)=C-dist(x,.
Eventually we compute and for the observable class:
| (19) |
in this case .
| (20) |
For type 3 distribution:
| (21) |
3.2 Numerical Experiments
Since we want to show that unnormalised data may be fitted by using the GEV distribution we expect to find the following equivalence:
where, clearly, and . This fact can be seen as a linear change of variable: the variable has a GEV distribution (that is an EV one parameter distribution with and normalising sequences) while is GEV distributed .
As we said above we now apply the previous considerations to two maps which enjoy extreme values laws and have constant density: we summarize below the theoretical results we obtained for all three type of observables. We have obtained the results in terms of but, since we fix , the previous results can be translated in terms of as follows:
For type observable:
| (22) |
For type observable:
| (23) |
For type observable:
| (24) |
Following Freitas et al. (2009) we obtain the expression for the shape parameters: for type , for type and for type.
In order to provide a numerical test of our results we consider a one-dimensional and a two dimensional map. The one dimensional map used is a Bernoulli Shift map:
| (25) |
with .
The considered two dimensional map is the famous Arnold’s cat map defined on the 2-torus by:
| (26) |
A wide description of properties of these maps can be found in Arnold and Avez (1968) and Hasselblatt and Katok (2003).
We proceed as follows. For each map we run a long simulation up to iterations starting from a given initial condition . Note that
the results - as we tested - do not depend on the choice of . From the trajectory we compute the sequence of observables , , as
follows dividing it into bins each containing observations. Then, we test the degree of agreement between
the empirical distribution of the maxima and the GEV distribution according to the theoretical values presented above. A priori, it is reasonable to assume GEV as a suitable family of statistical models. For some selected values of , the maxima are normalised and fitted to GEV distributions using a maximum likelihood method which selects values of the model parameters that produce the distribution most likely to have resulted in the observed data.
All the numerical analysis contained in this work has been performed using MATLAB Statistics Toolbox functions such as gevfit and gevcdf. These functions return maximum likelihood estimates of the parameters for the generalized extreme value (GEV) distribution giving 95% confidence intervals for estimates (Martinez and Martinez, 2002).
As in every fitting procedure, it is necessary to test the a posteriori goodness of fit. We anticipate that in every case considered, fitted distributions passed, with maximum confidence interval, the Kolmogorov-Smirnov test described in Lilliefors (1967).
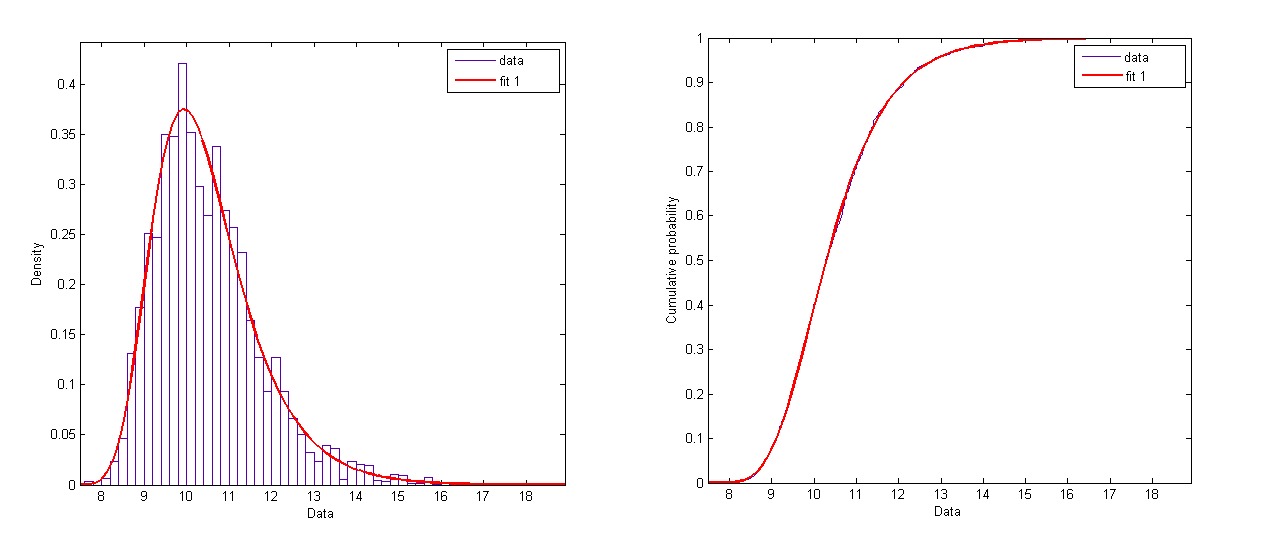
For illustration purposes, we present in figure 1 an empirical pdf and cdf with the corresponding fits.
Once is set to a given value (in our case ), the numerical simulations allow us to explore two limiting cases of great interest in applications where the statistical inference is intrinsically problematic:
-
1.
is small ( is large), so that we extract only few maxima, each corresponding to a very extreme event.
-
2.
is small ( is large), so that we extract many maxima but most of those will not be as extreme as in case 1).
In case 1), we have only few data - of high quality - to fit our statistical models whereas in case 2) we have many data but the sampling
may be spoiled by the inclusion of data not giving a good representation of extreme events. We have in general that in order to obtain a reliable fit for a distribution with parameters we need independent data (Felici et al., 2007a) so that we expect that fit procedure gives reliable results for . As the value of determines to which extend the extracted bin maximum is representative of an extreme , below a certain value
our selection procedure will be unavoidably misleading. We have no obvious theoretical argument to define the value of . We expect to obtain good fits throughout the parametric region where the constraints on are satisfied. Therefore, our flexibility in choosing satisfying pairs increases with larger values of .
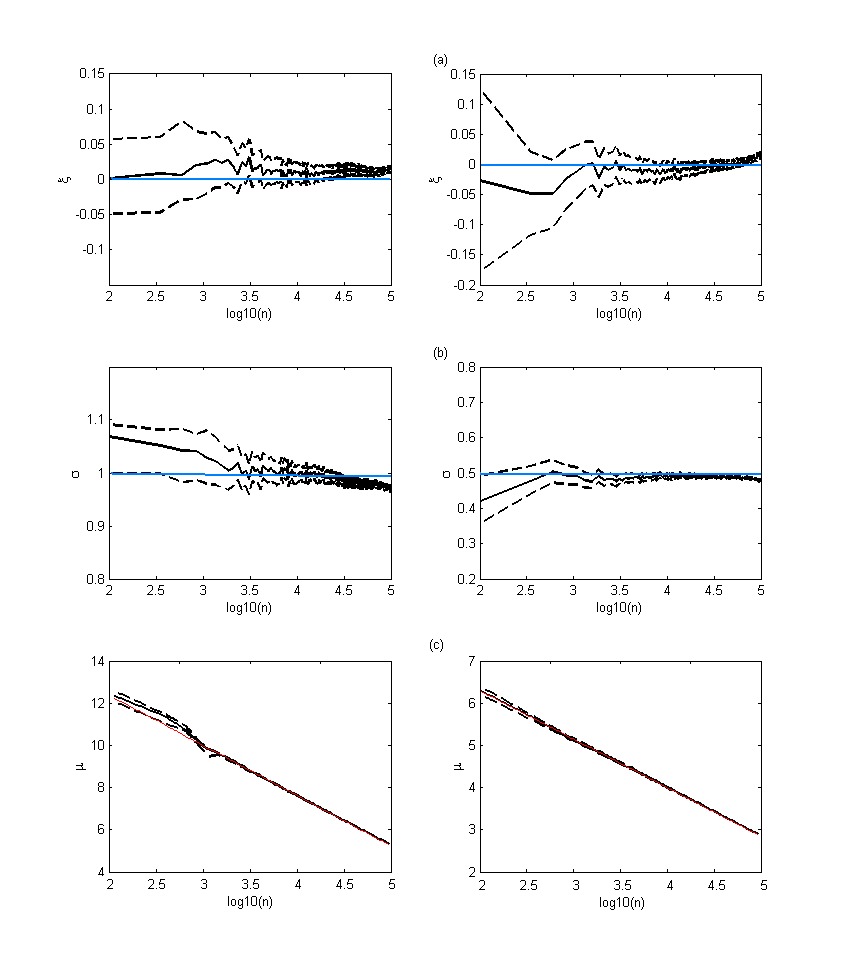
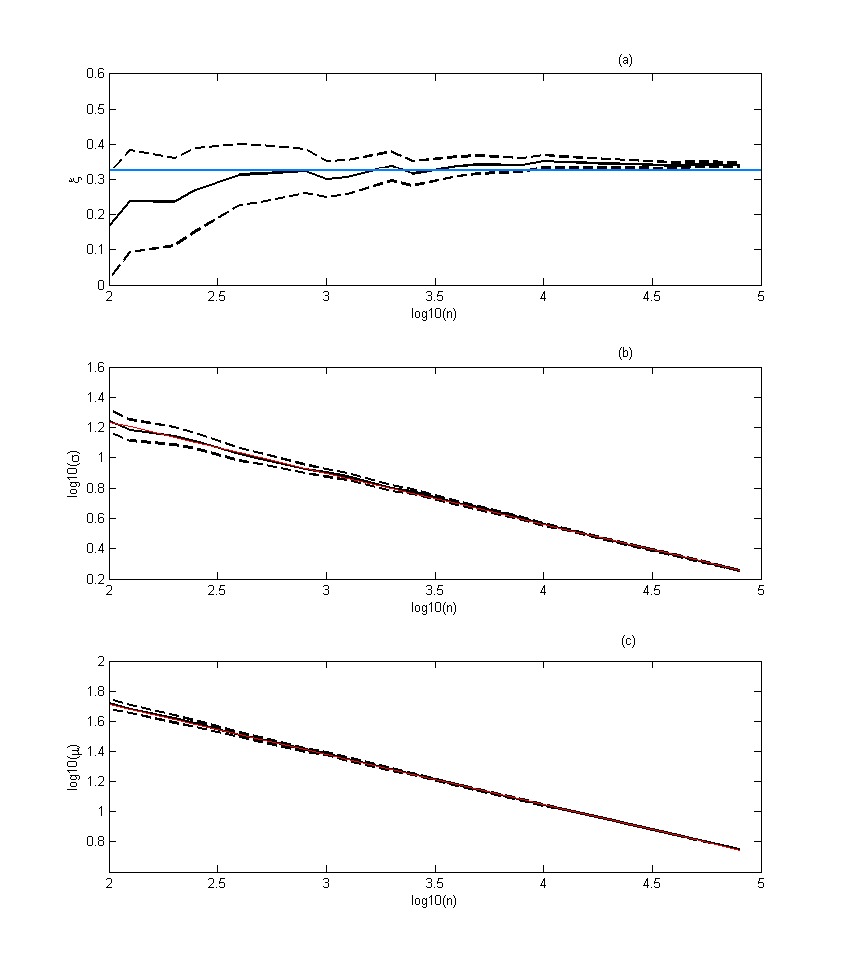
For a type observable function the behavior against of the three parameters is presented in figure 2. According to equation 22 we expect to find . For relatively small values of the sample is too small to ensure a good convergence to analytical and confidence intervals are wide. On the other hand we see deviations from expected value as that is when . For the scale parameter a similar behavior is achieved and deviations from expected theoretical values for Arnold Cat Map and for Bernoulli Shift are found when or . Location parameter shows a logarithm decay with as expected from equation 22. A linear fit of in respect to is shown with agray line in figure 2. The linear fit computed angular coefficients of equation 22 well approximate : for Bernoulli Shift map we obtain while for Arnold Cat map .
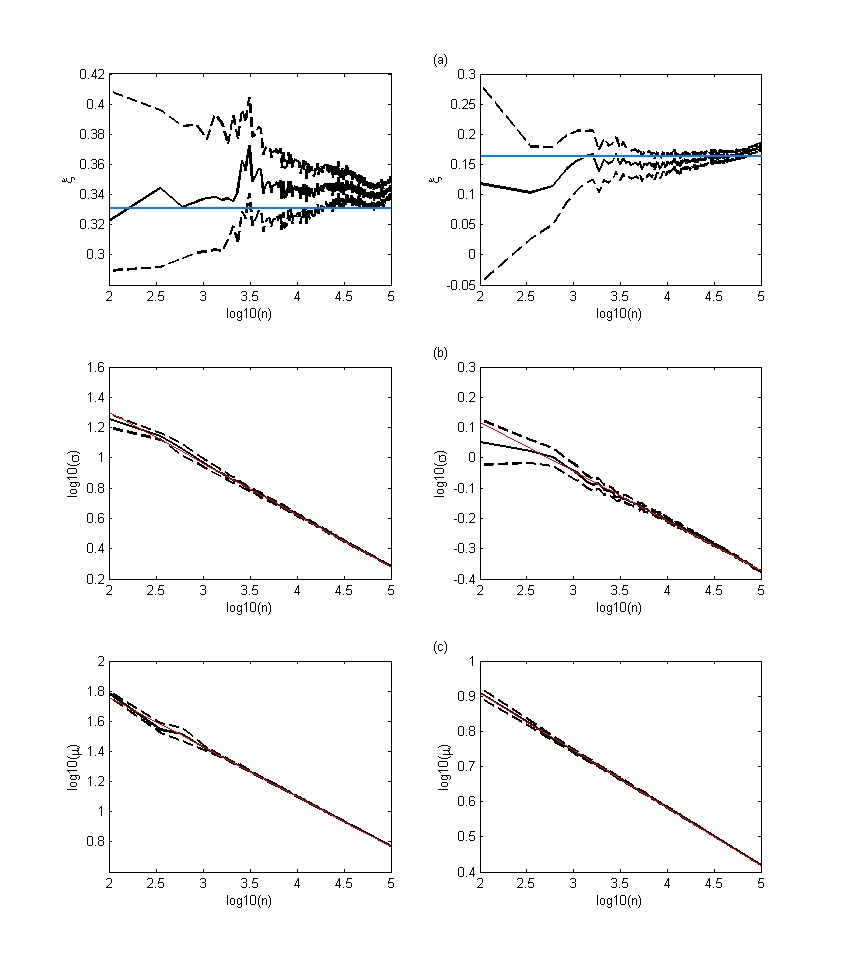
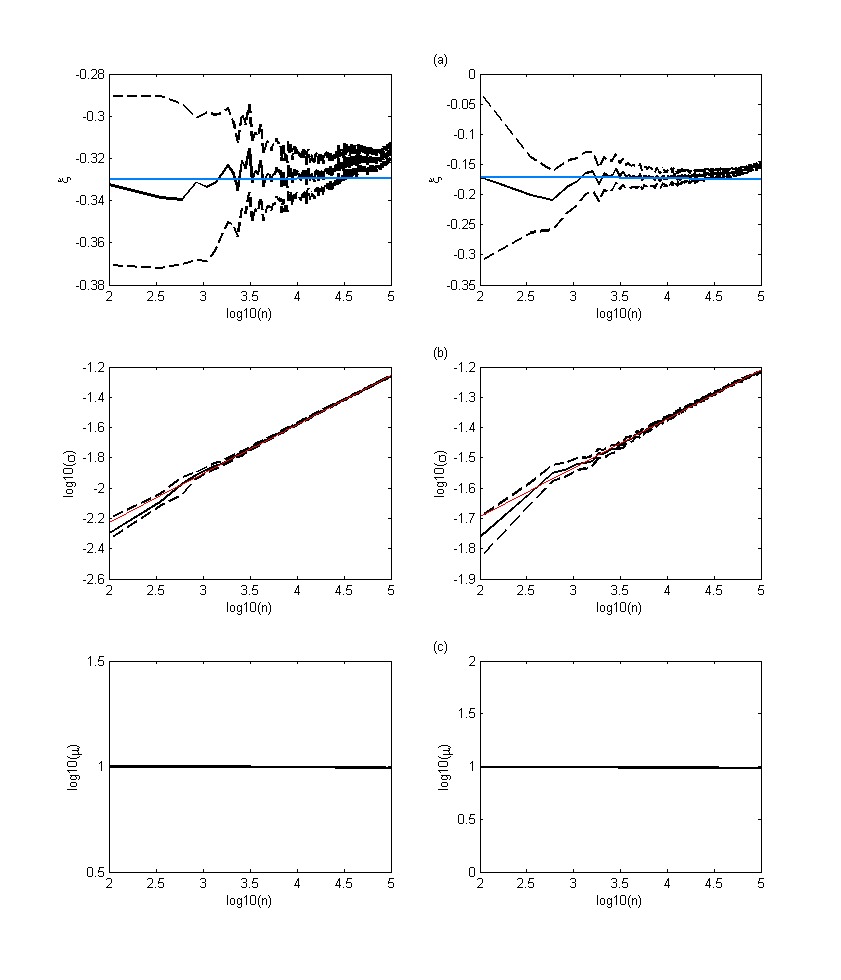
We find that values have best matching with theoretical ones with reliable confidence interval when both and . These results are confirmed even for type and type observable functions as shown in figures 3a) and 4a) respectively.
We present the fit results for but we have done tests for different and for fixed and different .
For observable function we can also check that and parameters follow a power law as described in eq. 23. In the log-log plot in Figure 3b), 3c), we can see a very clear linear
behavior. For the Bernoulli Shift map we obtain for series , for
in good agreement with theoretical value of . For Arnold Cat map we expect to find , from the experimental data we obtain for and for .
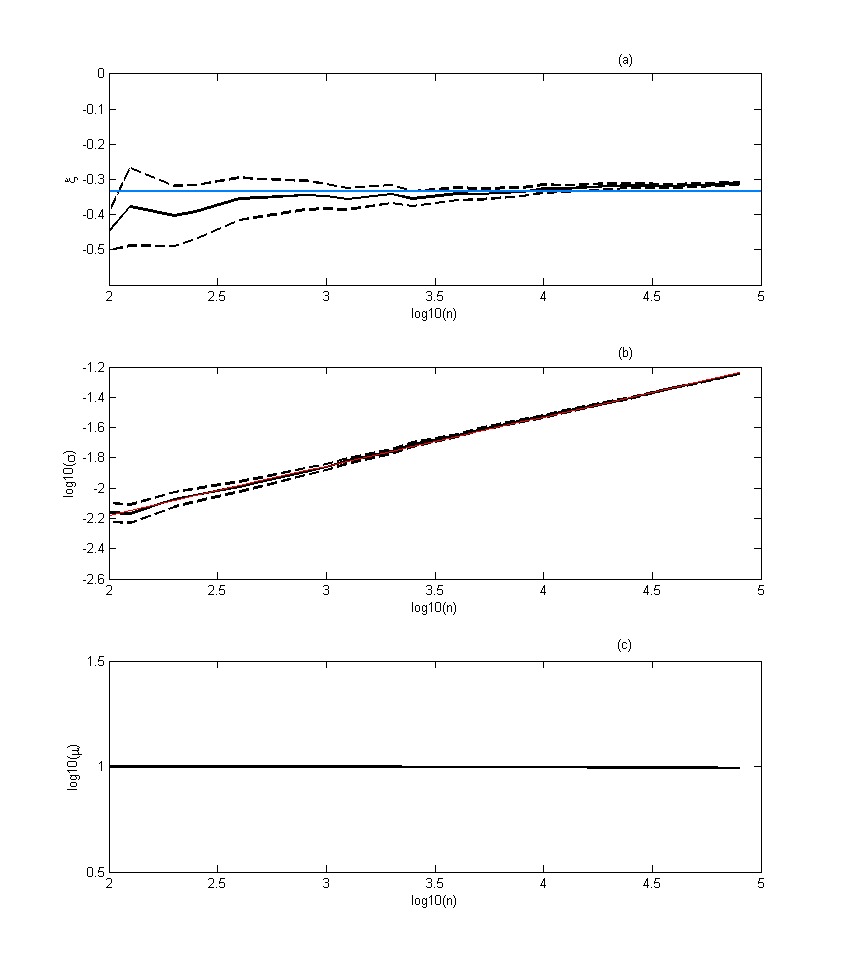
Eventually, computing as observable function we expect to find a constant value for while has to grow with a power law in respect to as expected from
equation 24.
As in case we expect and numerical results shown in figure 4b), 4c) are consistent with the theoretical one since for Bernoulli shift map and for Arnold Cat map.
4 Distributions of Extremes in mixing map with non-constant density measure
4.1 Asymptotic sequences
The main problem when dealing with maps that have absolutely continuous but non-constant density measure is in the computation of the integral:
| (27) |
where is the -dimensional ball of radius centered in .
We have to know the value of this integral in order to evaluate and, therefore, the sequences and .
As shown in the previous section is linked to the observable type: in all cases, since we substitute , means that we are interested in .
In this limit, a first order approximation of the previous integral is:
| (28) |
that is valid if we are not in a neighborhood of a singular point of .
As an example we compute the asymptotic sequences for a logistic map:
| (29) |
with . This map satisfies hypothesis described in the analysis performed for Benedicks-Carleson maps in Moreira Freitas and Freitas (2008).
For this map the density of the absolutely continuous invariant measure is explicit and reads:
| (30) |
So that:
| (31) |
where and . Since Extreme Value Theory effectively works only if are large enough, the results in eq. 31 can be replaced by a series expansion for :
| (32) |
up to order , where:
| (33) |
Using the last two equations we are able to compute asymptotic normalising sequences and for all observables.
Case 1: (x)= -log(dist(x,)).
For observable functions we set . In case of logistic map . First we have to compute using equation 15 and the expansion in eq. :
| (34) |
We can compute , if , as follows:
| (35) |
At the first order in eq. 32 we get
| (36) |
so that:
| (37) |
Therefore, the sequences and if are:
| (38) |
| (39) |
Case 2: (x)=dist(x,.
We can proceed as for setting , computing we get at the first order in eq. 32:
| (40) |
| (41) |
We can respectively compute and as:
| (42) |
Case 3: (x)=C-dist(x,.
As in the previous cases, we compute up to the first order setting :
| (43) |
| (44) |
For type 3 distribution:
| (45) |
where .
4.2 Numerical experiment on the logistic map
Following the same procedure detailed in section 3.2, we want to show the equivalence between EV computed normalising sequences and and the parameters of a GEV distribution obtained directly fitting the data even in case of logistic map that has not constant density measure. Using eq. 38-39 for , we obtain the following theoretical expression:
| (46) |
From eq. 39, for observable type, we write:
| (47) |
and in case using eq. 45, we expect to find:
| (48) |
Values of are independent on density and, as stated in Freitas’ for type , for type and for type.
In figures 5-7 we presents a numerical test of the asymptotic behavior described in equations 46 - 48 on logistic map for , , , against the variable . As shown in previous section, block maxima approach works well with maps with constant density measure when and are at least : In fact, regarding parameter. Significant deviations from the theoretical value are achieved when or even in the case of the Logistic Map.
Regarding and , for observable a linear fit of in respect to give us , while shows the same behavior of since the best agreement with theoretical value is achieved when . In the log-log plots of figure 6b), 6c) for observable, we can observe again the expected linear
behavior for and with corresponding to . From numerical fit we obtain for series and for in good agreement with theoretical value of . By applying a linear fit to the log-log plot in figure 7b), the angular coefficient corresponding to series is again consistent with the theory.
For a logistic map we can also check the GEV behavior in respect to initial conditions. If we fix and fit our data to GEV distribution for different an asymptotic behavior is reached as shown from the previous analysis.
For observable function we have observed that the first order approximation works well for all three parameters. Deviation from this behavior are achieved for and as the measure become singular when we move to these points and we should take in account other terms of the series expansion. Numerically, we found that deviations from first order approximation are meaningful only if and . Averaging over both and we obtain and where the uncertainties are computed with respect to the estimator. Since we expect and at zero order approximation, numerical results are consistent with the theoretical ones; furthermore, experimental data are normally distributed around theoretical values.
Asymptotic expansion also works well for observables: we obtain in excellent agreement with theoretical value .
Eventually, in , averaging over different initial conditions we get that is again consistent to theoretical value -1/3.
5 The case of regular maps
Freitas and Freitas (2008a) have posed the problem of dependent extreme values in dynamical systems that show uniform quasi periodic motion. Here we try to investigate this problem numerically. We have used a one-dimensional and a bi-dimensional discrete map. The first one is the irrational translation on the torus defined by:
| (49) |
And for the bidimensional case, we use the so called standard map:
| (50) |
with . For this value of , the standard map exhibits a regular behavior and it is not mixing, as well as torus translations. This means that these maps fail in satisfying hypothesis and and moreover they do not enjoy as well an exponential hitting time statistics. About this latter statistics, it is however known that it exists for torus translation and it is given by a particular piecewise linear function or a uniform distribution depending on which sequence of sets is considered (Coelho and De Faria, 1996). In a similar way, a non-exponential Hitting Time Statistics (HTS) is achieved for standard map when as well as for a skew map, that is a standard map with (Buric et al., 2005). Therefore we expect not to obtain a GEV distribution of any type using observables.
We have pointed out that the observable functions choice is crucial in order to observe some kind of distribution of extreme values when we are dealing with dynamical systems instead of stochastic series. Nicolis et al. (2006) have shown how it is possible to obtain an analytical EV distribution which does not belong to GEV family choosing a simple observable: they considered the series of distances between the iterated trajectory and the initial condition. Using the same notation of section 2 we can write:
For this observable they have shown that the cumulative distribution of a uniform quasi periodic motions is not smooth but piecewise linear (Nicolis et al. (2006), figure 3). Furthermore slop changes of can be explained by constructing the intersections between different
iterates of equation 49.
must correspond to a density distribution continuous obtained as a composition of box functions: each box must be related to a change in the slope of .
The numerical results we report below confirm that for the maps 49 and 50
the distributions of maxima for various observables cannot be fitted
with a GEV since they are multi modal. We recall that the return times into a
sphere of vanishing radius do not have a spectrum, if the orbits
have the same frequency, whereas a spectrum appears if the frequency
varies continuously with the action, as in the standard map
for close to zero (Hu et al., 2004). Since the EV statistics refers to a
single orbit, no change due to the local mixing, which insures the
existence of a return times spectrum (Hu et al., 2004), can be observed.
Considering that the GEV exists when the system is mixing and does
not when it is integrable, one might use the quality of fit to GEV as
a dynamical indicator, for systems which exhibit regions with
different dynamical properties, ranging from integrable to mixing as
it occurs for the standard map when is order 1.
Indeed we expect that in the neighborhood of a low order resonance,
where the omoclinic tangle of intersecting separatrices appears, a
GEV fit is possible. Preliminary computations carried out for the
standard map and for a model with parametric resonance confirm this
claim, that will be carefully tested in the near future.
Using the theoretical framework provided in Nicolis et al. (2006) we check numerically the behavior of maps described in eq. 49-50 analysing EV distributions for observable functions.
Proceeding as in section 3 for mixing maps, we try to perform a fit to GEV distribution starting with different initial conditions , a set of different values and combinations. In all cases analysed the Kolmogorov Smirnov test fails and this means that GEV distribution is not useful to describe the behavior of this kind of statistics. This result is in agreement with Freitas et al. (2010b) but we may find out which kind of empirical distribution is obtained.
Looking in details at histograms that correspond to empirical density distributions, they appear always to be multi modal and each mode have a well defined shape: for type observable function modes are exponential while, for and , their shape depends on value of observable function. Furthermore, the number of modes and their positions are highly dependent on both and initial conditions.
Using Nicolis et al. (2006) results it is possible to understand why we obtain this kind of histograms: since density distribution of is a composition of box functions, when we apply observables we modulate it changing the shape of the boxes. Therefore, we obtain a multi modal distribution modified according to the observable functions .
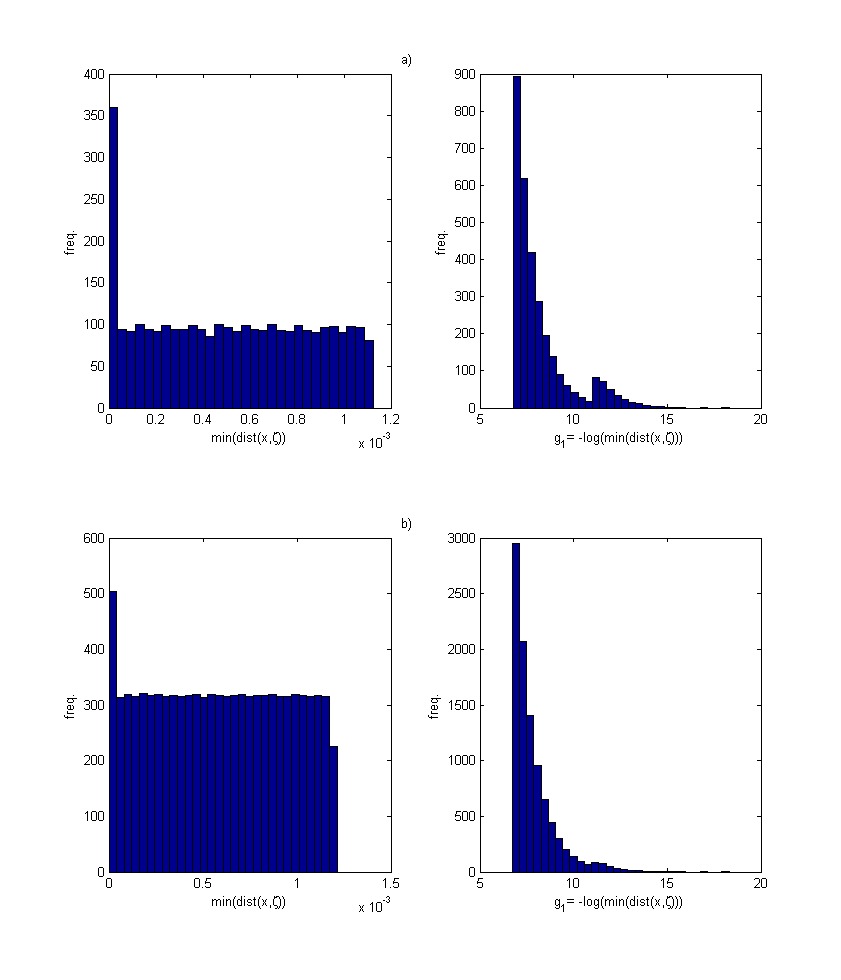
An example is shown in figure 8 for standard map: the left figures correspond to the histogram of the minimum distance obtained without computing observable and reproduce a composition of box functions. The figures in the right show how this distribution is modified by applying observable to the series of minimum distances. We can see two exponential modes, while the third is hidden in the linear scale but can be highlighted using a log-scale. The upper figures are drawn using , , the lower with , .
6 Concluding Remarks
EVT was developed to study a wide class of problems of great interest in different disciplines: the need of modeling events that occur with very small probability comes from the fact that they can affect in a strong way several socioeconomic activities: floods, insurance losses, earthquakes, catastrophes. A very extensive account of EVT applications has been recently given in Ghil et al. (2011). EVT was applied on limited data series using the block-maxima approach facing the problem of having a good statistics of extreme values retaining a sufficient number of observation in each bin. Often, since no theoretical a priori values of GEV parameters are available for this kind of applications, we may obtain a biased fit to GEV distribution even if tests of statistical significance succeed. The recent development of an extreme value theory in dynamical systems give us the theoretical framework to test the consistency of block-maxima approach when analytical results for distribution parameters are available. This theory relies on the global properties of the dynamical systems considered (such as the degree of mixing or the decay rate of the Hitting Time Statistics) but also on the observable functions we chose.
Our main finding is that a block-maxima approach for GEV distribution is totally equivalent to fit an EV distribution after normalising sequences are computed. To prove this we have derived analytical expressions for and normalising sequences, showing that and of fitted GEV distribution can replace them. This approach works for maps that have an absolutely continuous invariant measure and retain some mixing properties that can be directly related to the exponential decay of HTS.
Since GEV approach does not require the a-priori knowledge of the measure density that is instead require by the EV approach, it is possible to use it in many numerical applications.
Furthermore, if we compare analytical and numerical results we can study what is the minimum number of maxima and how big the set of observations in which the maximum is taken has to be. To accomplish this goal we have analysed maps with constant density measure finding that a good agreement between numerical and analytical value is achieved when both the number of maxima and the observations per bin are at least . We remark that the fits have passed Kolmogorov Smirnov test with maximum confidence interval even if or so that parametric or non parametric tests are not the only thing to take in account when dealing with extreme value distributions: if maxima are not proper extreme values (which means is not large enough) the fit is good but parameters are different from expected values. The lower bound of can be explained using the argument that a fit to a 3-parameters distribution needs at least independent data to give reliable informations.
Therefore, we checked that in case of non-constant absolutely continuous density measure the asymptotic expressions used to compute and works when we consider and of order . For logistic map the numerical values of parameters we obtain averaging over different initial conditions are totally in agreement with the theoretical ones.
In regular maps, as expected, the fit to a GEV distribution is unreliable. We obtain a multi modal distribution, that, for the analyzed maps, is the result of a composition of modes in which the shape depends on observable types. This behavior can be explained pointing out that this kind of systems have not an exponential HTS decay and therefore have no EV law for observables of type .
To conclude, we claim that we have provided a reliable way to investigate properties of extreme values in mixing dynamical systems which may satisfy mixing conditions (like and ), finding an equivalence among , , and behavior for absolutely continuous measures. In our future work we intend to address the case of singular measure. Recently the theorem was generalised to the case of non smooth observations and therefore it holds also with non absolutely continuous invariant probability measure (Freitas et al., 2010b). In this case we expect the same for all the procedure described here. Understanding the extreme values behavior for singular measures will be crucial to apply proficiently this analysis to operative geophysical models since in these case we are always dealing with singular measures. In this way we will provide a complete tool to study extreme events in complex dynamical systems used in geophysical or financial applications.
7 Acknowledgments
S.V. was supported by the CNRS-PEPS Project Mathematical Methods of Climate Models, and he thanks the GDRE Grefi-Mefi for having supported exchanges with Italy. V.L. and D.F. acknowledge the financial support of the EU FP7-ERC project NAMASTE: Thermodynamics of the Climate System.

References
- Altmann et al. [2006] E.G. Altmann, S. Hallerberg, and H. Kantz. Reactions to extreme events: Moving threshold model. Physica A: Statistical Mechanics and its Applications, 364:435–444, 2006.
- Arnold and Avez [1968] V.I. Arnold and A. Avez. Ergodic problems of classical mechanics. Benjamin New York, 1968.
- Balakrishnan et al. [1995] V. Balakrishnan, C. Nicolis, and G. Nicolis. Extreme value distributions in chaotic dynamics. Journal of Statistical Physics, 80(1):307–336, 1995. ISSN 0022-4715.
- Beirlant [2004] J. Beirlant. Statistics of extremes: theory and applications. John Wiley & Sons Inc, 2004. ISBN 0471976474.
- Bertin [2005] E. Bertin. Global fluctuations and Gumbel statistics. Physical review letters, 95(17):170601, 2005. ISSN 1079-7114.
- Brodin and Kluppelberg [2006] E. Brodin and C. Kluppelberg. Extreme Value Theory in Finance. Submitted for publication: Center for Mathematical Sciences, Munich University of Technology, 2006.
- Buric et al. [2005] N. Buric, A. Rampioni, and G. Turchetti. Statistics of Poincaré recurrences for a class of smooth circle maps. Chaos, Solitons & Fractals, 23(5):1829–1840, 2005.
- Burton [1979] P.W. Burton. Seismic risk in southern Europe through to India examined using Gumbel’s third distribution of extreme values. Geophysical Journal of the Royal Astronomical Society, 59(2):249–280, 1979. ISSN 1365-246X.
- Clusel and Bertin [2008] M. Clusel and E. Bertin. Global fluctuations in physical systems: a subtle interplay between sum and extreme value statistics. International Journal of Modern Physics B, 22(20):3311–3368, 2008. ISSN 0217-9792.
- Coelho and De Faria [1996] Z. Coelho and E. De Faria. Limit laws of entrance times for homeomorphisms of the circle. Israel Journal of Mathematics, 93(1):93–112, 1996. ISSN 0021-2172.
- Coles et al. [1999] S. Coles, J. Heffernan, and J. Tawn. Dependence measures for extreme value analyses. Extremes, 2(4):339–365, 1999. ISSN 1386-1999.
- Collet [2001] P. Collet. Statistics of closest return for some non-uniformly hyperbolic systems. Ergodic Theory and Dynamical Systems, 21(02):401–420, 2001.
- Cornell [1968] C.A. Cornell. Engineering seismic risk analysis. Bulletin of the Seismological Society of America, 58(5):1583, 1968. ISSN 0037-1106.
- Cruz [2002] M.G. Cruz. Modeling, measuring and hedging operational risk. John Wiley & Sons, 2002. ISBN 0471515604.
- Dahlstedt and Jensen [2001] K. Dahlstedt and H.J. Jensen. Universal fluctuations and extreme-value statistics. Journal of Physics A: Mathematical and General, 34:11193, 2001.
- Davison [1984] A.C. Davison. Modelling excesses over high thresholds, with an application. Statistical Extremes and Applications, pages 461–482, 1984.
- Davison and Smith [1990] AC Davison and R.L. Smith. Models for exceedances over high thresholds. Journal of the Royal Statistical Society. Series B (Methodological), 52(3):393–442, 1990. ISSN 0035-9246.
- Embrechts et al. [1999] P. Embrechts, S.I. Resnick, and G. Samorodnitsky. Extreme value theory as a risk management tool. North American Actuarial Journal, 3:30–41, 1999. ISSN 1092-0277.
- Felici et al. [2007a] M. Felici, V. Lucarini, A. Speranza, and R. Vitolo. Extreme Value Statistics of the Total Energy in an Intermediate Complexity Model of the Mid-latitude Atmospheric Jet. Part I: Stationary case.(3337K, PDF). Journal of Atmospheric Science, 64:2137–2158, 2007a.
- Felici et al. [2007b] M. Felici, V. Lucarini, A. Speranza, and R. Vitolo. Extreme value statistics of the total energy in an intermediate complexity model of the mid-latitude atmospheric jet. Part II: trend detection and assessment. Journal of Atmospheric Science, 64:2159–2175, 2007b.
- Fisher and Tippett [1928] RA Fisher and LHC Tippett. Limiting forms of the frequency distribution of the largest or smallest member of a sample. In Proceedings of the Cambridge philosophical society, volume 24, page 180, 1928.
- Freitas and Freitas [2008a] A.C.M. Freitas and J.M. Freitas. On the link between dependence and independence in extreme value theory for dynamical systems. Statistics & Probability Letters, 78(9):1088–1093, 2008a. ISSN 0167-7152.
- Freitas and Freitas [2008b] A.C.M. Freitas and J.M. Freitas. On the link between dependence and independence in extreme value theory for dynamical systems. Statistics & Probability Letters, 78(9):1088–1093, 2008b.
- Freitas et al. [2009] A.C.M. Freitas, J.M. Freitas, and M. Todd. Hitting time statistics and extreme value theory. Probability Theory and Related Fields, pages 1–36, 2009.
- Freitas et al. [2010a] A.C.M. Freitas, J.M. Freitas, and M. Todd. Extremal index, hitting time statistics and periodicity. Arxiv preprint arXiv:1008.1350, 2010a.
- Freitas et al. [2010b] A.C.M. Freitas, J.M. Freitas, and M. Todd. Extreme value laws in dynamical systems for non-smooth observations. Journal of Statistical Physics, pages 1–19, 2010b.
- Ghil et al. [2011] M. Ghil et al. Extreme events: Dynamics, statistics and prediction. Non Linear process in Geophysics, in press, 2011.
- Gilli and Këllezi [2006] M. Gilli and E. Këllezi. An application of extreme value theory for measuring financial risk. Computational Economics, 27(2):207–228, 2006. ISSN 0927-7099.
- Gnedenko [1943] B. Gnedenko. Sur la distribution limite du terme maximum d’une série aléatoire. The Annals of Mathematics, 44(3):423–453, 1943.
- Gumbel [1941] EJ Gumbel. The return period of flood flows. The Annals of Mathematical Statistics, 12(2):163–190, 1941. ISSN 0003-4851.
- Gupta [2010] C. Gupta. Extreme-value distributions for some classes of non-uniformly partially hyperbolic dynamical systems. Ergodic Theory and Dynamical Systems, 30(03):757–771, 2010.
- Gupta et al. [2009] C. Gupta, M. Holland, and M. Nicol. Extreme value theory for dispersing billiards and a class of hyperbolic maps with singularities. Preprint, 2009.
- Haiman [2003] G. Haiman. Extreme values of the tent map process. Statistics & Probability Letters, 65(4):451–456, 2003. ISSN 0167-7152.
- Hallerberg and Kantz [2008] S. Hallerberg and H. Kantz. Influence of the event magnitude on the predictability of an extreme event. Physical Review E, 77(1):11108, 2008. ISSN 1550-2376.
- Hasselblatt and Katok [2003] B. Hasselblatt and AB Katok. A first course in dynamics: with a panorama of recent developments. Cambridge Univ Pr, 2003.
- Hill [1975] B.M. Hill. A simple general approach to inference about the tail of a distribution. The Annals of Statistics, 3(5):1163–1174, 1975. ISSN 0090-5364.
- Holland et al. [2008] M. Holland, M. Nicol, and A. Török. Extreme value distributions for non-uniformly hyperbolic dynamical systems. preprint, 2008.
- Hu et al. [2004] H. Hu, A. Rampioni, L. Rossi, G. Turchetti, and S. Vaienti. Statistics of Poincaré recurrences for maps with integrable and ergodic components. Chaos: An Interdisciplinary Journal of Nonlinear Science, 14:160, 2004.
- Kantz et al. [2006] H. Kantz, E. Altmann, S. Hallerberg, D. Holstein, and A. Riegert. Dynamical interpretation of extreme events: predictability and predictions. Extreme events in nature and society, pages 69–93, 2006.
- Katz [1999] RW Katz. Extreme value theory for precipitation: Sensitivity analysis for climate change. Advances in Water Resources, 23(2):133–139, 1999. ISSN 0309-1708.
- Katz and Brown [1992] R.W. Katz and B.G. Brown. Extreme events in a changing climate: variability is more important than averages. Climatic change, 21(3):289–302, 1992. ISSN 0165-0009.
- Katz et al. [2005] R.W. Katz, G.S. Brush, and M.B. Parlange. Statistics of extremes: Modeling ecological disturbances. Ecology, 86(5):1124–1134, 2005. ISSN 0012-9658.
- Leadbetter et al. [1983] MR Leadbetter, G. Lindgren, and H. Rootzen. Extremes and related properties of random sequences and processes. Springer, New York, 1983.
- Lilliefors [1967] H.W. Lilliefors. On the Kolmogorov-Smirnov test for normality with mean and variance unknown. Journal of the American Statistical Association, 62(318):399–402, 1967. ISSN 0162-1459.
- Longin [2000] F.M. Longin. From value at risk to stress testing: The extreme value approach. Journal of Banking & Finance, 24(7):1097–1130, 2000. ISSN 0378-4266.
- Martinez and Martinez [2002] W.L. Martinez and A.R. Martinez. Computational statistics handbook with MATLAB. CRC Press, 2002.
- Martins and Stedinger [2000] E.S. Martins and J.R. Stedinger. Generalized maximum-likelihood generalized extreme-value quantile estimators for hydrologic data. Water Resources Research, 36(3):737–744, 2000. ISSN 0043-1397.
- Moreira Freitas and Freitas [2008] A.C. Moreira Freitas and J.M. Freitas. Extreme values for Benedicks–Carleson quadratic maps. Ergodic Theory and Dynamical Systems, 28(04):1117–1133, 2008. ISSN 0143-3857.
- Nicholis [1997] N. Nicholis. CLIVAR and IPCC interests in extreme events’. In Workshop Proceedings on Indices and Indicators for Climate Extremes, Asheville, NC. Sponsors, CLIVAR, GCOS and WMO, 1997.
- Nicolis et al. [2006] C. Nicolis, V. Balakrishnan, and G. Nicolis. Extreme events in deterministic dynamical systems. Physical review letters, 97(21):210602, 2006. ISSN 1079-7114.
- P. and Hense [2007] Friederichs P. and A. Hense. Statistical downscaling of extreme precipitation events using censored quantile regression. Monthly weather review, 135(6):2365–2378, 2007. ISSN 0027-0644.
- Pickands III [1968] J. Pickands III. Moment convergence of sample extremes. The Annals of Mathematical Statistics, 39(3):881–889, 1968.
- Pickands III [1975] J. Pickands III. Statistical inference using extreme order statistics. the Annals of Statistics, pages 119–131, 1975. ISSN 0090-5364.
- Smith [1984] R.L. Smith. Threshold methods for sample extremes. Statistical extremes and applications, 621:638, 1984.
- Smith [1989] R.L. Smith. Extreme value analysis of environmental time series: an application to trend detection in ground-level ozone. Statistical Science, 4(4):367–377, 1989. ISSN 0883-4237.
- Sornette et al. [1996] D. Sornette, L. Knopoff, YY Kagan, and C. Vanneste. Rank-ordering statistics of extreme events: application to the distribution of large earthquakes. Journal of Geophysical Research, 101(B6):13883, 1996. ISSN 0148-0227.
- Sveinsson and Boes [2002] O.G.B. Sveinsson and D.C. Boes. Regional frequency analysis of extreme precipitation in northeastern colorado and fort collins flood of 1997. Journal of Hydrologic Engineering, 7:49, 2002.
- Todorovic and Zelenhasic [1970] P. Todorovic and E. Zelenhasic. A stochastic model for flood analysis. Water Resources Research, 6(6):1641–1648, 1970. ISSN 0043-1397.
- Vannitsem [2007] S. Vannitsem. Statistical properties of the temperature maxima in an intermediate order Quasi-Geostrophic model. Tellus A, 59(1):80–95, 2007. ISSN 1600-0870.
- Vitolo et al. [2009a] R. Vitolo, M.P. Holland, and C.A.T. Ferro. Robust extremes in chaotic deterministic systems. Chaos: An Interdisciplinary Journal of Nonlinear Science, 19:043127, 2009a.
- Vitolo et al. [2009b] R. Vitolo, PM Ruti, A. Dell’Aquila, M. Felici, V. Lucarini, and A. Speranza. Accessing extremes of mid-latitudinal wave activity: methodology and application. Tellus A, 61(1):35–49, 2009b. ISSN 1600-0870.
- Young [1998] L.S. Young. Statistical properties of dynamical systems with some hyperbolicity. The Annals of Mathematics, 147(3):585–650, 1998.
- Young [1999] L.S. Young. Recurrence times and rates of mixing. Israel Journal of Mathematics, 110(1):153–188, 1999.