The spatial distribution and origin of the FUV excess in early-type galaxies
Abstract
We present surface photometry of a sample of 52 galaxies from the GALEX and 2MASS data archives, these include 32 normal elliptical galaxies, 10 ellipticals with weak Liner or other nuclear activity, and 10 star forming ellipticals or early-type spirals. We examine the spatial distribution of the Far Ultra-Violet excess in these galaxies, and its correlation with dynamical and stellar population properties of the galaxies. From aperture photometry we find that all galaxies except for recent major remnants and galaxies with ongoing star formation show a positive gradient in the (FUV-NUV) colour determined from the GALEX images. The logarithmic gradient does not correlate with any stellar population parameter, but it does correlate with the central velocity dispersion. The strength of the excess on the other hand, correlates with both [/Fe] and [Z/H], but more strongly with the former. We derive models of the underlying stellar population from the 2MASS H-band images, and the residual of the image from this model reveals a map of the centrally concentrated FUV excess. We examine a possible hypothesis for generating the FUV excess and the radial gradient in its strength, involving a helium abundance gradient set up early in the formation process of the galaxies. If this hypothesis is correct, the persistence of the gradients to the present day places a strong limit on the importance of dry mergers in the formation of ellipticals.
keywords:
galaxies: stellar content; galaxies: elliptical and lenticular, cD; galaxies: evolution1 Introduction
It has long been known that the spectral energy distributions of bright early-type galaxies have a pronounced upturn at wavelengths shortward of 2100Å (Code & Welch 1979; Brown et al. 1997; O’Connell et al. 1992; O’Connell 1999). This far-UV excess was unexpected as early-type galaxies were believed to contain only old and cold stellar populations. From the shape of the spectral energy distribution in the UV, it appears that the temperature of the stars which give rise to the excess has a narrow range around 20,0003000K (Brown et al. 1997) which rules out upper main sequence stars as an origin. It is believed to be caused instead by hot subdwarfs, also known as extreme horizontal branch (EHB) stars (see Yi 2008 for a review).
A feature of the UV upturn is that it is strongest in the centres of bright elliptical galaxies (O’Connell et al. 1992; 1999). The positive UV colour gradients have been interpreted as abundance gradients, but it is still unclear which abundance or abundances drive these gradients.
Such stars are found in globular clusters, and are generally considered to be helium-core burning stars with extremely thin hydrogen envelopes (). There are a number of competing models for their origin. Han et al. (2002, 2003, 2007) and Han (2008), propose a binary model, in which a star loses all of its envelope near the tip of the red-giant branch (RGB) by mass transfer to a companion star or ejection in a common-envelope phase, or where two helium white dwarfs merge with a combined mass larger than . In each case, the remnant star ignites helium and becomes a hot subdwarf.
A number of single-star mechanisms have been proposed to explain the EHB populations of ellipticals. Park & Lee (1997) find that 20% of the populations are extremely old and metal-poor. This appears to contradict the observed positive correlation between FUV excess and line strength (Burstein et al. 1988). Most attempts to explain the FUV excess, using single stars, are based upon the idea of Greggio & Renzini (1990) that extremely low-mass metal-rich HB stars might skip the AGB phase altogether (“AGB-Manqúe stars”) and move directly to the EHB.
Brown et al. (1997), using Hopkins Ultraviolet Telescope (HUT) spectra found that the spectral energy distributions of the UV excess in the cores of bright ellipticals required both enhanced metallicity and enhanced helium with respect to solar abundances. Dorman et al. (1995) present a range of spectral synthesis models of old stellar populations in which the UV depends largely on the distribution of envelope mass on the Zero Age Horizontal Branch. Yi et al. (1997) present stellar population models with supersolar metallicity and helium abundance, and a high, although ad-hoc, value of the Reimers (1975) mass-loss parameter on the RGB () and show that they can reproduce the UV colours of ellipticals. Observations of a UV-bright Globular Cluster population in M87 (Sohn et al. 2006, Kaviraj et al. 2007) again suggest a helium enhancement. Chuzhoy & Loeb (2004), Peng & Nagai (2009) and others propose further that sedimentation of helium during the formation of clusters and galaxies could lead to enhanced helium in Brightest Cluster Galaxies, which do indeed seem to show the strongest excess (Ree et al 2007). On the other hand Brown et al. (2008) present a UV colour-magnitude diagram (CMD) for M32, and note that it is incompatible with their evolutionary tracks for supersolar helium abundance. However evolutionary tracks on and beyond the RGB depend upon a number of parameters, but most of all upon , whose value, and whose dependence upon other parameters of the population, are poorly understood (Percival & Salaris 2011). Moreover we are hampered by the fact that M32, the one elliptical in which the UV bright stars can be resolved, has a very weak UV upturn when compared with giant ellipticals, and it is unclear that conclusions drawn from its CMD can then be applied to more luminous galaxies.
Evidence that the FUV excess is a phenomenon of the old stellar population is provided by deep HST/STIS ultraviolet observations of ellipticals in the z=0.55 cluster CL0016+16 (Brown et al. 2000a), and the z=0.33 cluster ZwCl1358.1+6245 (Brown et al. 2003), which show that the excess is far weaker at these redshifts. The lookback times to these clusters, 3.7 and 5.4 Gyr respectively, suggest that the strengthening of the FUV occurs in populations older than 10 Gyr. However efforts to use the strength of the excess as an age indicator are complicated by our paucity of observational evidence and lack of theoretical understanding of the dependence of the phenomenon on other parameters of the stellar population (Brown et al. 2008).
Post AGB stars (central stars of Planetary Nebulae) have also been proposed as a possible origin of the FUV excess, but these are too hot to reproduce the observed spectral energy distribution, and in addition observations of M32 do not find them in sufficient numbers (Brown et al. 2000b, 2008).
Metal-poor, AGB-manque and binary star models make different predictions for the dependence of the FUV excess upon stellar population age, metallicity and -enhancement. The single-star models, predict different dependences of the FUV excess on galaxy mass, metal abundance and population age (Yi et al. 1999) whereas in the binary model the excess does not depend strongly on any of these (Han et al. 2007; Lisker & Han 2008). Specifically, in the binary model, all old galaxies should show a UV excess at some level.
The GALaxy Evolution eXplorer (GALEX; Martin et al. 2005) has revolutionised the study of the global UV upturn in galaxies and their associated star clusters. In galaxies it makes a systematic study of the spatial distribution of the FUV excess stars possible. The FUV excess has long been known to be more centrally concentrated in ellipticals that the underlying old, red, population (O’Connell 1999). Gil de Paz et al. (2007) present “The GALEX Ultraviolet atlas of galaxies”, including surface brightness and colour profiles in the GALEX far ultraviolet (FUV) and near ultraviolet (NUV) passbands for a sample of 1034 nearby galaxies. Their (FUV-NUV) colour gradients of bright early-type galaxies confirm the strong negative colour gradients found in earlier data. They also find that elliptical and lenticular galaxies with brighter K-band absolute magnitudes show bluer (FUV-NUV) colours than fainter ones. and they find that (FUV-K) is an excellent discriminant of morphological type.
Donas et al. (2007), using the same data, investigate colour-colour relations, and the relation between (FUV-NUV) and (B-V) colours and the line index. They find a strong negative correlation between the colours (galaxies which are red in B-V are blue in FUV-NUV), and a negative correlation with the line index (galaxies with strong are bluer in (FUV-NUV). Replacing with the velocity dispersion, , gives a very similar result, which is not surprising given the well known correlation between and .
Loubser & Sánchez-Blázquez (2011) analyse the global (FUV-NUV) colours of a sample of Brightest Cluster galaxies (BCGs) and of a control sample of normal ellipticals, from the GALEX database. They examine the differences between BCGs and normal ellipticals, and the dependence of the strength of the global FUV excess upon stellar population parameters. They find that BGCs have stronger UV upturns than normal ellipticals, and with less scatter between them. Surprisingly they find no significant dependence of the strength of the FUV excess upon any stellar population parameter in the BCG sample.
Marino et al. (2011) undertake surface photometry of a sample of gas-rich early type galaxies from GALEX images. They confirm the relation between (FUV-NUV) colour and the central velocity dispersion. Furthermore they investigate the relationship between the Sérsic index , derived in both UV and optical bands, and the stellar population parameters, and find that galaxies with tend to have [/Fe] 0.15, and hence comparatively short star formation timescales.
Jeong et al. (2009) present GALEX surface photometry of a sample of galaxies which are also part of the SAURON survey. Their prime interest was in identifying early-type galaxies with residual star formation, however they do note that their galaxies have predominantly positive (FUV-NUV) colour gradients, and that some of their sample have bluer (FUV-NUV) at small radii than the global values for classic FUV excess galaxies.
In this paper we use GALEX archive data, some of which is more recent and deeper than the data available to Gil de Paz et al. (2007) and Donas et al. (2007), to investigate the spatial distribution of the UV excess, and to see how its properties depend upon other properties of the galaxies. In Section 2 we describe our sample and briefly present the data used, which consists of archive data from GALEX and the 2-Micron All-Sky Survey (2MASS). In Subsection 3.1 we describe the measurement of annular colours using circular apertures, and present colour gradients for our sample. In Subsection 3.2 we describe how we use the galaxy surface brightness fitting programme Galfit (Peng et al. 2002, 2010) to model the surface brightness profile in UV passbands, to provide more robust global colours and magnitudes than the GALEX database values. In Subsection 3.3 we examine the dependence of the colourgradients upon other properties of the galaxies, and in Subsection 3.4 we examine their dependence upon the stellar population parameters of the galaxies. In Subsection 3.5 we investigate the correlation between the derived Sérsic index and the stellar population parameters, suggested by Marino et al. (2011). In Subsection 3.6 we use the Galfit fits to the 2MASS and GALEX data to create residual images mapping the FUV excess, and we examine and spatial extent of the UV excess upon other properties of the galaxies. Finally in Section 5 we present our conclusions.
2 Input Data
2.1 GALEX UltraViolet data
GALEX is a 50cm aperture space telescope optimised for imaging in the range 1344 - 2832 Å. It also has a grism for low resolution spectroscopy, although we do not use any spectroscopic data in this study. The beam is split by a dichroic filter into two wavebands, 1344 - 1786 Å (designated FUV) and 1771 - 2831 Å (designated NUV). Details of the instrument, its mission and performance are given by Martin et al. (2005), Morrissey et al. (2005), and at the GALEX website111http://www.galex.caltech.edu/researcher/techdocs.html.
We recovered the majority of our data from the NASA MAST GR5 data archive222http://galex.stsci.edu/GR4/. The exceptions were NGC4486 (M87) for which the GR5 data were not available and for which we obtained the data later from the GR6 website333http://galex.stsci.edu/GR6/, and the central Coma cluster galaxies NGC4874 and NGC4889, which were observed as part of programme GI5_025 (PI: Smith).
Our main sample consists of 29 passive E and cD type galaxies for which and for which GALEX exposures of 700 seconds duration in the FUV band were available and the 3 brightest E/cD galaxies in Coma, NGC4874, NGC4839 and NGC4889, which are fainter than our nominal magnitude limit but for which very deep GALEX exposures exist.
Although the conclusions of this paper are largely based upon this sample of 32 galaxies, we present and plot the results for two separate and contrasting samples for comparison. The first is a sample of 10 E and cD galaxies for which there is evidence some evidence of nuclear activity, as noted in the NASA/IPAC Extragalactic Database (NED)444http://nedwww.ipac.caltech.edu/. These galaxies range from the very strongly active NGC4486, to weak liners and low-luminosity AGN, including NGC4374 and NGC 4552. The other is a sample of 10 galaxies with elliptical morphology but which are given the type S0, SA0 or SAB0 in RC3 (De Vaucouleurs et al. 1991) and therefore in NED. The reasons for this classification are either the presence of dust lanes, shell structure, or star formation regions (or in some cases all three). We keep the three samples separate in our analysis.
| Galaxy | Type | Distance | GALEX Dataset | NUV | FUV | |
| Modulus | exposure (s) | exposure(s) | ||||
| Passive E and cD galaxies | ||||||
| NGC 584 | E4 | 31.44 | 10.30 | NGA_NGC0584 | 1697 | 1697 |
| NGC 596 | cDpec | 31.56 | 10.80 | NGA_NGC0584 | 1697 | 1697 |
| NGC 720 | E5 | 31.88 | 10.17 | HRC_RXJ0152m1357 | 57037 | 55734 |
| NGC 1374 | E | 31.42 | 11.10 | UVE_FORNAX | 34815 | 33787 |
| NGC 1379 | E | 31.29 | 10.99 | UVE_FORNAX | 34815 | 33787 |
| NGC 1399 | cD | 31.36 | 9.49 | UVE_FORNAX | 34815 | 33787 |
| NGC 1404 | E1 | 31.33 | 10.03 | UVE_FORNAX | 34815 | 33787 |
| NGC 1407 | E0 | 31.85 | 9.74 | NGA_NGC1407 | 1557 | 1557 |
| NGC 1549 | E0-1 | 31.04 | 9.76 | NGC_NGC1546 | 2011 | 2011 |
| NGC 3258 | E1 | 33.01 | 11.30 | GI3_087006_NGC3268 | 2223 | 2223 |
| NGC 3268 | E2 | 33.02 | 11.30 | GI3_087006_NGC3268 | 2223 | 2223 |
| NGC 3377 | E5-6 | 30.14 | 10.23 | GI3_084014_J104728p135322 | 1645 | 1645 |
| NGC 3379 | E1 | 30.36 | 9.24 | GI4_042055_J104657p125223 | 1153 | 1153 |
| NGC 3608 | E2 | 31.87 | 10.76 | GI3_079016_NGC3608 | 2468 | 2468 |
| NGC 3923 | E4-5 | 31.57 | 9.69 | NGA_NGC3923 | 3019 | 2269 |
| NGC 3962 | E1 | 32.38 | 10.67 | GI3_087006_NGC3962 | 2098 | 2098 |
| NGC 4365 | E3 | 31.63 | 9.54 | GI2_125012_AGESstrip1_12 | 4523 | 1580 |
| NGC 4406 | E3 | 31.04 | 8.84 | NGA_VIRGO_MOS10 | 3108 | 1580 |
| NGC 4473 | E5 | 31.00 | 10.11 | NGA_VIRGO_MOS09 | 4521 | 1387 |
| NGC 4621 | E5 | 31.01 | 9.61 | GI3_041008_NGC4621 | 1658 | 1658 |
| NGC 4649 | E2 | 31.09 | 8.75 | GI3_041008_NGC4621 | 1658 | 1658 |
| NGC 4697 | E6 | 30.25 | 9.18 | GI4_085003_NGC4697 | 1696 | 1696 |
| NGC 4839 | cD | 34.88 | 11.95 | GI2_046001_COMA3 | 31165 | 29997 |
| NGC 4874 | cD0 | 34.97 | 11.73 | GI5_025001_COMA | 14692 | 13588 |
| NGC 4889 | E4 | 34.88 | 11.37 | GI5_025001_COMA | 14692 | 13588 |
| NGC 5044 | E0 | 32.64 | 11.03 | GI3_087011_NGC5044 | 1696 | 1696 |
| NGC 5813 | E1-2 | 32.39 | 10.48 | NGA_NGC5813 | 693 | 693 |
| NGC 5831 | E3 | 32.22 | 11.39 | GI1_109008_NGC5831 | 5325 | 2368 |
| NGC 5846 | E0-1 | 32.13 | 9.95 | NGA_NGC5846 | 1117 | 1117 |
| NGC 5982 | E3 | 33.07 | 11.17 | GI1_109009_NGC5982 | 3586 | 1567 |
| NGC 6868 | E2 | 32.41 | 10.54 | ABELL_S0851_NGC6868 | 6417 | 2375 |
| NGC 6958 | cD | 32.59 | 11.28 | NGA_NGC6958 | 3094 | 3094 |
| Liners and other weak AGN | ||||||
| NGC 1052 | E4 | 31.46 | 10.44 | NGC_NGC1052 | 3800 | 2967 |
| NGC 2768 | E6 | 31.49 | 9.78 | NGA_NGC2768 | 1647 | 1647 |
| NGC 4261 | E2-3 | 32.53 | 10.39 | GI3_079021_NGC4261 | 1645 | 1645 |
| NGC 4278 | E1-2 | 30.85 | 10.07 | NGC_NGC4278 | 1481 | 1481 |
| NGC 4374 | E1 | 31.19 | 9.07 | NGA_VIRGO_MOS10 | 3108 | 1580 |
| NGC 4486 | cDpec | 31.10 | 8.56 | GI1_077011_TYC8775461 | 1702 | 1702 |
| NGC 4552 | E0-1 | 30.96 | 9.63 | NGA_VIRGO_MOS03 | 4762 | 1598 |
| NGC 4589 | E2 | 32.27 | 10.75 | GI3_079022_NGC4589 | 3400 | 3399 |
| IC 1459 | E3-4 | 32.14 | 9.88 | GI1_093001_IC1459 | 1677 | 1677 |
| IC 4296 | E0 | 33.46 | 10.47 | GI3_087015_IC4296 | 3365 | 1701 |
| Starforming galaxies and early-type spirals | ||||||
| NGC 474 | SA0 | 32.44 | 11.15 | NGRG_A227 | 2708 | 2708 |
| NGC 1316 | SAB0pec | 31.41 | 8.53 | NGA_NGC1316 | 1702 | 1702 |
| NGC 1387 | SAB0 | 31.26 | 10.72 | UVE_FORNAX | 34815 | 33787 |
| NGC 1389 | SAB0 | 31.16 | 11.54 | UVE_FORNAX | 34815 | 33787 |
| NGC 1400 | SA0 | 31.73 | 10.97 | NGA_NGC1407 | 1557 | 1557 |
| NGC 1553 | SA0 | 30.68 | 9.39 | NGA_NGC1546 | 2011 | 2011 |
| NGC 2865 | E3-4 | 32.40 | 11.36 | GI1_059003_NGC2865 | 16251 | 2560 |
| NGC 3115 | S0 | 29.99 | 8.80 | NGA_NGC3115 | 1304 | 1304 |
| NGC 3384 | SB0 | 30.29 | 9.84 | GI4_042055_J104657p125223 | 1153 | 1153 |
| NGC 4459 | SA0 | 31.11 | 10.29 | GI1_109010_NGC4459 | 1593 | 1593 |
Our reductions all assume the GR5 zero points for the data, which are 18.82 mag in FUV and 20.08 mag in NUV. No linearity corrections were applied to the data, and our error analyses include only Poisson noise from sources and background (whether sky or detector background). The pixel size is 1.5 arcsec square.
2.2 InfraRed data
InfraRed data for the galaxies listed in Table 1 was obtained from the Interactive 2MASS (Skrutskie et al. 2006) image server555http://irsa.ipac.caltech.edu/applications/2MASS/IM/interactive.html. 2MASS Atlas images, rather than Quicklook images were used for our photometric analysis. However for the Galfit analysis described in Section 3.2, the galaxies were often close to the edges of the frames, which compromised the fits. For the larger galaxies we therefore used images from the 2MASS Large Galaxy Atlas (Jarrett et al. 2003) for the Galfit fits. 2MASS Atlas images are presented with a pixel scale of 1 arcsec/pixel, but are resampled from 2 arcsec pixel scans.
3 Results
Our results, and properties determined from external sources, are summarised in Table 2. In this Table, data presented in columns 3-8 are determined in this study; the absolute magnitude given in column 2 comes from the extinction corrected apparant V-band magnitude and distance modulus given in NED; the velocity dispersion comes from various sources listed in Hyperleda666http://leda.univ-lyon1.fr/ as described in the text, and the stellar population parameters given in columns 9-11 come from the source indicated in column 12, the key to the references is given in the table caption.
3.1 Aperture photometry
Aperture photometry was carried out in a range of circular apertures, of radius 3.0, 5.0, 8.0, 10.0, 15.0, 20.0, 30.0, 40.0 and 55.0 arcsec, using the IRAF task PHOT. As described by Carter et al. (2009), we determined the sky background in a number (8-12) of circular apertures located away from the galaxies and in regions free from stars. Following Gil de Paz et al. (2007), we use an unclipped mean as the background measurement for the UV images, as the statistics are poissonian and in many pixels in the FUV images the background is zero. The centroid of the galaxy was determined within PHOT. Surface brightnesses within circular annuli were determined from the differences between intensities within apertures. Intensity and magnitude errors were calculated as described by Carter et al. (2009). Statistical errors from the image and background were taken from count statistics alone in the case of GALEX, and calculated according to the prescription presented on the 2MASS website777http://www.ipac.caltech.edu/2mass/releases/allsky/doc/sec6_8a.html in the case of 2MASS. To these were added a measurement repeatability error determined from four separate measurements. As the main focus of this paper is colour gradients and differences, no zero point errors were included. Surface brightness errors were obtained by adding in quadrature the intensity errors derived from two apertures which were subtracted.
Foreground stars contaminated a small number of annuli, the intensities of these were measured in 3 arcsec radius apertures, for both GALEX and 2MASS images, and they were subtracted. No corrections were made for the ellipticity of the galaxies, or for the different point spread functions of the images. Corrections for galactic extinction are taken from the values of Schlegel et al. (1998) as tabulated in NED888http://nedwww.ipac.caltech.edu, and from the relationships between E(B-V) and the extinction in the GALEX bands given by Wyder et al. (2005).
3.1.1 The effect of the Point Spread Function
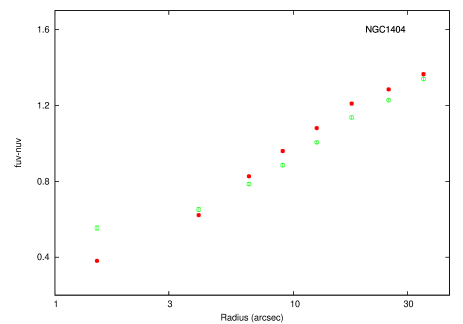
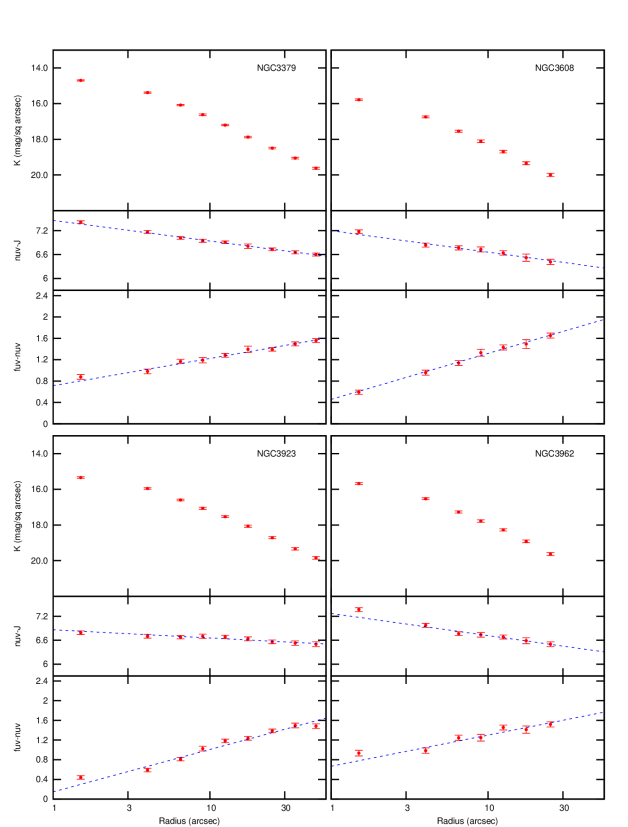
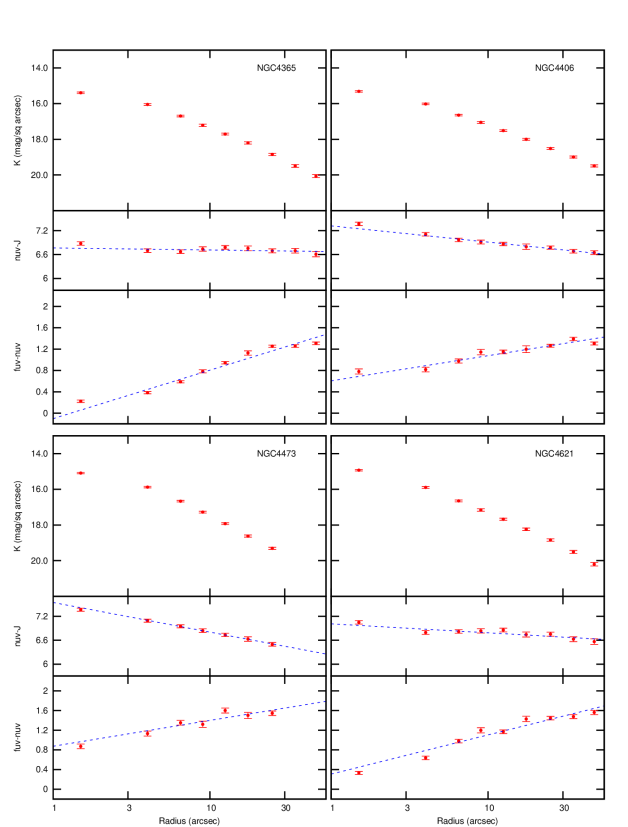
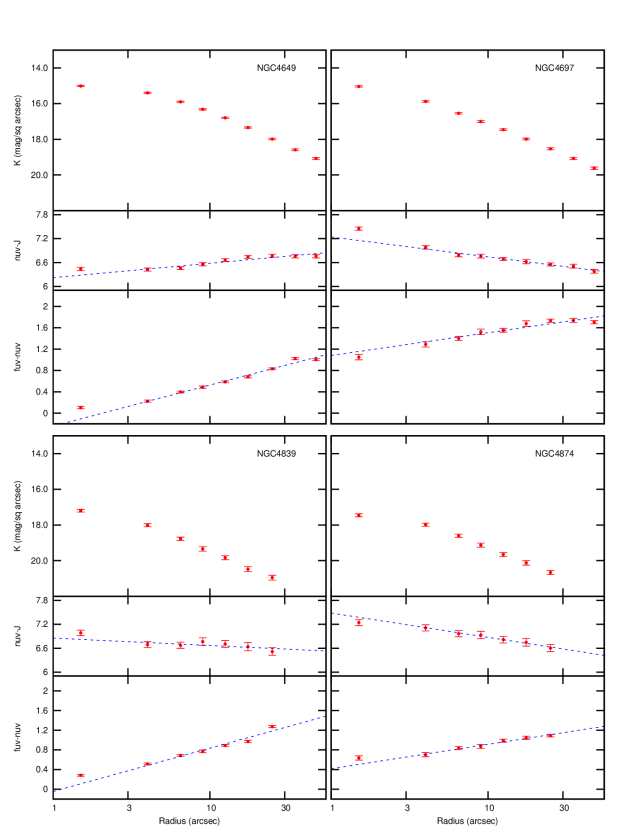
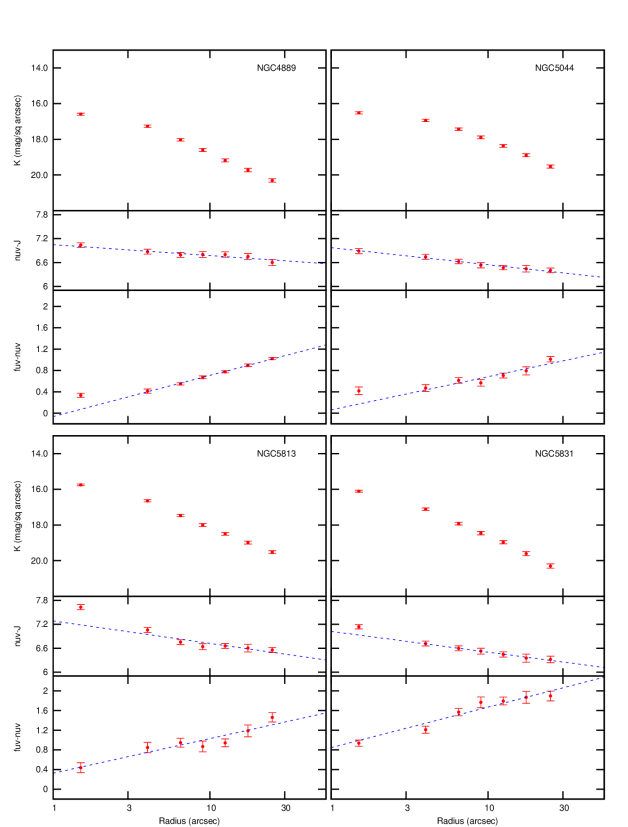
The Point Spread Function (PSF) differs between the two GALEX bands, and in the 2MASS bands it varies from image to image. In order to assess the effect of differences in the PSF on the (FUV-NUV) gradient in particular, we test the effect of matching the resolutions by convolving the Fornax cluster FUV image with the NUV PSF, and the NUV image with the FUV psf. In Figure 1 we show the (FUV-NUV) colour profile of NGC1404 as determined from the unconvolved images (open circles) and the images convolved to match the psf (filled squares). Based upon this plot, for each galaxy we measure the logarithmic colour gradients, and , which are the the slopes of the least squares regression lines of (FUV-NUV) and (NUV-J) repectively upon , but in each fit we omit the colour in the central circular aperture. Besides the effect of the different PSFs on this aperture, it is potentially affected by non-stellar emission from the nucleus. Apart from omitting the central aperture we make no correction for the differing PSFs. These gradients are presented in Table 2 and discussed in Section 3.3.
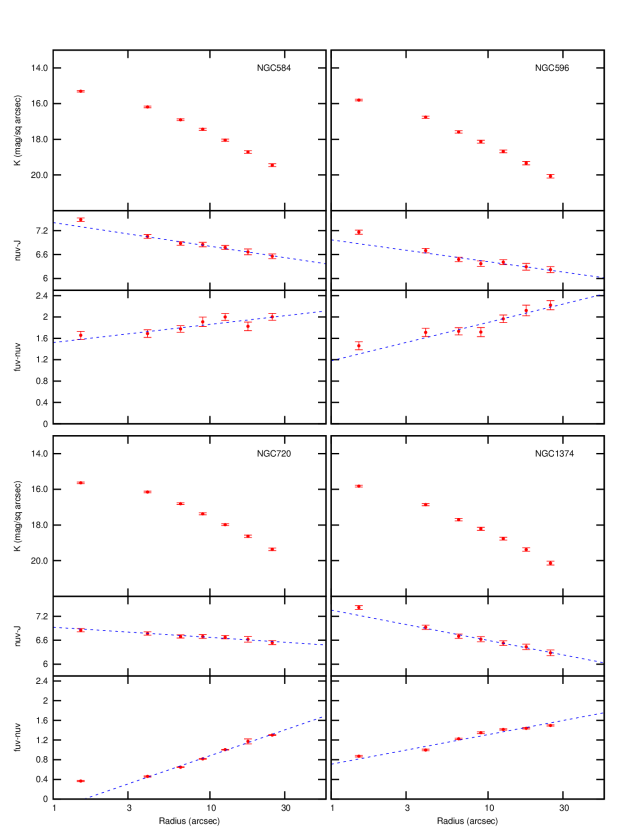
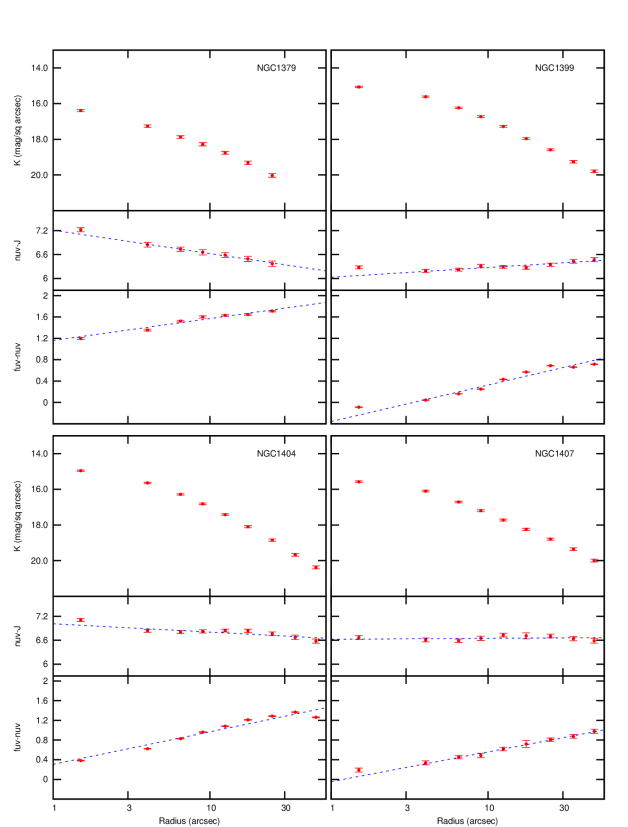
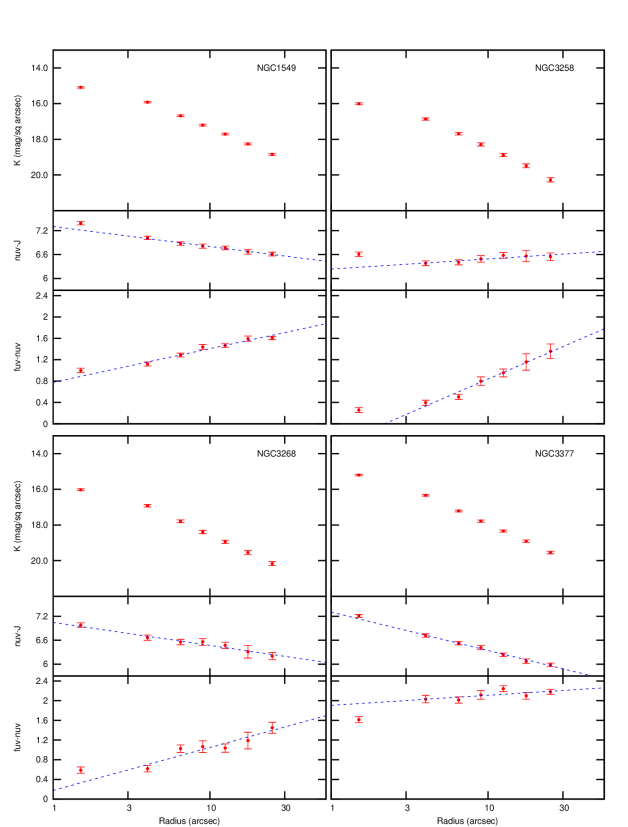
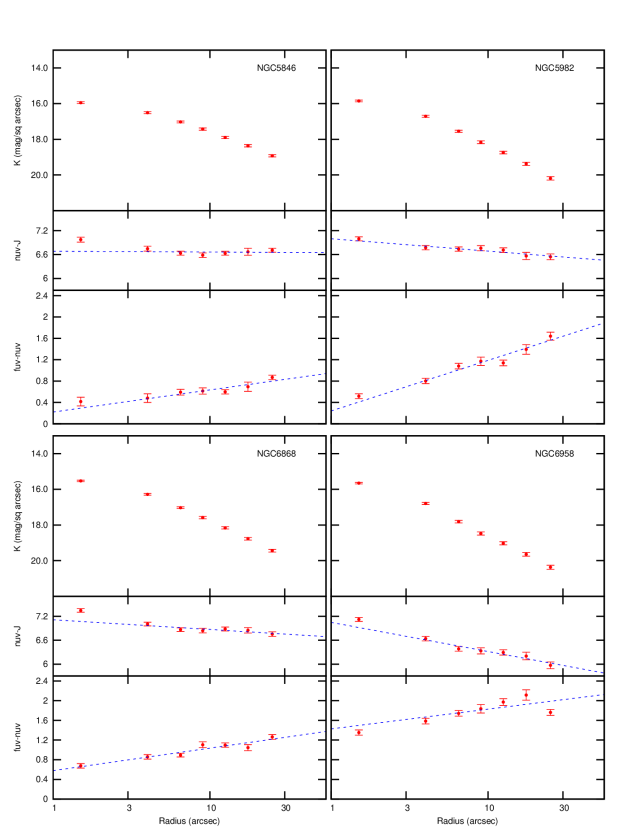
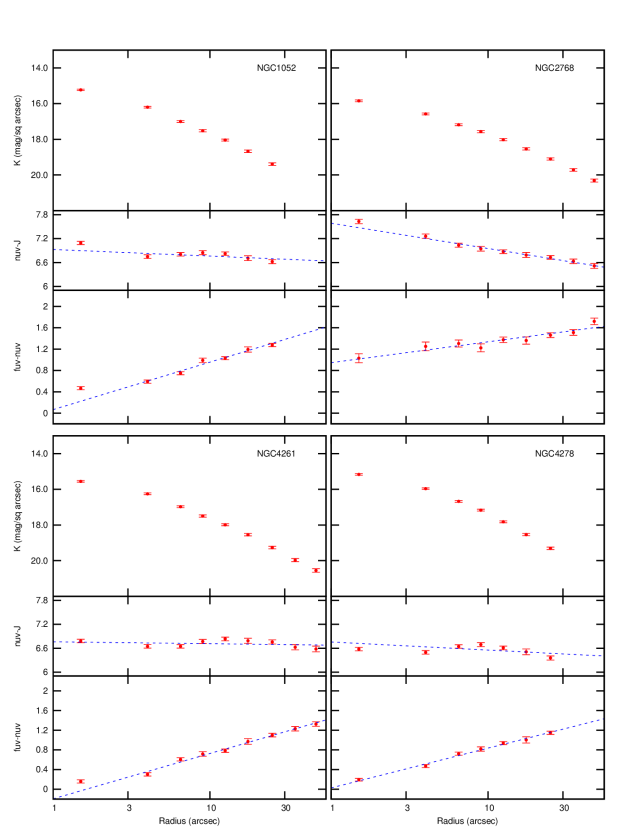
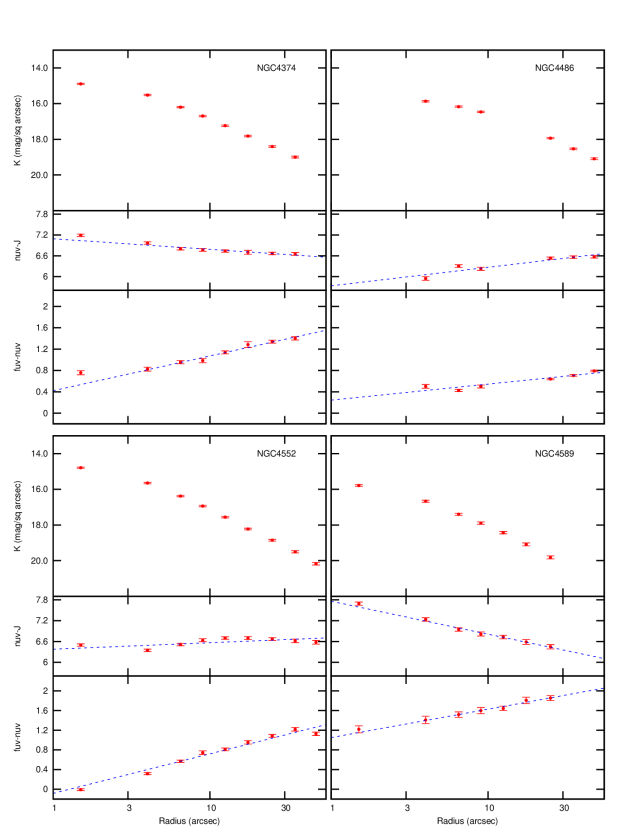
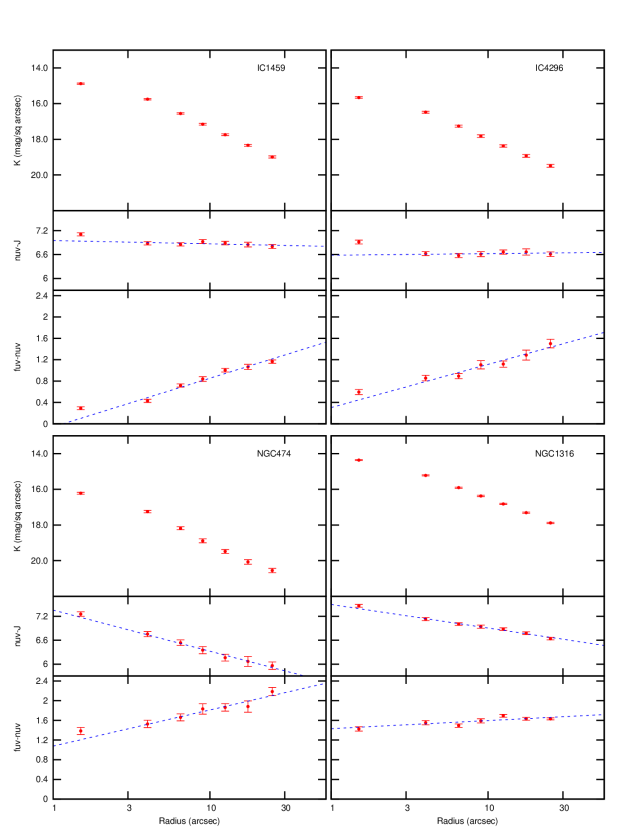
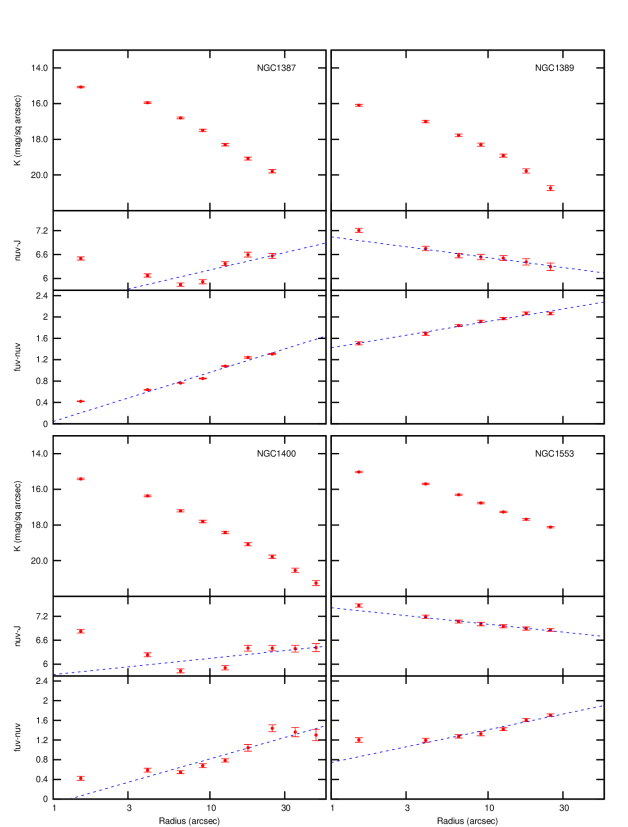
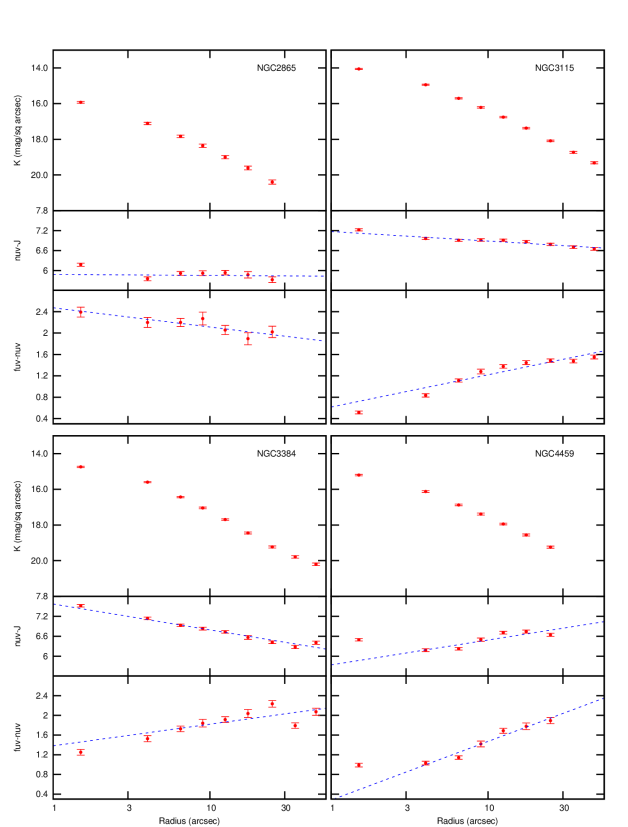
In Figures A1 to A13, of Appendix A, presented in the online version of the paper only, we show surface brightness and colour profiles for our samples. All photometry is corrected for galactic extinction as discussed above. All galaxies apart from NGC2865 show positive gradients in (FUV-NUV). Also plotted on the individual panels of the figures in the online version of Appendix A are the fits, showing the gradient from Table 2.
| Galaxy | N0 | (F-N) | (F-N) | (N-H)0 | Log | [Z/H] | [/Fe] | Ref | |||
|---|---|---|---|---|---|---|---|---|---|---|---|
| NGC 584 | 21.14 | 15.75 | 2.44 | 1.760.08 | 6.90 | 0.340.14 | -0.590.04 | 2.3300.015 | 0.350.09 | 0.160.02 | 1,6 |
| NGC 596 | 20.76 | 15.96 | 2.62 | 1.600.07 | 6.57 | 0.720.15 | -0.550.09 | 2.2090.011 | 0.190.07 | 0.090.03 | 1,5,6 |
| NGC 720 | 21.71 | 15.44 | 1.31 | 0.490.01 | 6.81 | 1.100.04 | -0.260.04 | 2.3930.009 | 0.390.07 | 0.340.02 | 1,6 |
| NGC 1374 | 20.32 | 15.95 | 1.70 | 0.980.03 | 6.37 | 0.600.10 | -0.760.04 | 2.2380.011 | |||
| NGC 1379 | 20.30 | 15.94 | 1.85 | 1.380.01 | 6.78 | 0.410.07 | -0.590.03 | 2.0900.013 | -0.130.05 | 0.300.01 | 1 |
| NGC 1399 | 21.87 | 14.59 | 0.54 | 0.070.03 | 6.77 | 0.680.07 | 0.250.04 | 2.5250.009 | 0.440.06 | 0.400.03 | 1,7 |
| NGC 1404 | 21.30 | 15.22 | 1.28 | 0.490.01 | 6.94 | 0.660.09 | -0.210.06 | 2.3780.008 | |||
| NGC 1407 | 22.11 | 15.06 | 1.31 | 0.410.02 | 6.99 | 0.600.02 | 0.030.06 | 2.4520.008 | 0.360.03 | 0.290.02 | 1,2,4,6 |
| NGC 1549 | 21.28 | 14.68 | 1.73 | 1.140.03 | 6.34 | 0.630.07 | -0.500.03 | 2.3170.004 | 0.280.04 | 0.200.01 | 1,6 |
| NGC 3258 | 21.71 | 16.71 | 0.96 | 0.400.04 | 7.20 | 1.270.09 | 0.250.07 | 2.4380.019 | 0.420.11 | 0.210.03 | 2 |
| NGC 3268 | 21.72 | 16.82 | 1.33 | 0.680.05 | 7.24 | 0.870.17 | -0.580.08 | 2.3680.008 | 0.110.07 | 0.340.04 | 2 |
| NGC 3377 | 19.91 | 14.96 | 2.99 | 1.850.05 | 5.91 | 0.210.11 | -0.960.04 | 2.1620.009 | 0.240.02 | 0.240.02 | 3,4,6 |
| NGC 3379 | 21.12 | 14.79 | 2.00 | 1.060.04 | 7.02 | 0.510.03 | -0.520.02 | 2.3360.005 | 0.190.02 | 0.200.02 | 3,4,6 |
| NGC 3608 | 21.13 | 16.19 | 1.99 | 0.810.03 | 6.87 | 0.860.06 | -0.540.06 | 2.3060.010 | 0.290.02 | 0.250.02 | 3,4,6 |
| NGC 3923 | 21.88 | 14.62 | 2.03 | 0.650.02 | 6.70 | 0.860.08 | -0.200.03 | 2.3870.015 | 0.540.08 | 0.270.01 | 1,6 |
| NGC 3962 | 21.71 | 15.72 | 2.15 | 1.050.04 | 6.62 | 0.630.11 | -0.550.05 | 2.3590.012 | 0.130.02 | 0.220.03 | 2 |
| NGC 4365 | 22.09 | 14.35 | 2.07 | 0.440.02 | 6.35 | 0.910.08 | -0.050.06 | 2.4200.005 | 0.190.01 | 0.280.01 | 4 |
| NGC 4406 | 22.20 | 14.13 | 2.18 | 1.040.02 | 6.44 | 0.470.07 | -0.410.02 | 2.3960.006 | 0.400.03 | 0.230.01 | 5 |
| NGC 4473 | 20.89 | 15.36 | 2.08 | 1.080.05 | 6.62 | 0.520.15 | -0.740.01 | 2.2700.007 | 0.300.02 | 0.240.04 | 3 |
| NGC 4621 | 21.40 | 15.25 | 1.83 | 0.560.02 | 6.99 | 0.800.11 | -0.230.07 | 2.3810.008 | 0.300.04 | 0.280.05 | 3 |
| NGC 4649 | 22.34 | 14.14 | 1.21 | 0.340.01 | 7.08 | 0.770.04 | 0.360.06 | 2.5440.005 | 0.360.03 | 0.300.01 | 6 |
| NGC 4697 | 21.07 | 14.24 | 2.45 | 1.370.03 | 6.46 | 0.430.06 | -0.500.03 | 2.2420.005 | 0.150.04 | 0.140.02 | 1,2,4,6 |
| NGC 4839 | 22.93 | 17.43 | 1.24 | 0.510.01 | 6.93 | 0.880.10 | -0.180.11 | 2.4300.008 | 0.150.03 | 0.330.02 | 6,7 |
| NGC 4874 | 23.24 | 16.54 | 1.67 | 0.770.03 | 6.70 | 0.490.04 | -0.610.04 | 2.4190.009 | 0.530.03 | 0.410.03 | 6,7 |
| NGC 4889 | 23.51 | 16.74 | 1.18 | 0.450.02 | 7.01 | 0.770.02 | -0.030.08 | 2.5930.005 | 0.670.03 | 0.400.02 | 6,7 |
| NGC 5044 | 21.61 | 15.32 | 1.48 | 0.590.03 | 6.61 | 0.620.06 | -0.430.05 | 2.3800.018 | 0.120.20 | 0.300.09 | 2,4 |
| NGC 5813 | 21.91 | 15.94 | 2.05 | 0.830.06 | 7.04 | 0.700.21 | -0.560.14 | 2.3800.006 | 0.110.03 | 0.290.02 | 2,3,6 |
| NGC 5831 | 20.83 | 16.25 | 2.71 | 1.060.06 | 6.37 | 0.820.17 | -0.520.03 | 2.2240.011 | 0.280.14 | 0.160.03 | 1,2,3,6 |
| NGC 5846 | 22.18 | 15.31 | 1.27 | 0.580.03 | 7.33 | 0.410.09 | -0.020.10 | 2.4090.009 | 0.260.03 | 0.270.02 | 2,3,6 |
| NGC 5982 | 21.90 | 16.32 | 1.93 | 0.630.05 | 6.69 | 0.950.14 | -0.030.08 | 2.4080.007 | 0.380.02 | 0.280.04 | 3 |
| NGC 6868 | 21.87 | 15.90 | 1.66 | 0.840.04 | 7.25 | 0.460.12 | -0.240.07 | 2.4210.007 | 0.260.07 | 0.190.03 | 2 |
| NGC 6958 | 21.31 | 16.37 | 2.43 | 1.440.06 | 6.60 | 0.820.04 | -0.630.11 | 2.2930.012 | 0.110.06 | 0.150.02 | 1,3,6 |
| NGC 1052 | 21.02 | 15.77 | 1.50 | 0.610.02 | 7.03 | 0.890.07 | -0.170.11 | 2.3300.009 | 0.240.05 | 0.370.03 | 2,6 |
| NGC 2768 | 21.71 | 15.13 | 2.17 | 1.270.04 | 6.85 | 0.390.08 | -0.630.04 | 2.2940.008 | 0.220.04 | 0.260.04 | 3 |
| NGC 4261 | 22.14 | 15.80 | 1.28 | 0.310.02 | 6.84 | 0.920.04 | -0.050.10 | 2.4960.005 | 0.280.04 | 0.260.02 | 6 |
| NGC 4278 | 20.78 | 15.34 | 1.41 | 0.370.02 | 6.69 | 0.810.06 | -0.200.19 | 2.4110.007 | 0.220.02 | 0.400.03 | 3,6 |
| NGC 4374 | 22.14 | 14.47 | 1.87 | 0.910.02 | 6.71 | 0.650.05 | -0.310.05 | 2.4700.004 | 0.230.06 | 0.270.02 | 2,3,4,6 |
| NGC 4486 | 22.54 | 13.96 | 1.11 | 0.470.01 | 6.82 | 0.300.06 | 0.540.10 | 2.5410.007 | 0.340.02 | 0.410.05 | 3 |
| NGC 4552 | 21.33 | 15.20 | 1.07 | 0.180.02 | 6.90 | 0.800.08 | 0.190.11 | 2.4270.005 | 0.370.04 | 0.170.02 | 2,3,4,6 |
| NGC 4589 | 21.52 | 15.76 | 2.47 | 1.400.04 | 6.51 | 0.580.04 | -0.950.06 | 2.3530.011 | |||
| IC 1459 | 22.26 | 14.57 | 2.05 | 0.430.02 | 6.09 | 0.910.09 | -0.080.06 | 2.4970.006 | 0.370.08 | 0.250.04 | 2 |
| IC 4296 | 22.99 | 15.71 | 1.87 | 0.820.04 | 6.77 | 0.810.11 | 0.040.06 | 2.5190.008 | 0.420.12 | 0.270.02 | 1,2 |
| NGC 474 | 21.29 | 16.19 | 2.89 | 1.560.06 | 5.86 | 0.730.12 | -1.030.17 | 2.2310.013 | 0.260.04 | 0.160.05 | 3 |
| NGC 1316 | 22.88 | 13.44 | 2.29 | 1.570.02 | 6.29 | 0.160.09 | -0.590.04 | 2.3660.009 | 0.340.02 | 0.150.01 | 6 |
| NGC 1387 | 20.54 | 15.76 | 0.96 | 0.520.01 | 6.70 | 0.920.08 | 0.910.33 | 2.2310.029 | |||
| NGC 1389 | 19.62 | 16.61 | 2.08 | 1.530.05 | 6.64 | 0.490.06 | -0.520.05 | 2.1120.028 | 0.250.06 | 0.080.03 | 2 |
| NGC 1400 | 20.76 | 15.79 | 1.08 | 0.550.04 | 6.50 | 0.910.16 | 0.510.26 | 2.4120.004 | 0.370.06 | 0.270.01 | 1,4,6 |
| NGC 1553 | 21.29 | 14.27 | 2.32 | 1.300.02 | 6.71 | 0.670.08 | -0.410.03 | 2.2620.013 | 0.350.03 | 0.150.01 | 1,3,6 |
| NGC 2865 | 21.04 | 16.12 | 2.35 | 2.620.13 | 6.12 | -0.360.16 | -0.030.16 | 2.2510.010 | 0.100.02 | 0.360.03 | 4 |
| NGC 3115 | 21.19 | 14.37 | 1.89 | 0.680.02 | 6.77 | 0.600.10 | -0.290.04 | 2.4350.007 | 0.610.10 | 0.200.03 | 1 |
| NGC 3384 | 20.45 | 15.25 | 2.75 | 1.400.06 | 6.74 | 0.440.17 | -0.780.08 | 2.1960.011 | 0.370.01 | 0.220.02 | 3,4 |
| NGC 4459 | 20.82 | 15.44 | 2.19 | 1.110.03 | 6.94 | 1.190.12 | 0.750.20 | 2.2560.021 | 0.380.02 | 0.220.04 | 3 |
3.2 Global Colours
Using Galfit (Peng et al. 2002,2010) we fit Sérsic (1962, 1968) profiles to the FUV, NUV and H-band images. From these fits we derive the Sérsic index in all three bands, and the total magnitudes in the GALEX bands. Because of the strong coupling between the three parameters of the fit (, effective radius and total magnitude), we present total magnitudes in the GALEX bands constrained to = 4, when the Sérsic profile reduces to the De Vaucouleurs (1948) form. Although this runs the risk of underestimating the light at large radii, in this paper we are interested only in the (FUV-NUV) colour, and we believe that the colours derived by using Galfit in this way will be more precise than the SExtractor-derived GALEX calatogue values, and than the “Asymptotic” colours derived from growth curves by Gil de Paz et al. (2007), which are in any case only available for a subset of our sample.
In Figure 2 we compare our (FUV-NUV) colours with those from Gil de Paz et al. (2007). Their Asymptotic colours are in most cases bluer than our global colours, the offset is around 0.25 magnitude. Rather than being due to systematic errors in either technique, this difference is due to the fact that Galfit effectively extrapolates to larger radii than those of the the apertures used to define the growth curve, and thus the outer, redder regions are included in the Galfit colours. In this paper we use the Galfit-derived magnitudes, and these magnitudes and colours are presented in Table 2.

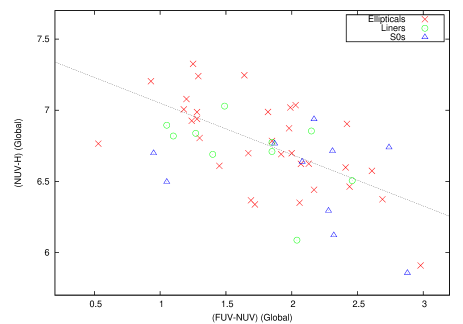
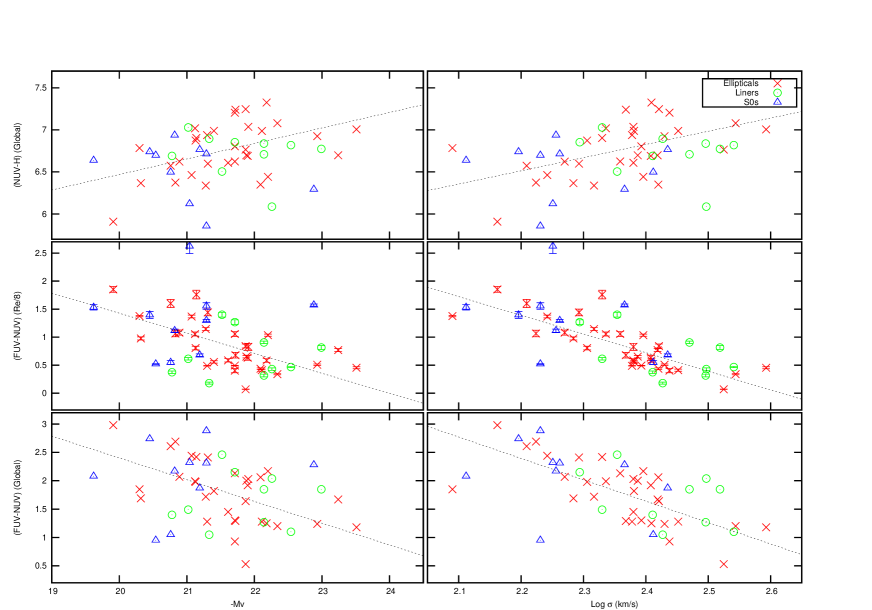
In Figure 3 we present a colour-colour diagram, plotting the global IR-UV colour (NUV-H) against (FUV-NUV). There is a weak but clear negative correlation, for the 32 ellipticals (i.e. the red crosses in the Figure) the Spearman Rank Correlation Coefficient (SRCC) is –0.62, giving significance level . The NUV magnitude appears on both axes in this figure, but the measurement errors on NUV are small and do not contribute significantly to the correlation.
In Figure 4 we plot the logarithmic radial gradient in (FUV-NUV) against its global value. There is a weak negative trend in this plot, but it is not statistically significant (SRCC = –0.26; p = 0.15 for the 32 ellipticals). The Pearson correlation coefficient for this particular correlation is –0.373, giving , but this is largely driven by two points, and in this case we regard the Spearman test as more robust.
In the right panel of this figure we plot for comparison the logarithmic radial gradient against the central value of (FUV-NUV), that within a central aperture of radius , being the effective radius as taken from De Vaucouleurs et al. (1991). lies in the range 1.5 - 13.0 arcsec, and as the PSFs in FUV and NUV are different, there will be a systematic offset in (FUV-NUV) which depends upon its value. From measurement of aperture colours of a model galaxy image convolved with the two PSFs, we determine and apply aperture corrections for the central colours. These corrections are in the range 0.05 – 0.11 magnitude.
Here the correlation appears more significant (SRCC = – 0.51; p = 0.003), although this is not surprising, the strongest gradients are in those galaxies with the bluest central colours
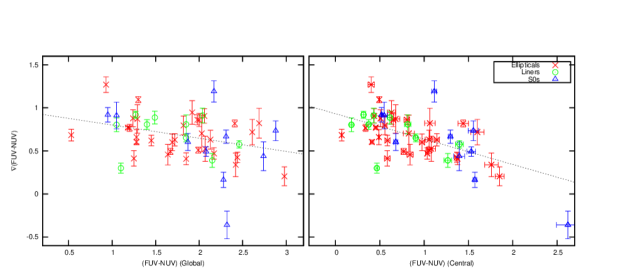
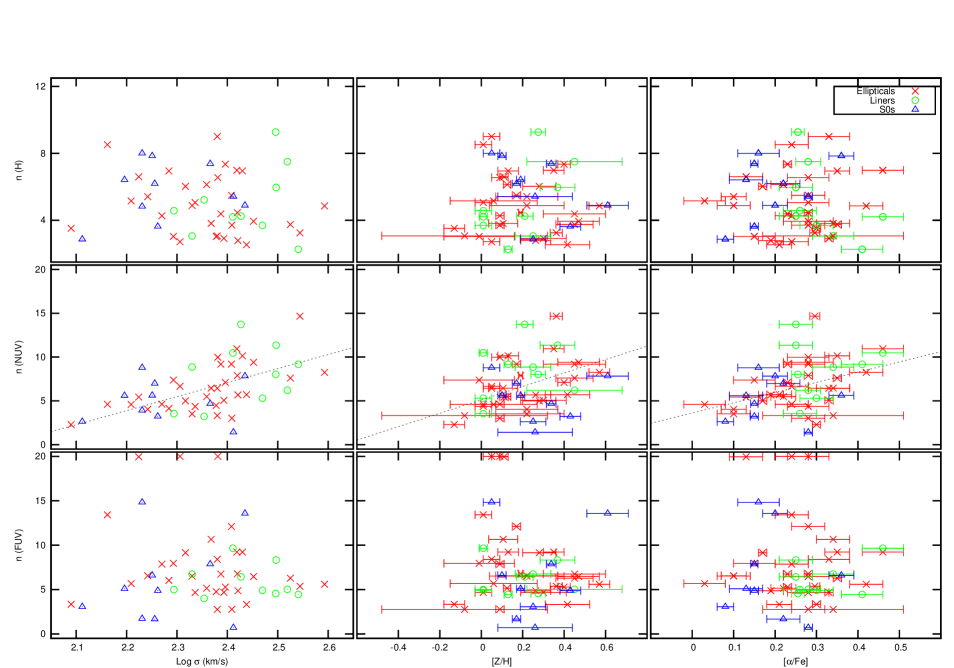
Figure 5 shows the global colours plotted against V-band absolute magnitude () and the logarithm of central velocity dispersion (). We take from the list of measurements given in HyperLeda. This lists measurements of from a number of sources, we ignore those which are clearly not central values (e.g. measurements of in a system of Planetary Nebulae) or which are taken from very old (e.g. photographic) spectra. Then for those galaxies with five measurements or fewer we take the mean, for those with more than five we reject the highest and the lowest and take the mean of the remainder. Our adopted velocity dispersions are given as in Table 2, where we also give an error, which for galaxies with 5 measurements is the standard error of the mean. Both colours show significant correlations with both and , in the sense that brighter galaxies and those with high are bluer in (FUV-NUV) and redder in (NUV-H). In agreement with Marino et al. (2011) we find the most significant correlation to be that between (FUV-NUV) and (SRCC = –0.74; for the ellipticals), suggesting that the depth of the potential well, more than the total mass, plays a key rôle in determining the strength of the UV excess. A multiple regression upon and confirms that all of the trend is accounted for by , with no significant residual luminosity dependence. The correlations with central (FUV-NUV) are slightly stronger (SRCC = -0.86; for the case) which is unsurprising as is a central measurement.
3.3 Colour Gradients
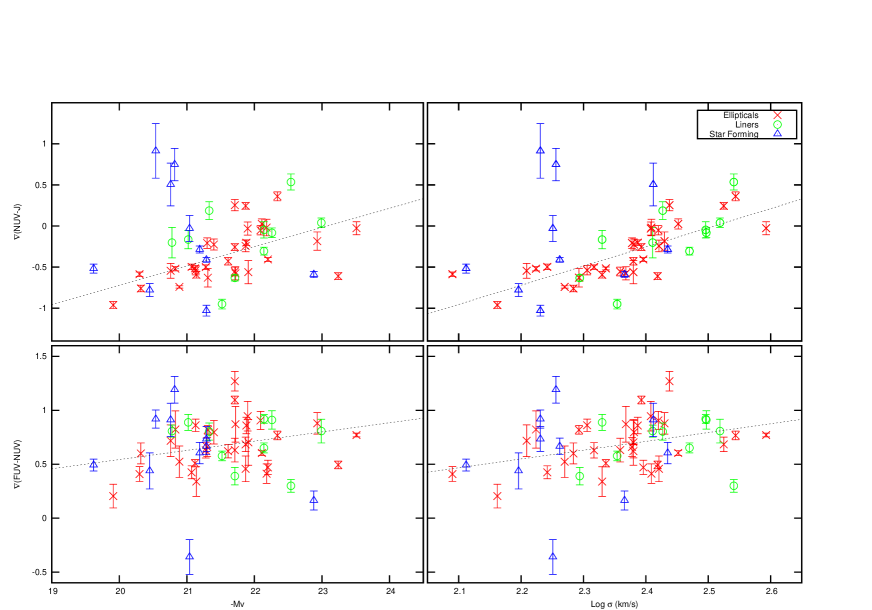
Figure 6 shows the logarithmic colour gradients plotted against and . All elliptical galaxies have strong positive , but the gradient does not correlate strongly with either or . is predominantly negative, and correlates strongly with and in particular with (SRCC = 0.80; ), in the sense that the largest negative gradients are in galaxies with .
Colour gradients in early-type galaxies, particularly those involving the bluer observable bands, have long been thought to be a measure of a metallicity gradient, and thus the dependence of gradients upon kinematic parameters has been used as a probe of galaxy formation models. Peletier et al. (1990) find no significant correlation between and , although they cover a wider range in absolute magnitude than we do and there is some indication in their Figure 12 that the gradient is strongest for galaxies with and weaker at both brighter magnitudes, and at fainter ones which we do not cover. La Barbera et al. (2005) find no significant dependence of upon , however they do find an environmental dependence, with steeper gradients away from rich clusters. La Barbera et al. (2010) define a composite colour gradient and find very weak dependence upon in a sample of early-type galaxies from the Sloan Digital Sky Survey (SDSS). Tortora et al. (2010) analyse the colour gradients in a much larger sample of galaxies from SDSS. For the early-type galaxies in their sample they find a complex dependence of upon , with the strongest gradients occurring at , with weaker gradients in higher velocity dispersion galaxies, and weaker or even positive gradients at . Tortora et al. (2010) and La Barbera et al. (2010) concur that metallicity gradients are the main driver of the colour gradients, with age a secondary factor. This is borne out by a number of studies of spectroscopically determined gradients in stellar population parameters (Kobayashi & Arimoto 1999; Ogando et al. 2005; Spolaor et al. 2009).
A further complication with the interpretation of our trend of with as evidence of a dependence on the metallicity gradient is the possibility that the UV excess stars will contribute some flux in the NUV band as well as in FUV. Although does not correlate strongly with , the gobal value of (FUV-NUV) does, and this, combined with the overall positive gradients in this colour could lead to some leakage of the FUV excess flux into the NUV band, preferentially at small radii and for galaxies with large . Rawle et al. (2008) discuss the effect of the FUV excess upon the scatter in the (NUV-J) colour-magnitude relation, and show that it does not contribute significantly to this scatter.
3.4 Stellar Populations
For all except four of our galaxies there are estimates of stellar population parameters , [Z/H] and [/Fe] in the literature. There are differences in methodology between these sources, in terms of the spatial extent of the region observed, and the model spectra used to convert line index measurements into population parameters. Ogando et al. (2010) use the SSP models of Thomas et al. (2003) to convert the line strength measurements presented in Ogando et al. (2008) to population parameters. These line strengths were measured from spectra taken with a 4.1 x 2.5 arcsec slit. Annibali et al. (2007) use a new set of -enhanced SSP models, to fit to line strength measurements presented in Rampazzo et al. (2005) and Annibali et al. (2006), these line index measurements are within an aperture of . Annibali et al. (2007) present values of Z, which we convert to [Z/H] using Z⊙ = 0.018. Kuntschner et al. (2010) use the SAURON integral-field spectrograph to derive line index maps, and fit the stellar population models of Schiavon (2007) to these. They present derived stellar population parameters within and , we use the former. Spolaor at el. (2010) report stellar population parameters as derived in a number of papers by the Swinburne group, for the galaxies in our sample the original sources are Sánchez-Blázquez et al. (2007; Reda at al. (2007); Spolaor et al. (2008); Brough et al. (2007) and Proctor & Sansom (2002). Their values are measured within , and measured line indices are converted to stellar population parameters using the models of Thomas et al. (2003). Serra et al. (2008) present stellar population parameters within derived using the stellar population models of Bruzual & Charlot (2003), and the models of the index response to [E/Fe] presented by Lee et al. (2009). Thomas et al. (2005) measure line indices within , and derive stellar population using their own SSP models. Loubser et al. (2009) measure line indices within a slit of 1 arcsec by , and convert these to population parameters usingthe SSP models of Thomas et al. (2003).
Given the differences in observational technique, region and SSP models, we attempt to adjust the population parameters to a standard scale, using galaxies in common between the samples (all of the samples are of course larger than just those galaxies for which there are GALEX data). However even with the complete samples, the overlaps between studies are small and inconsistent. Moreover the study with the largest sample, and the most galaxies in common with other studies (Thomas et al. 2005) is also the one for which the rms differences with other studies are the greatest. Although we find no systematic differences between the values of [/Fe] found by different authors, the values of [Z/H] found by Kuntschner et al. (2010) are low compared with other sources. We attempt to standardise the population parameters by adding 0.21 to the Kuntschner et al. (2010) values of [Z/H]. We are not making the judgement that the resulting values are in any way more correct, but only that they are more comparable to the other studies.
We find that the values of Log(Age) from different sources have large systematic and random differences, and cannot derive consistent transformations between sources. We do not consider Age any further in the current study, to do so we suggest would require re-observing all of our sample of galaxies with a common observational setup, and analysis of the data with a common fitting routine and set of models.
Where [Z/H] and [/Fe] are given by more than one source we combine these using an unweighted mean as the errors provided by the different sources are not derived in a sufficiently consistent way to use them for weighting. We list the final values we have used and their sources in Table 2.
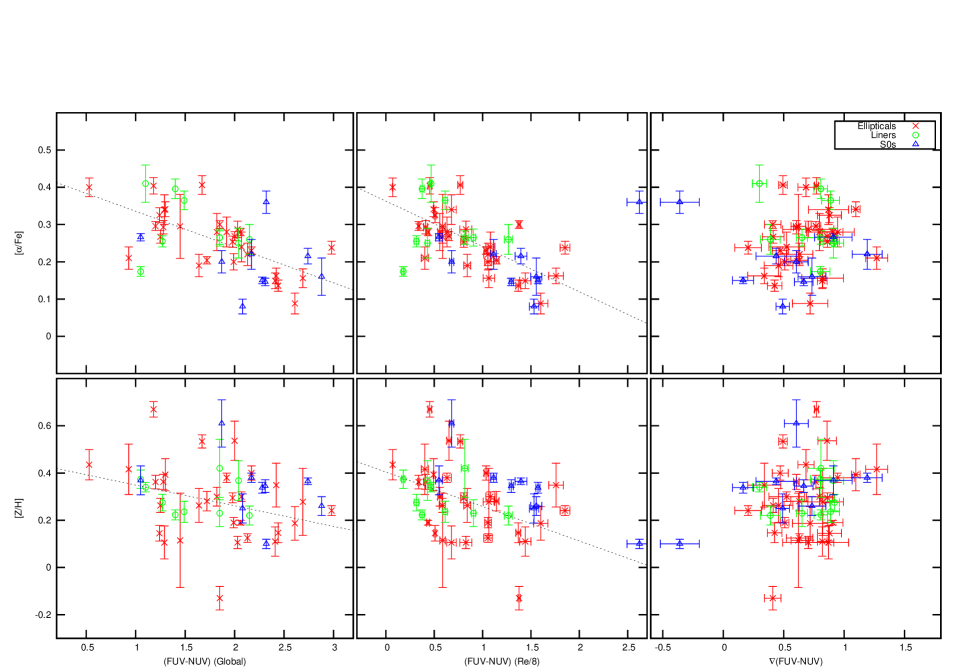
In Figure 7 we plot the global colours and logarithmic colour gradients against each of the stellar population parameters. In this plot [Fe/H] in the second column of panels is calculated from the other parameters using [Fe/H] = [Z/H] - 0.94[/Fe] (Thomas et al. 2003). There is a fairly well established correlation between (FUV-NUV) and the line index (Burstein et al. 1988; Donas et al. 2007) although Loubser & Sánchez-Blázquez (2010) do not find such a correlation in their sample of Brightest Cluster Galaxies. We find significant negative correlations between both global and central (FUV-NUV) and both [Z/H] and [/Fe]. The correlations with central colour are slightly tighter (SRCC = –0.45; for [Z/H] SRCC = –0.66; for [/Fe]). The latter correlation suggests that the FUV excess may be driven by -element abundance rather than overall metallicity, indeed there is no significant correlation at all between either global or central (FUV-NUV) and [Fe/H] (SRCC = –0.009; for the central value).
does not correlate with any stellar population parameter, but (not shown in Figure 7) correlates with [Z/H] (SRCC = 0.47; ), which is shown by a multiple regression to be entirely a consequence of the strong dependence of both of these parameters on .
3.5 The Sérsic index
Marino et al. (2011) find a relationship between [/Fe] and the Sérsic index , with galaxies with having [/Fe] 0.15, while galaxies with smaller have a range of [/Fe]. They suggest that this reflects a more fundamental relationship between [/Fe] and galaxy mass, which is related to the formation timescales of early-type galaxies. The values of used by Marino et al. (2011) are an average of those determined in NUV, FUV and r bands. In Figure 8 we investigate whether this relationship is present in our sample, and whether it is particuarly driven by the value of determined in any particular band. We find no significant correlation between as measured in either FUV or H bands with either or any stellar population parameter, but measured in the NUV band has a strong positive correlation with (SRCC = 0.65; ) and weaker but significant correlations with both with [Z/H] (SRCC = 0.45; ), and [/Fe] (SRCC = 0.46; ). We suggest that the correlation found by Marino et al. (2011) is dominated by the NUV band, and, as they suggest, is a consequence of the correlation of all of these parameters with the depth of the galaxy potential well. The mechanism by which the potential affects in the NUV band is related to the strong UV to IR colour gradients found in galaxies of lower (Figure 6, upper right panel) which in turn is related to the strong metallicity gradients in galaxies of intermediate velocity dispersion.
3.6 IR and UV residual images
The colour gradients show that the stars contributing to the FUV excess are more centrally concentrated than the underlying population. We now attempt to map these regions by subtracting from the GALEX images a model of the underlying population as determined in the H band. We use Galfit to determine and for the H-band image, then we scale this model to the GALEX images, with the high surface brightness regions masked out. The mask was constructed from the FUV image. Initially a copy of the FUV image was smoothed with a circular Gaussian kernel of = 3 pixels (4.5 arcseconds). All pixels in the smoothed image below a threshold were then set to zero, and the resultant image was used as the mask image for Galfit, which ignores in the fit all pixels whose value in the mask is not zero. The FUV surface brightness of the mask threshold was set between 26.0 and 27.0 mag arcsec-2, and was dependent upon the exposure time of the FUV image. Galfit was run on both FUV and NUV images using the mask determined in FUV, and with , and the ellipticity and position angle constrained to the values determined in H. The galaxy centre pixel co-ordinates were constrained to those found from the unmasked FUV and NUV images. So effectively we scale the H-band model to the outer regions of the FUV and NUV images, and subtract this scaled model.
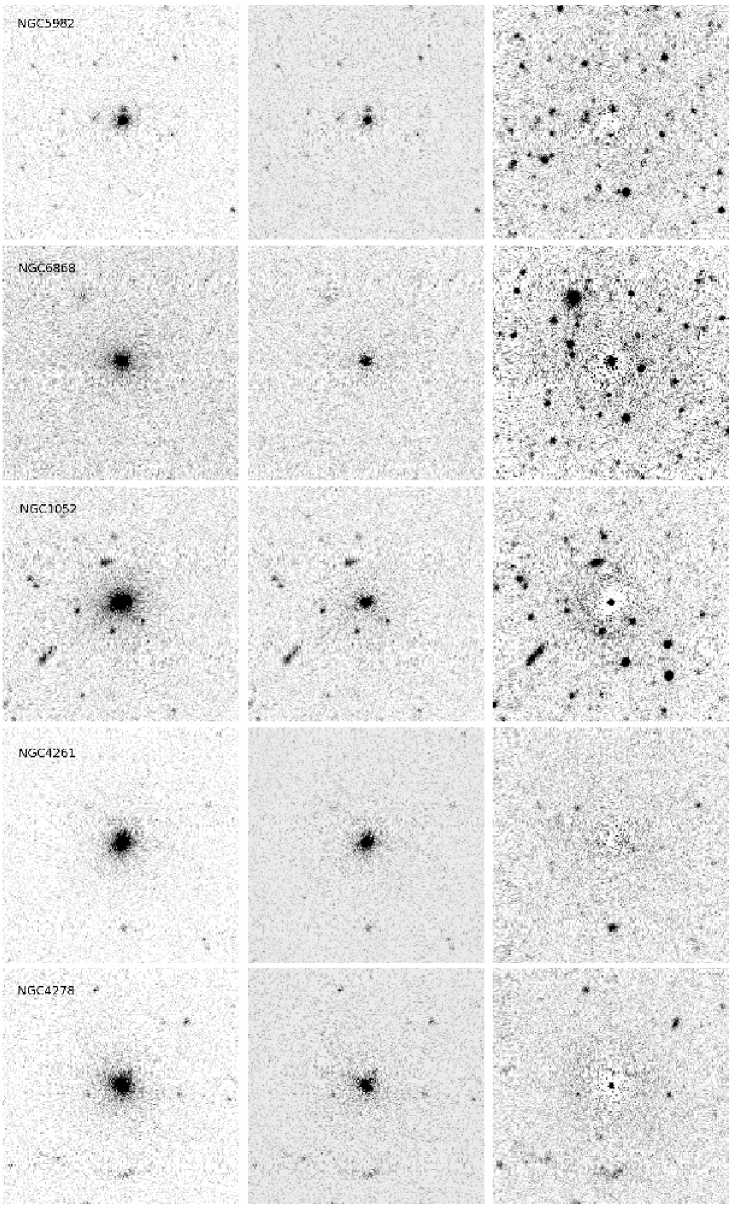
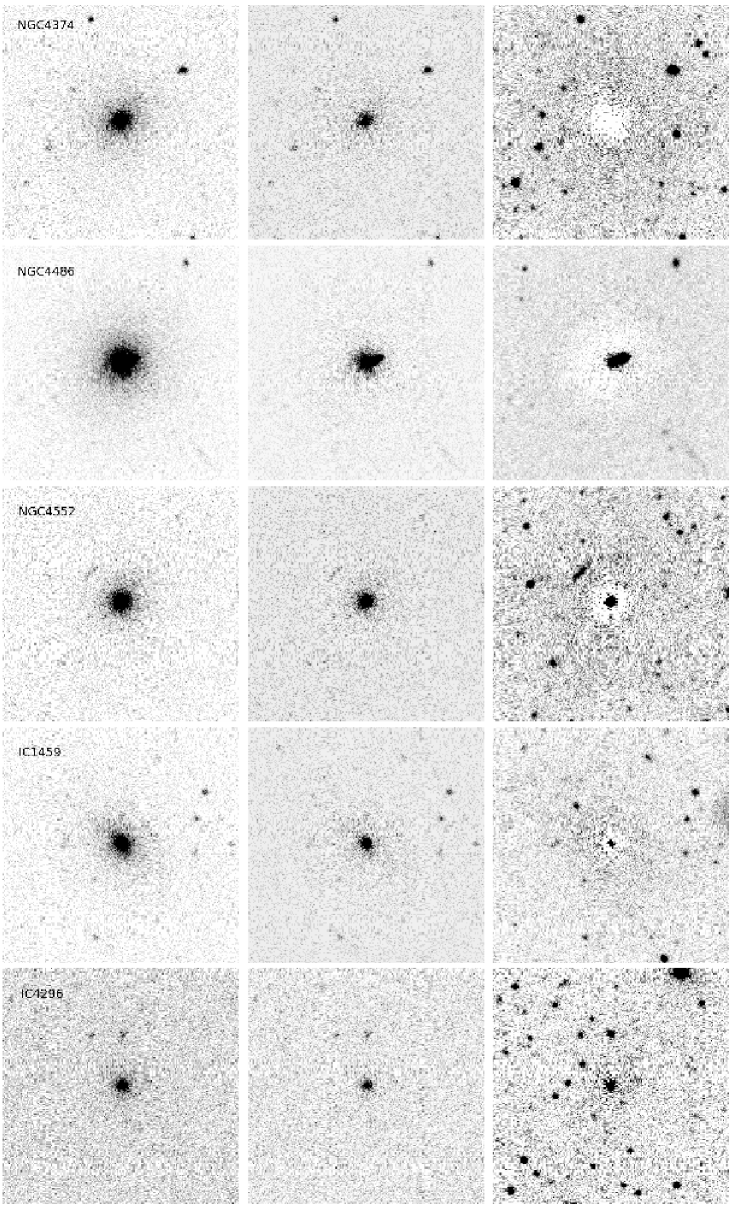
The residual images now show the spatial distribution of the sources giving rise to the FUV excess. In Figures B1 to B6 of Appendix B, presented in the online version of the paper only, we show, for a subsample of our galaxies, greyscale images showing the FUV images, FUV residual images, and the residual images in the NUV band obtained by the same process. Most FUV images show an extended FUV excess over the H-band fit at some level.
The NUV residual images show a variety of structures, and provide some indication of the source of the FUV excess emission. In many galaxies with extended FUV excess (e.g. NGC720, NGC1404, NGC4473, NGC4697 and many other galaxies) the NUV residual image is negative in the core, reflecting the negative (NUV-J) and (NUV-H) colour gradients caused by a metallicity gradient and hence enhanced line blanketing in the core. In these cases we can be confident that the FUV residual does indeed show the distribution of the stars giving rise to the FUV excess. In a number of other galaxies (e.g. NGC1407, NGC4365, NGC4649, NGC4839 and NGC4889) the NUV residual image shows extended positive excess NUV emission, which we attribute to recent star formation in the core. This will also contribute to the FUV residual, but cannot account for it all. For instance for NGC4649, which shows the strongest positive NUV residual, we find from the fits to the residual images described below that the magnitude of the excess is 16.26 in FUV and 17.13 in NUV. Bianchi et al. (2005) present some single stellar population and continuous star formation models (their Figure 5) and they find that (FUV-NUV) lies in the range -0.2 to 0.0 for models with ages between 3 and 32Myr. Thus even in the unlikely event of the NGC4649 NUV excess being due to such a young starburst, this can still contribute at most 50% of the excess flux in the FUV.
Liners, such as NGC1052, NGC4278, NGC4486 and NGC4552, show unresolved NUV and FUV excess which we attribute to the non-thermal nuclear source, in the latter two cases there is clearly extended FUV residual emission as well. In NGC1399, in addition to a strong extended FUV residual emission, and extended negative NUV residual, there is an excess in both bands right in the core. This occurs in the H-band as well and is an indication that the Sérsic function is an inadequate fit to the surface brightness profile, there is extra light (c.f. Kormendy et al. 2009) above the Sérsic fit in all wavebands in the core of this galaxy.
For a smaller subsample, the signal-to-noise ratio in the FUV residual images is sufficient that we can use Galfit to determine their structure. Our procedure is to fit a Sérsic function to the residual image, adopting the square root of the original FUV counts image (i.e. the GALEX archive image multiplied by the exposure time) as a noise image. The results of the fits are given in Table 3. In this Table, column 2 gives the extinction corrected FUV apparent magnitude of the Sérsic model of the residual, column 3 the effective radius Re and column 4 the Sérsic index of the residual image. Column 5 gives the magnitude difference between the model of the residual and the model of the galaxy image, the latter is calculated from columns 3 and 4 of Table 2. The magnitude difference can be as little as 0.58 magnitudes, meaning that the central residual component can contribute up to 60% of the FUV flux, although values of 30% - 40% are more typical. The upper limit to this magnitude difference of some 3.5 magnitudes, equivalent to a residual component of 4% of total FUV flux, represents only our inability to measure smaller contributions with this technique. Similarly we find that Re for the residual component is much smaller than for the galaxy image in the FUV passband, if it were not then our procedure would not recover the residual, so we cannot rule out the existence of a more extended and more luminous FUV component with a scale length equal to that of the old stellar component of the galaxy. The Sérsic index, is mostly in the range 0.5 - 2.0, with some outliers near 0 and 3.
| Galaxy | Residual properties | |||
|---|---|---|---|---|
| fuv0 | (arcsec) | fuv(Resid-Total) | ||
| NGC720 | 18.42 | 4.47 | 0.72 | 1.68 |
| NGC1399 | 16.56 | 4.53 | 1.18 | 1.44 |
| NGC1404 | 18.47 | 4.47 | 0.72 | 1.96 |
| NGC1549 | 19.90 | 4.26 | 0.95 | 3.49 |
| NGC3379 | 18.33 | 5.10 | 1.10 | 1.54 |
| NGC3608 | 19.66 | 1.46 | 1.47 | 1.49 |
| NGC3923 | 17.91 | 4.44 | 2.00 | 1.26 |
| NGC3962 | 20.05 | 4.34 | 0.50 | 2.19 |
| NGC4365 | 17.70 | 4.11 | 1.25 | 1.28 |
| NGC4406 | 19.68 | 4.77 | 0.06 | 3.36 |
| NGC4473 | 19.45 | 3.02 | 1.37 | 2.00 |
| NGC4621 | 18.03 | 1.83 | 3.02 | 0.95 |
| NGC4649 | 16.26 | 6.14 | 1.29 | 0.91 |
| NGC4697 | 19.75 | 4.77 | 0.41 | 3.06 |
| NGC4874 | 21.11 | 5.88 | 0.94 | 2.90 |
| NGC4889 | 19.49 | 4.91 | 1.69 | 1.57 |
| NGC5044 | 19.22 | 8.03 | 0.46 | 2.42 |
| NGC5982 | 19.32 | 1.61 | 3.75 | 1.07 |
| NGC4261 | 17.95 | 4.08 | 1.75 | 0.87 |
| NGC4278 | 17.58 | 2.04 | 3.24 | 0.83 |
| NGC4374 | 18.24 | 6.15 | 0.60 | 1.90 |
| NGC4552 | 16.84 | 2.04 | 2.28 | 0.58 |
| IC1459 | 17.99 | 2.91 | 1.45 | 1.37 |
4 Discussion
Our (FUV-NUV) gradients and the residual images show that the FUV excess stars are more centrally concentrated than the population which contributes the bulk of the light at longer wavelengths. All normal ellipticals, all liners, and all bar one of the starforming sample show positive (FUV-NUV) gradients, yet there is no clear correlation between the gradients and the absolute value of the FUV excess. The FUV excess is centally concentrated irrespective of its absolute level. There is no clear indication that the FUV excess depends upon environment, for instance it is not particularly strong in either NGC4874 in the core of the Coma cluster, or NGC4486 in the centre of the X-ray distribution in Virgo. It can be moderately strong in galaxies which show evidence of recent minor mergers, for instance the shell ellipticals NGC4552 (Malin 1979), NGC3608 (Forbes & Thomson 1992), NGC3923 (Malin & Carter 1980) and NGC5982 (Sikkema et al. 2007), but in galaxies with evidence of recent major mergers such as NGC474 (Turnbull et al. 1999), NGC1316 (Schweizer 1980) and NGC2865 (Hau et al. 1999), and the kinematically decoupled core galaxy NGC596, the FUV excess is weak.
The UV bright stars appear to be part of an old population, formed in a short period of time early in the process of galaxy formation. Pipino & Matteucci (2004) and Pipino et al. (2006, 2008, 2010) present a number of hydrodynamic models for the formation of ellipticals, a key prediction of these models is that star formation ceases earlier in the outer regions of the galaxies (“outside-in” formation). These models are successful in predicting the observed steep metallicity gradients determined from the optical spectra () and, by taking into account difference in initial conditions, they can reproduce the observed variety in .
However Figure 7 shows that the FUV excess is more a feature of -enhanced than of metal-rich populations so it is likely that some other factor is driving the steepness and ubiquity of the UV-IR colour gradients. Helium abundance is a clear candidate, it has long been suspected that enhanced helium facilitates the formation of Extreme Horizontal Branch (EHB) stars. Norris (2004) and Lee et al. (2005) suggest that a large enhancement in the helium abundance () can explain the extended blue horizontal branch in part of the stellar population of the globular cluster Centauri. Sohn et al. (2006) investigate the UV properties of the globular clusters associated with NGC4486. Many of these clusters are very blue in (FUV-V), but in contrast with elliptical galaxies the bluest UV colours are found for the clusters with the weakest index. Kaviraj et al. (2007) propose that this indicates that these clusters have a small fraction of a helium enhanced population. Globular clusters are of course metal-poor populations compared with massive elliptical galaxies, but these observations strongly suggest that large variations in helium content can be generated by some process or processes. Suggestions include self-enrichment by winds from the first generation of massive AGB stars (D’Antona & Ventura 2007) or by winds from massive rapidly rotating stars (Decressin et al. 2007). However whether the helium is primordial of the product of early self-enrichment, we need a mechanism to generate the strong gradients in the FUV excess that we observe.
A number of authors, including Chuzhoy & Loeb (2004) and Peng & Nagai (2009), propose that helium sedimentation in cooling gas can generate enhanced helium abundances in brightest cluster galaxies. The efficiency of this process is a strong function of the temperature of the cooling gas (Diffusion velocity T1.5, and it is supressed by turbulence and by small scale magnetic fields. Nevertheless both of these studies conclude that sedimentation can lead to an enhancement of Helium by a factor up to 1.2 in cD type galaxies, where the gas temperature is 107K. At first sight this sedimentation process is an attractive candidate for the origin of the central gradients in the FUV excess, however there are two problems with this hypothesis, The first is that it is supressed at high gas concentrations, as the pressure gradient causes outward diffusion which supresses sedimentation. Thus the helium abundance enhancement peaks at , where is the radius within which the mean enclosed mass density is 500 times the critical density of the universe (Peng & Nagai 2009). A further problem is the sedimentation timescale, which is given by:
| (1) |
where is the local gas fraction; T is temperature; and is a suppression factor due to the magnetic field (Chuzhoy & Loeb 2004). is likely to be a few Gyrs, and so it is difficult to set up a strong gradient in the early stages of galaxy formation.
Whatever the origin of the enhancement, the persistence of the gradients to the current epoch suggests that this population has not been disturbed by “dry” mergers, which would tend to smooth out the gradient. Simulations of the effect of mergers on the persistence of metallicity gradients have been carried out by Kobayashi (2004) and Di Matteo et al. (2009). The effect of mergers on a helium gradient is a somewhat simpler case, as there is no clear mechanism for regenerating such a gradient if it is disturbed. Di Matteo et al. (2009) consider dry mergers of galaxies of equal mass galaxies with a range of initial metallicity slopes. Although they find that a gradient can be preserved or even enhanced through a merger, this is only true when they consider a “primary” galaxy merging with a “companion” of much steeper slope. In the realistic case of a merger between two galaxies of equal initial slope, they find the remnant to have 0.6 times this initial slope. Repeated major mergers would thus very quickly wash out the initial gradients. If the UV colour gradients are driven by helium abundance, the absence of a regeneration mechanism means that they provide a stronger constraint on the importance of dry mergers in the formation of ellipticals than do the metallicity gradients.
The weak AGN and Liners shows very little difference in their UV properties from the main sample, particularly once the central 3 arcsec aperture is taken out. It appears that a weak AGN has little effect on the global UV properties. The S0/SA0/SAB0 galaxies differ from the main sample in their NUV properties, in particular in , which is strongly positive in many of this sample. However the FUV properties of this sample follow largely the same correlations as the main sample, and it seems that the FUV excess is unrelated to any ongoing star formation activity.
5 Conclusions
In agreement with previous authors we find that early-type galaxies show an excess of flux in the GALEX far ultraviolet band, compared with that expected from a normal old stellar population. There is a considerable variation in the magnitude of this excess, and a complex set of dependencies upon the dynamical and stellar population parameters of the galaxy. The excess shows a stronger correlation with the central velocity dispersion than with the absolute magnitude of the galaxy. It also shows a definite correlation with [/Fe] in the old stellar population, and a weaker correlation with [Z/H].
The FUV excess is more centrally concentrated than the underlying old stellar population in all galaxies except for currently starforming systems and recent major merger remnants. The logarithmic (FUV-NUV) colour gradient is overwhelmingly positive, is typically 0.6 magnitudes/dex, and shows a weak positive correlation with the central internal velocity dispersion , but it correlates much more weakly with the strength of the FUV excess itself. It does not correlate significantly with any stellar population parameter.
Most galaxies show a negative colour gradient in (NUV-J), which can be attributed to a metallicity gradient. This gradient is strongest in galaxies with although we do not sample galaxies with . The relationship between the Sérsic index , and [/Fe] in the stellar population found by Marino et al. (2011) appears to be driven largely by the NUV band, and appears to be related to the strong UV to IR colour gradients in galaxies with low , and the correlation between and [/Fe].
When we treat the FUV excess as a separate component, we find that it is well fit with a Sérsic model profile with the Sérsic index in the range 0 to 3.5. This component can contribute up to 60% of the total FUV flux from the galaxy. The most likely origin of the FUV excess is in a population of old, probably metal poor, stars which coexist with the optically dominant old metal-rich population in the centres of ellipticals. Helium abundance is a plausible candidate for the property of the stellar population which drives both the variation in the strength of the excess, and the comparatively uniform radial gradients in that strength. Helium sedimentation in a cooling plasma in the very early stages of galaxy formation is a possible mechanism to establish such a gradient, although the timescale required to set up such a gradient by this process may be unfeasibly long. The persistence of strong gradients to the present day provides strong limits of the importance of major “dry” mergers in the formation of ellipticals.
Acknowledgments
GALEX is a NASA Small Explorer. We acknowledge support from NASA for construction, operation, and science analysis for the GALEX mission, developed in cooperation with the Centre National d’Etudes Spatiales of France and the Korean Ministry of Science and Technology. This publication makes use of data products from the Two Micron All Sky Survey, which is a joint project of the University of Massachusetts and the Infrared Processing and Analysis Center/California Institute of Technology, funded by the National Aeronautics and Space Administration and the National Science Foundation. This research has made use of the NASA/IPAC Extragalactic Database (NED) which is operated by the Jet Propulsion Laboratory, California Institute of Technology, under contract with the National Aeronautics and Space Administration. DC and AMK acknowledge support from the Science and Technology Facilities Council (STFC) under grant ST/H/002391/1. We acknowledge support for JK in this research from a Nuffield Foundation Science Bursary. We thank Dr. Sue Percival and Dr. Phil James for many helpful discussions and comments throughout the course of this project, and the referee for a careful reading and suggestions which have greatly improved the paper.
References
- Annibali et al. (2006) Annibali F., Bressan A., Rampazzo R., Zeilinger W. W., 2006, A&A, 445, 79
- Annibali et al. (2007) Annibali, F., Bressan, A., Rampazzo, R., Zeilinger, W. W. & Danese, L. 2007, A&A, 463, 455
- Bianchi et al. (2005) Bianchi, L., et al. 2005, ApJL, 619, L71
- Brough et al. (2007) Brough S., Proctor R., Forbes D. A., Couch W. J., Collins C. A., Burke D. J., Mann R. G., 2007, MNRAS, 378, 1507
- Brown et al. (1997) Brown, T. M., Ferguson, H. C., Davidsen, A. F., & Dorman, B. 1997, ApJ, 482, 685
- Brown et al. (2000a) Brown, T. M., Bowers, C. W., Kimble, R. A., & Ferguson, H. C. 2000a, ApJ, 529, L89
- Brown et al. (2000b) Brown, T. M., Bowers, C. W., Kimble, R, A., & Ferguson, H. C. 2000b, ApJ, 532, 308
- Brown et al. (2003) Brown, T. M., Ferguson, H. C., Smith, E., Bowers, C. W., Kimble, R. A., Renzini, A. & Rich, R. M. 2003, ApJ, 584, L69
- Brown et al. (2008) Brown, T. M., Smith, E., Ferguson, H. C., Sweigert, A. V., Kimble, R. A., & Bowers, C. W. 2008, ApJ, 682, 319
- Bruzual & Charlot (2003) Bruzual G., Charlot S., 2003, MNRAS, 344, 1000
- Burstein et al. (1988) Burstein. D., Bertola, F., Buson, L. M., Faber, S. M., & Lauer, T. R. 1988, ApJ, 328, 440
- Carter et al. (2009) Carter, D., et al. 2009, MNRAS, 397, 695
- Code & Welch (1979) Code, A. D. & Welch, G. A. 1979, ApJ, 229, 95
- Chuzhoy & Loeb (2004) Chuzhoy, L. & Loeb, A. 2004, MNRAS, 349, L13
- D’Antona & Ventura (2007) D’Antona, F. & Ventura P. 2007, MNRAS, 379, 1431
- Decressin et al. (2007) Decressin, T., Meynet, G., Charbonnel C. Prantzos, N., & Ekström, S. 2007, A&A, 464, 1029
- De Vaucouleurs (1948) De Vaucouleurs, G. 1948, Annales d’Astrophysique, 11, 247
- De Vaucouleurs et al. (1991) De Vaucouleurs G., De Vaucouleurs A., Corwin H. G., Buta R. J., Paturel G., Fouque P., 1991, Third Reference Catalog of Bright Galaxies, Vols. 1-3, Springer-Verlag, Berlin (RC3)
- Di Matteo et al. (2009) Di Matteo, P., Pipino, A., Lehnert, M. D., Combes, F. & Semelin, B. 2009, A&A, 499, 427
- Donas et al. (2007) Donas, J., et al. 2007, ApJS, 173, 597
- Dorman et al. (1995) Dorman, B., O’Connell, R. W. & Rood, R. T. 1995, ApJ, 442, 105
- Forbes & Thomson (1992) Forbes, D.A. & Thomson, R.C. 1992, MNRAS, 254, 723
- Gil de Paz et al. (2007) Gil de Paz, A., et al. 2007, ApJS, 173, 185
- Greggio & Renzini (1990) Greggio, L. & Renzini, A. 1990, ApJ, 364, 35
- Han et al. (2002) Han Z., Podsiadlowski Ph., Maxted P. F. L., Marsh T. R. & Ivanova N. 2002, MNRAS, 336, 449
- Han et al. (2003) Han Z., Podsiadlowski Ph., Maxted P. F. L. & Marsh T. R. 2003, MNRAS, 341, 669
- Han et al. (2007) Han, Z., Podsiadlowski, Ph. & Lynas-Gray, A. E. 2007, MNRAS, 380, 1098
- Han (2008) Han, Z., 2008, A&A, 484, L31
- Hau et al. (1999) Hau, G. K. T., Carter, D. & Balcells, M. 1999, MNRAS, 306, 437
- Jarrett et al. (2003) Jarrett, T. H., Chester, T., Cutri, R., Schneider, S. E. & Huchra, J. P. 2003, AJ, 125, 525
- Jeong et al. (2009) Jeong, H., et al. 2009, MNRAS, 398, 2028
- Kaviraj et al. (2007) Kaviraj, S., Sohn, S. T., O’Connell, R. W., Yoon, S.-J., Lee, Y.-W., & Yi, S. K. 2007, MNRAS, 377, 987
- Kobayashi (2004) Kobayashi, C. 2004, MNRAS, 347, 740
- Kobayashi & Arimoto (1999) Kobayashi, C. & Arimoto, N. 1999, ApJ, 527, 573
- Kormendy et al. (2009) Kormendy, J., Fisher, D. B., Cornell, M. E. & Bender, R. 2009, ApJS, 182, 216
- Kuntschner et al. (2010) Kuntschner, H., et al. 2010, MNRAS, 408, 97
- La Barbera et al. (2005) La Barbera, F., de Carvalho, R. R., Gal, R. R., Busarello, G., Merluzzi, P., Capaccioli, M. & Djorgovski, S. G. 2005, ApJL, 626, L19
- La Barbera et al. (2010) La Barbera, F., de Carvalho, R. R., De La Rosa, I. G., Gal, R. R., Swindle, R. & Lopes, P. A. A. 2010, AJ, 140, 1528
- Lee et al. (2007) Lee, Y.-W., et al., 2005, ApJL, 621, L57
- Lee et al. (2009) Lee H.-c., et al., 2009, ApJ, 694, 902
- Lisker & Han (2008) Lisker, T. & Han, Z. 2008, ApJ, 680, 1042
- Loubser et al. (2009) Loubser, S. I., Sánchez-Blázquez, P.; Sansom, A. E. & Soechting, I. K. 2009, MNRAS, 398, 133L
- Loubser & Sánchez-Blázquez (2011) Loubser, S. I. & Sánchez-Blázquez, P. 2011, MNRAS, 410, 2679
- Magris & Bruzual (1993) Magris, G. & Bruzual, G. 1993, ApJ, 417, 102
- Malin (1979) Malin, D.F. 1979, Nature, 277, 279
- Malin & Carter (1980) Malin, D.F. & Carter, D. 1980, Nature 285, 643
- Marino et al. (2011) Marino, A., et al. 2010, MNRAS, 411, 311
- Martin et al. (2005) Martin, D., et al. 2005, ApJL, 619, L1
- Norris (2004) Norris, J. E. 2004, ApJL, 612, L25
- O’Connell et al. (1992) O’Connell, R.W., et al. 1992, ApJL, 395, L45
- O’Connell (1999) O’Connell, R. W. 1999, ARA&A, 37, 603
- Ogando et al. (2005) Ogando, R. L. C., Maia, M. A. G., Chiappini, C., Pellegrini, P. S., Schiavon, R. P. & da Costa, L. N. 2005, ApJL, 632, L61
- Ogando et al. (2008) Ogando, R. L. C., Maia, M. A. G., Pellegrini, P. S. & da Costa, L. N. 2008, AJ, 135, 2424
- Ogando et al. (2010) Ogando, R. L. C., Maia, M. A. G., Pellegrini, P. S. & da Costa, L. N. 2010, IAUS, 262, 400
- Park & Lee (1997) Park, J.-H. & Lee, Y.-W. 1997, ApJ, 476, 28
- Peletier et al. (1990) Peletier, R. F., Davies, R. L., Illingworth, G. D., Davis, L. E. & Cawson, M. 1990, AJ, 100, 1091
- Peng et al. (2002) Peng, C. Y., Ho, L. C., Impey, C. D. & Rix, H.-W. 2002, AJ, 124, 266
- Peng et al. (2010) Peng, C. Y., Ho, L. C., Impey, C. D. & Rix, H.-W. 2010, AJ, 139, 2097
- Peng & Nagai (2009) Peng, F. & Nagai, D. 2009, ApJL, 705, L58
- Percival & Salaris (2011) Percival, S. M. & Salaris, M. 2011, MNRAS in press (DOI:10.1111/j.1365-2966.2010.18066.x)
- Pipino & Matteucci (2004) Pipino, A. & Matteucci, F. 2004, MNRAS, 347, 489
- Pipino et al. (2006) Pipino, A., Matteucci, F. & Chiappini, C. 2006, ApJ, 638, 739
- Pipino et al. (2008) Pipino, A., D’Ercole, A. & Matteucci, F. 2008, A&A, 484, 669
- Pipino et al. (2010) Pipino, A., D’Ercole, A., Matteucci, F. & Chiappini, C. 2010, MNRAS, 407, 1347
- Proctor & Sansom (2002) Proctor R. N., Sansom A. E., 2002, MNRAS, 333, 517
- Rampazzo et al. (2005) Rampazzo R., Annibali F., Bressan A., Longhetti M., Padoan F., Zeilinger W. W., 2005, A&A, 433, 497
- Rawle et al. (2008) Rawle, T. D., Smith, R. J., Lucey, J. R., Hudson, M. J. & Wegner, G. A. 2008, MNRAS, 385, 2097
- Reda et al. (2007) Reda F. M., Proctor R. N., Forbes D. A., Hau G. K. T., Larsen S. S., 2007, MNRAS, 377, 1772
- Ree et al. (2007) Ree, C. H. et al. 2007, ApJS, 173, 607
- Reimers (1975) Reimers, D. 1975, Mém. Soc. Roy. Sci. Liège, 6th ser., 8, 369
- Sánchez-Blázquez et al. (2007) Sánchez-Blázquez P., Forbes D. A., Strader J., Brodie J., Proctor R., 2007, MNRAS, 377, 759
- Schiavon (2007) Schiavon R. P., 2007, ApJS, 171, 146
- Schlegel et al. (1998) Schlegel, D.J., Finkbeiner, D.P. & Davis, M. 1998, ApJ, 500, 525
- Schweizer (1980) Schweizer, F. 1980, ApJ, 237, 303
- Serra et al. (2008) Serra, P., Trager, S. C., Oosterloo, T. A. & Morganti, R. 2008, A&A, 483, 57
- Sérsic (1963) Sérsic, J. L. 1963, Boletín de la Asociación Argentina de Astronomía, 6, 41
- Sérsic (1968) Sérsic, J. L. 1968, Atlas de Galaxias Australes (Cordoba: Observatorio Astronomico)
- Sikkema et al. (2007) Sikkema, G., Carter, D., Peletier, R.F., Balcells, M., del Burgo, C. & Valentijn, E.A. 2007, A&A, 467, 1011
- Skrutskie et al. (2006) Skrutskie, M. F. et al. 2006, AJ, 131, 1163
- Sohn et al. (2006) Sohn, S. T., O’Connell, R. W., Kundu, A., Landsman, W. B., Burstein, D., Bohlin, R. C., Frogel, J. A. & Rose, J. A. 2006, AJ, 131, 866
- Spolaor et al. (2008) Spolaor M., Forbes D. A., Proctor R. N., Hau G. K. T., Brough S., 2008, MNRAS, 385, 675
- Spolaor et al. (2009) Spolaor, M., Proctor, R. N., Forbes, D. A. & Couch, W. J. 2009, ApJL, 691, L138
- Spolaor et al. (2010) Spolaor, M., Kobayashi, C., Forbes, D. A., Couch, W. J. & Hau, G. K. T. 2010, MNRAS, 408, 272
- Thomas et al. (2003) Thomas, D., Maraston, C. & Bender, R. 2003, MNRAS, 339, 897
- Thomas et al. (2005) Thomas, D., Maraston, C., Bender, R. & Mendes de Oliveira, C. 2005, ApJ, 621, 673
- Tortora et al. (2010) Tortora, C., Napolitano, N. R., Cardone, V. F., Capaccioli, M., Jetzer, Ph. & Molinaro, R. 2010, MNRAS, 407, 144
- Turnbull et al. (1999) Turnbull, A., Bridges, T. J. & Carter, D. 1999, MNRAS, 307, 967
- Wyder et al. (2005) Wyder, T.K., et al. 2005, ApJL, 619, L15
- Yi et al. (1997) Yi, S. K., Demarque, P. & Oemler, A. Jr. 1997, ApJ, 486, 201
- Yi et al. (1999) Yi, S. K., Lee, Y.-W., Woo, J.-H., Park, J.-H., Demarque, P., & Oemler, A. Jr. 1999, ApJ, 513, 128
- Yi (2008) Yi, S. K. 2008, ASP Conference series, 392, 3
Appendix A Surface Brightness and Colour Profiles
In Figures A1 to A13 we present surface brightness and colour profiles for our samples. In these Figures the value of the radius plotted on the horizontal axis is simply the midpoint in radius of the annulus, with no account taken of the increased number of pixels near the outer edge of the annulus, nor the increased weighting of the inner points nearer to the inner edge, which effects tend to cancel out. In each plot the top panel is the K-band surface brightness, the centre panel is (NUV-J) and the lower panel (FUV-NUV). All photometry is corrected for galactic extinction as described in Section 3.1.
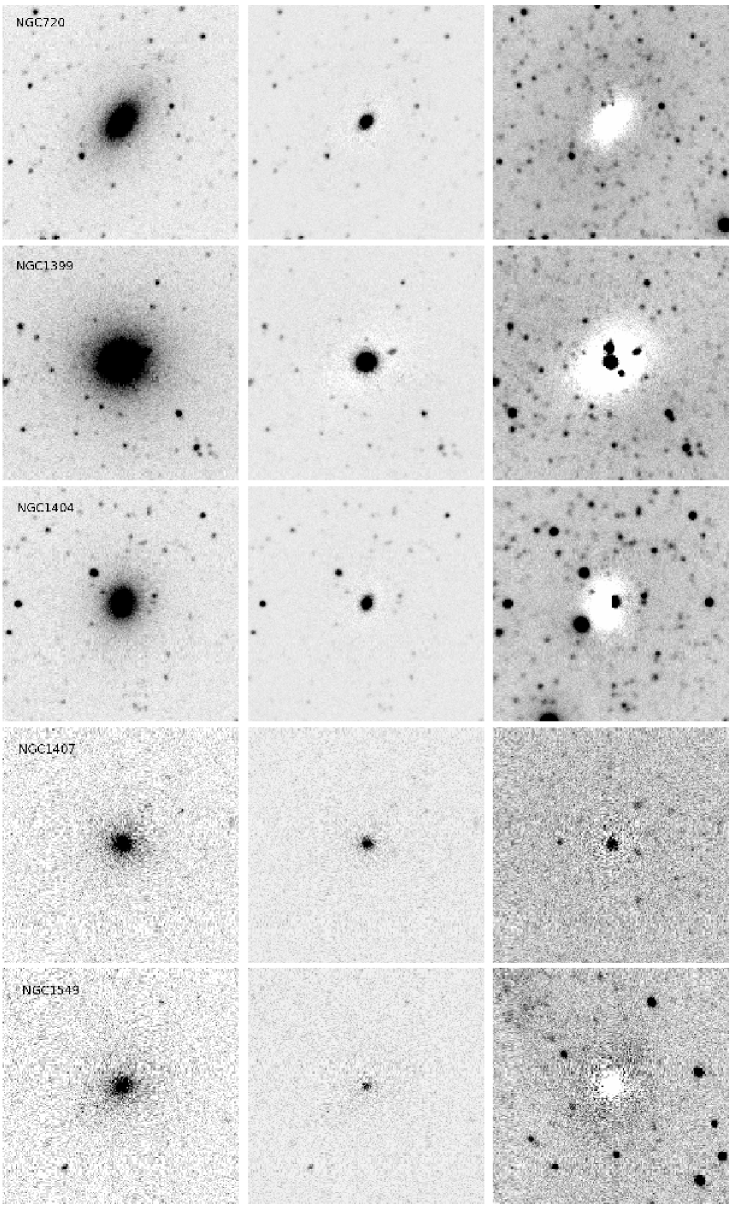
Appendix B Residual Images
In Figures B1 to B6 we present the residual images constructed as described in Section 3.6.
For each galaxy the left image is the NUV image as obtained from the GALEX archive, the centre panel is the residual after subtraction of the
scaled H-band model, and the right panel the NUV image after subtraction of the scaled model. Here we provide comments on the residual
maps of individual galaxies.
NGC720 - The NUV residual is negative, and id dominated by the metallicity gradient. The FUV residual shows an extended and
elongated UV excess distribution, and the effect of the metallicity gradient is also visible as a faint negative region around this.
NGC1399 - The positive residual in the very centre of this galaxy is visible in all passbands, and is due to a poor fit of the Sérsic
function to the surface brightness profile. The fit is also complicated by three other sources close to the core. There is a more extended
excess in teh FUV residual map, and a region of negative residuals due to the metallicity gradient.
NGC1404 - The NUV residual map is dominated by the negative region caused by the metallicity gradient, and a source to the west
of the nucleus. The FUV map shows a somewhat more compact FUV excess region.
NGC1407 - This and subsequent galaxies have much shorter exposures and hence worse signal-to-noise in the residual maps
than the first three. The NGC1407 residual maps show an excess at small radii, in this case the residual occurs in all wavebands and is due to excess
light over the Sérsic fit in the core. The FUV excess in this galaxy is however apparant in the colour gradients.
NGC1549 - This galaxy shows a moderate extended FUV excess, and in the NUV band a negative metallicity gradient residual.
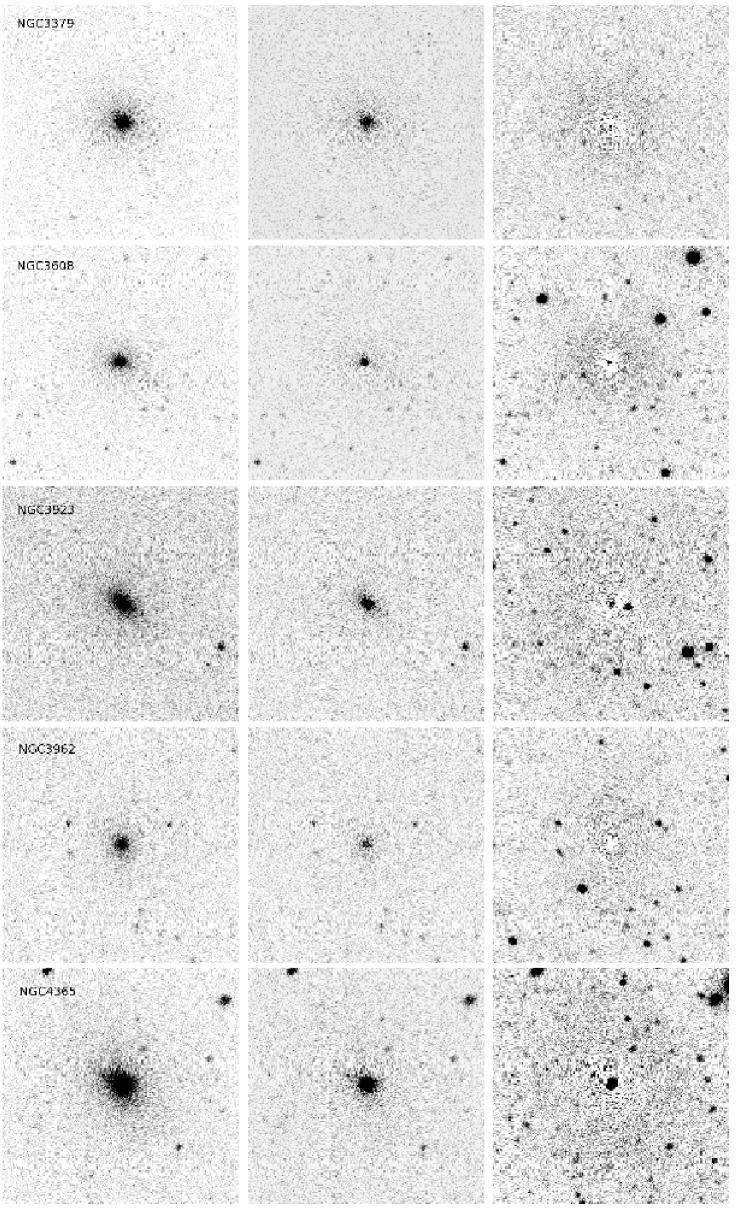
NGC3379 - This also shows an extended FUV excess and a negative NUV residual.
NGC3608 - In addition to the FUV excess, this galaxy shows a point residual in the nucleus in longer bands, it is unclear
whether this is a stellar “extra light” component or a weak nuclear source.
NGC3923 - In this case there is a stronger FUV excess, and a weak positive residual in the nucleus at longer wavebands.
NGC3962 - This galaxy has an extended FUV excess region, and a negative NUV residual in the centre.
NGC 4365 - This galaxy has an extended FUV excess region. The positive residual in NUV is not seen at longer wavelengths,
and we attribute this to a low level of star formation in the core, rather than failure of the Sérsic fit.
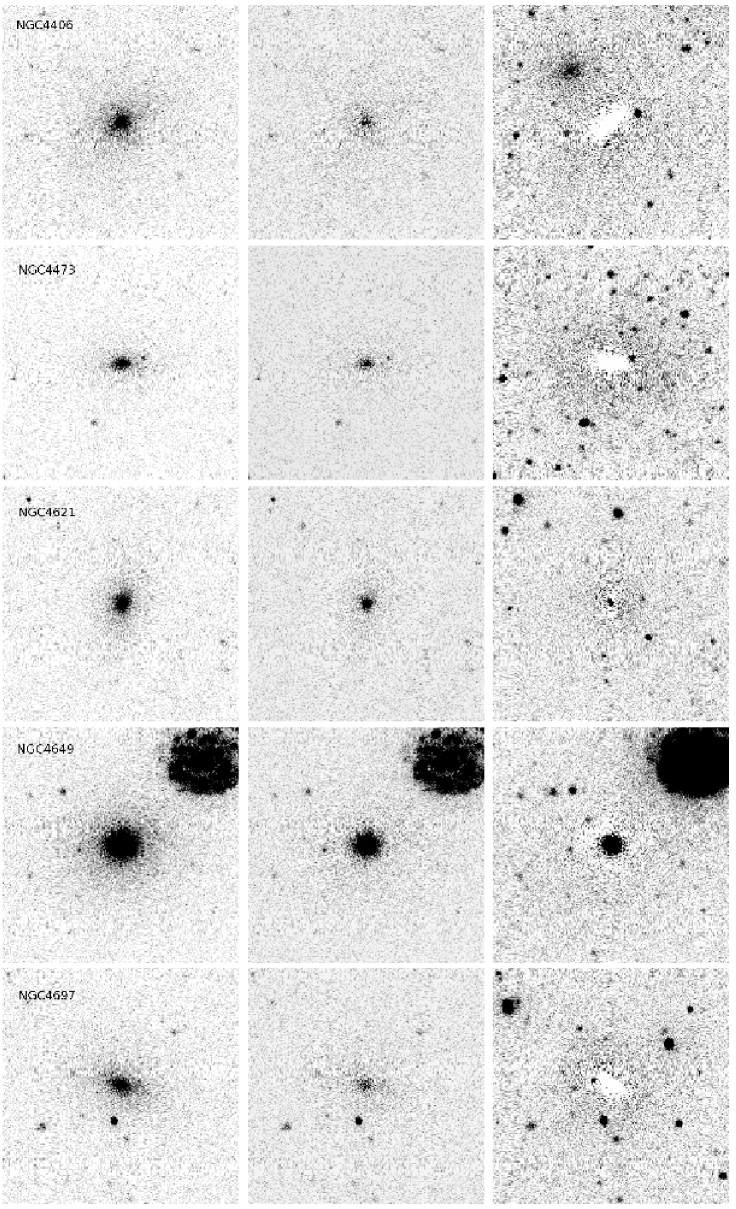
NGC 4406 - There is an extended FUV excess region, and in the NUV image a low surface brightness dwarf elliptical companion (NGC4406B)
to the NE.
NGC4473 - This galaxy has an extended FUV excess region, and a negative NUV residual in the centre.
NGC4621 - There is an extended FUV excess region, and a point residual caused by a poor Sérsic fit in the core.
NGC4649 - The fit to this galaxy is complicated by the close companion (NGC4647). However the extended NUV residual does not
appear to be caused by a poor Sérsic fit in the H-band, but by a low level of ongoing star formation, as suggested by Magris & Bruzual (1993).
NGC4697 - This galaxy has an extended FUV excess region, and a negative NUV residual in the centre.
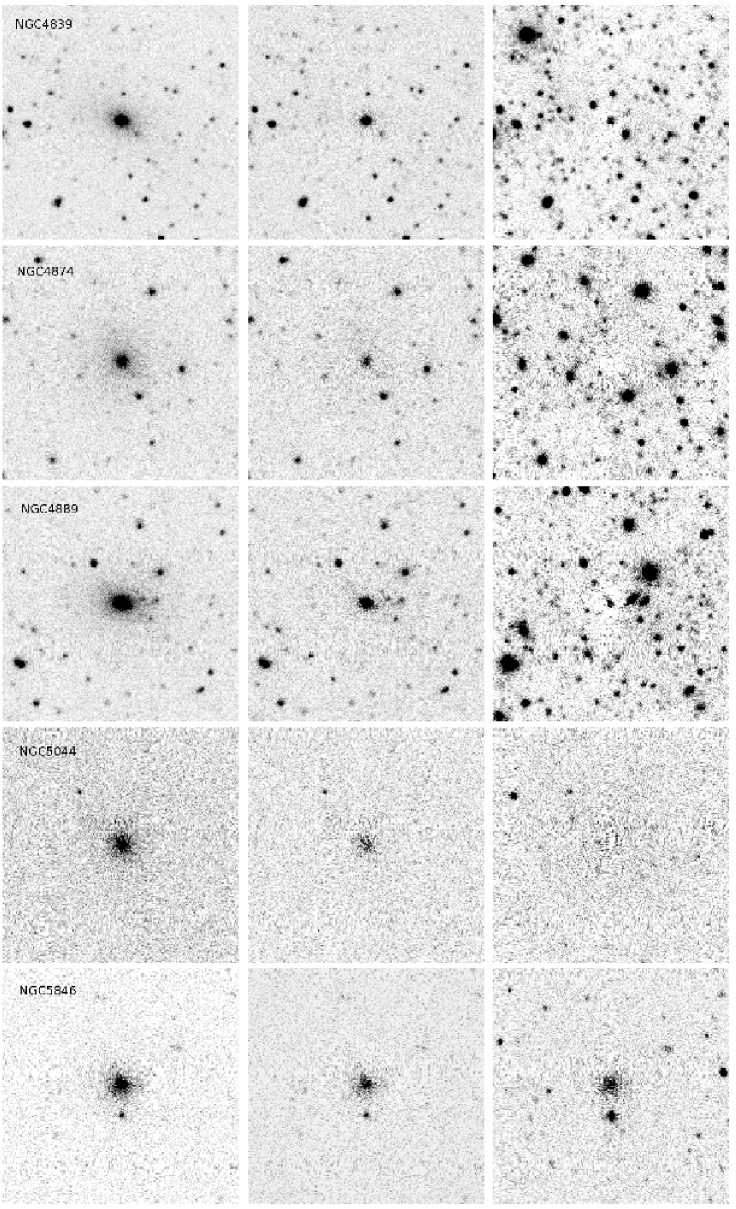
NGC4839 - This galaxy has cD morphology, yet lies in the outer regions of the Coma cluster. It has a clear extended FUV excess region,
and a positive NUV residual which does not appear to be due to a poor Sérsic fit in the core. We suggest that this galaxy, like NGC4649, has a low
level of ongoing star formation in the core.
NGC4874 - This galaxy is in the centre of the Coma cluster and has cD morphology, yet it appears to have only a weak FUV excess.
The there is little residual in NUV.
NGC4889 - This is the brightest galaxy in the Coma cluster, albeit it has elliptical rather than cD morphology. The FUV excess is much stronger
than in NGC4874. The positive residual in NUV is not caused by a poor Sérsic fit in the core, and again we suggest that there may be a low level of star formation
in this galaxy.
NGC5044 - The FUV excess is weak, and there are no clear residuals in the NUV image.
NGC5846 - There is a compact companion (NGC5846A) to the south. Residual maps are similar in FUV and NUV, suggesting
that there is ongoing star formation.
NGC5982 - The FUV excess region is compact, and the NUV residual map shows no structure. There is a faint companion
(SDSS J153839.55+592134.3) to the north.
NGC6868 - The FUV excess is weak and the positive residual seen in the NUV residual image occurs in all wavebands and is
due to a poor fit of the Sérsic function in the core, and will contribute to some extent to the FUV residual image.
NGC1052 - There is an extended FUV excess residual, and in the NUV the Liner in the nucleus shows as a point source.
NGC4261 - This shows a strong extended FUV excess residual, and negative residuals in NUV.
NGC4278 - As with NGC1052 this shows and extended FUV excess residual, and a nuclear NUV residual from the Liner.
NGC4374 - This galaxy has a strong and extended UV excess, and negative residuals due to metallicity in NUV. There is no
indication of any nuclear source.
NGC4486 - M87 shows the well known non-thermal nuclear source and jet in both FUV and NUV. The extended FUV excess
region is also clearly visible.
NGC4552 - In this case it is unclear whether the NUV residual is due to a poor fit of the Sérsic function, or a nuclear source.
The extended FUV excess emission is, however, clear.
IC1459 -The residual in the NUV image occurs also at longer wavelengths, and indicates a poor Sérsic fit. The FUV excess
is, however, stronger and is also extended.
IC4296 -The H-band residual in this galaxy is positive in the very centre, however the observed NUV residual is extended, and
is more likely to be due to ongoing star formation. The FUV residual map is very similar to NUV, and the FUV excess is weak, although the
colour gradient shows that it is present.