Magnetic Fluctuations and Correlations in MnSi
Evidence for a Skyrmion Spin Liquid Phase
Abstract
We present a comprehensive analysis of high resolution neutron scattering data involving Neutron Spin Echo spectroscopy and Spherical Polarimetry which confirm the first order nature of the helical transition and reveal the existence of a new spin liquid skyrmion phase. Similar to the blue phases of liquid crystals this phase appears in a very narrow temperature range between the low temperature helical and the high temperature paramagnetic phases.
I Introduction
MnSi is one of the most investigated chiral magnets and, at least in theory, a very simple realization of chiral magnetism. The Ginzburg-Landau Hamiltonian contains three hierarchically ordered interaction terms with well separated energy scalesBak and Jensen (1980). It is therefore possible to distinguish between the different contributions to the ground state. The strongest ferromagnetic exchange interaction term fixes the spins at the longest range. The weaker Dzyaloshinskii-Moriya (DM) term arises from the lack of inversion symmetry of the B20 lattice structure and rotates the spins at the intermediate scales. And the weakest anisotropy term fixes the directions of the spins on the crystallographic lattice. The magnetically ordered state below T 29 K is a single domain left handed helix with a period of 175 Å . All magnetic moments are perpendicular to the propagation vector that points along the 111 crystallographic directions Shirane et al. (1983); Ishida et al. (1985). In the helical phase small angle neutron scattering shows well defined Bragg peaks of the same intensity at all equivalent magnetic reflections , with = =0.036 Å-1.
MnSi is a weak itinerant magnet with an ordered magnetic moment of only 0.4 , a fraction of the effective magnetic moment of 1.4 determined in the paramagnetic phaseWilliams et al. (1966). The strong magnetic fluctuations, which are due to the weak itinerant magnetism and the vicinity of a magnetic instability, exist not only above TC Ishikawa et al. (1985) but also persist in the low temperature ordered phaseZiebeck et al. (1982). The magnetic fluctuations lead to an enhanced effective electron mass, a broad specific heat maximum reminiscent of the specific heat of spin liquids, frustrated magnets or spin glassesPetrova and Stishov ((2009) and broad features on thermal expansion and ultrasound measurements, which almost completely mask the helical transitionPetrova and Stishov (2009).
One intriguing feature of MnSi is that magnetic correlations above TC appear not only around the positions in reciprocal space of the helical order but spread homogeneously over the whole surface of a sphere with radius emerging as a powder diffraction like ring on the two-dimensional small angle neutron scattering spectraGrigoriev et al. (2005). If the neutron beam is polarized the rings reduce to half-moons due to the interaction between polarized neutrons with the helical correlations as explained below.
This unconventional feature occurs in a limited temperature range above TC and is reminiscent of scattering patterns from cholesteric liquid crystals suggesting the existence of similar textures also in magnets. However, the chiral molecules of liquid crystals are rods whereas magnetic moments are vectors. This additional topological constraint leads to the formation of domain walls rendering disclinations, i.e. the low order line defects commonly found in liquid crystals, energetically unfavorable in magnetsWright and Mermin (1989a). On the other hand, domain wall formation is minimized by higher order skyrmion-like 2 disclinations.
Skyrmions were introduced in the early 60s by Skyrme Skyrme (1961) to bridge the gap between waves and particles in the particle-wave duality description. The existence of these soliton-like quasiparticles was alleged in semiconductors under high magnetic fields Barrett et al. (1995) and their topology corresponds to that of the blue phases of liquid crystals Wright and Mermin (1989b). Periodic skyrmion lattices have recently been identified under a magnetic field in the A-phase of MnSiMühlbauer et al. (2009) or directly seen by Lorentz transmission electron microscopy in Fe0.5Co0.5SiYu et al. (2010a) or FeGeYu et al. (2010b).
It has been suggested that the unconventional diffuse scattering above TC reflects the existence of skyrmion-like textures, which would form spontaneously without any structural defects or an external magnetic fieldRößler et al. (2006) stabilized by spin stiffness or higher order terms Binz et al. (2006); I. Fischer (2008). This novel ground state of condensed matter would result from the isotropically twisted spin liquid phase and as in liquid crystals it would occur at a very restricted temperature range just above the long range ordered helical phase. In the following we present high resolution polarized neutron scattering experimental results, which strongly support this hypothesis.
II Experimental Method
MnSi crystallizes in the cubic () structure with the Mn atoms occupying the 4a site for . The lack of inversion symmetry in the crystallographic structure is at the origin of the DM interaction, the chiral magnetism and the helical magnetic structure. The experiments were done on a well characterized Grigoriev et al. (2005); Okorokov et al. (2005) single crystalline sample with a thickness of 2 mm and a diameter of 20 mm, cut from a large single crystal grown at Ames Laboratory. The lattice constant was 4.558 Å. The sample was oriented with a 110 direction vertical, so that four 111 reflections and two 110 reflections were accessible in the horizontal scattering plane.
The polarized neutron scattering experiments were carried out with the Neutron Spin Echo spectrometers IN11 and IN15 at the Institut Laue Langevin, Grenoble, France. On IN15 the wavelength was 8 Å and on IN11 6.5 Å. At both instruments the incoming neutron beam had a monochromatization of 15% FWHM. The XY position sensitive detectors of both spectrometers covered an angular range of 3x3 deg and the resolution in momentum transfer was 0.005 Å-1 FWHM. On IN11 the dependence of the relaxation and the intensity was analyzed by taking slices of the detector at constant distance from the 000 point and also from the surface of the sphere with radius leading to . The measurements were carried out at one of the four equivalent magnetic reflections 000. On IN11 it was also possible to measure at a 000 point, where the correlations do not develop to a Bragg peak.
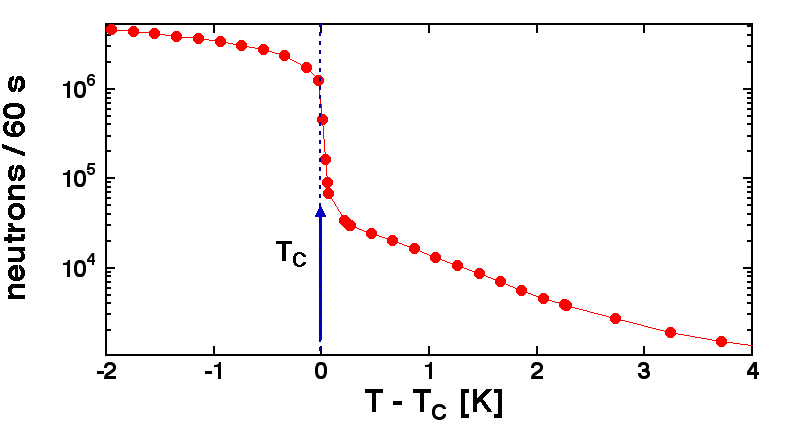
Fig. 2 shows on a log-lin scale the temperature dependence of the neutron intensity at . The helimagnetic phase transition is marked by an intensity jump of more than one order of magnitude within less than 0.1 deg. The data above and below TC follow power laws similar to those found previously Grigoriev et al. (2005) and which were at the origin of a long standing controversy on the order of the transition. These power laws, however, do not account for the intensity jump, which confirms the first order phase transition seen by specific heatStishov et al. (2007).
The intensity jump defines very accurately the transition temperature is TC = 29.05 0.05 K. These data were collected on IN15. A different cryostat and thermometer were used on IN11 and the jump was observed at TC = 28.6 0.05 K. In order to compare the data sets the results will be plotted against T-TC or the reduced temperature (T-TC)/TC.
The helical Bragg peaks are the fingerprint of the helical phase. They are elastic (energy transfer , in the following we will often use to also designate the energy transfer without explicitly using ) and has a Gaussian lineshape. In contrast, the fluctuating paramagnetic phase above TC has finite correlations and the scattering function is a superposition of LorentziansIshikawa et al. (1985); Grigoriev et al. (2005). In the quasi-elastic limit, where the energy transfer is much smaller than the energies of the incoming beam and of the sample, the neutron scattering cross section becomes:
| (1) |
with the Curie constant, , where is the characteristic correlation length, and the HWHM energy linewidth. is therefore the product of the static structure factor, which has the Ornstein-Zernike (OZ) form :
| (2) |
and of the dynamic structure factor:
| (3) |
The dynamic measurements were performed by Neutron Spin Echo spectroscopy, which uses the Larmor precession of the neutron spin in a magnetic field as a clock to measure with very high accuracy the difference in neutron velocities before and after the scattering process at the sample. The changes in the neutron energy due to inelastic scattering affect the neutron velocity and consequently the amplitude of the Larmor precessions. In this way, the energy transfer is measured directly by circumventing the intensity resolution limitations of the Liouville theorem. For this reason NSE reaches very high resolutions while maintaining the high intensity advantage of a beam that is only 10-20% monochromatic. The highest energy resolution in neutron scattering is presently reached by IN15, which accesses energies as low as some neV corresponding to motions with characteristic times reaching the .
At the quasi-elastic limit, which is valid in most NSE experiments, the amplitude of the NSE Larmor precessions is directly proportional to the intermediate scattering function , the Fourier transformation of Mezei (1980). The comparison between NSE and inelastic neutron scattering is therefore straightforward through a Fourier transformation.
| (4) |
Consequently, the Lorentz function of eq. 3 Fourier transforms to the exponential NSE decay with leading to [eV]. With this relation it will be possible to compare our NSE results with the triple axis neutron spectroscopy (TAS) measurements from the literatureIshikawa et al. (1985); Roessli et al. (2002).
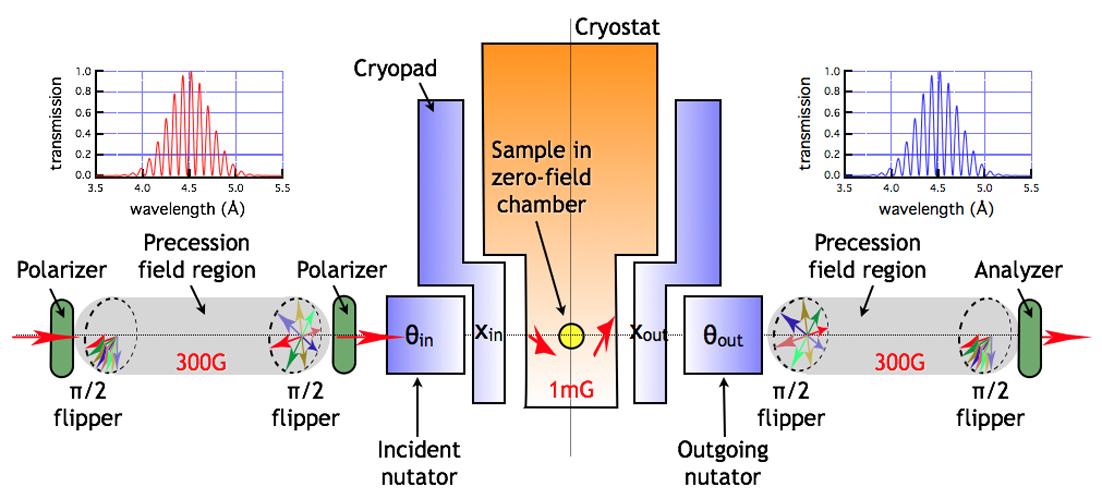
This so-called Larmor labeling requires polarized neutrons and some polarization analysis features are integral part of NSEMurani and Mezei (1980,). The pulse sequence, flip-precession- flip (at the sample)-precession- flip, is that of the classical Hahn sequence of NMR SE. “Normal” paramagnetic scattering acts as a flipper and gives an echo without the otherwise obligatory flipper, which leads to a straightforward and unambiguous separation of the magnetic and nuclear signals. On the other hand, due to Larmor precessions, the neutron beam is depolarized at the sample with all neutron spins evenly distributed in the precession plane. For this reason, in the presence of chiral and/or nuclear-magnetic interference terms the analysis of the experimental results is complex. The way out is the Polarimetric Neutron Spin Echo set-up, a variant of Intensity Modulated NSEFarago and Mezei (1986), which combines the precession field areas required for Neutron Spin Echo spectroscopy with Cryopad Pappas et al. (2008). As shown schematically by fig. 1, the precessions are stopped before the sample by an additional flipper. The neutron beam is then re-polarized with a compact polarizer to allow full analysis of the scattered polarization vector with the zero field chamber of Cryopad. The precessions resume at the second branch of the spectrometer after a second additional flipper and the echo signal is recovered at the neutron detector after the analyzer.
This set-up is now implemented at IN15 and can be used to observe chiral fluctuations with unprecedented accuracy and resolution both in energy (time) and momentum transfer (space). The Polarimetric NSE and spherical polarimetry measurements were performed with a third generation Cryopad, a sensitive zero field polarimeter which controls the polarization of the incoming and the scattered beamsLelièvre-Berna et al. (2005, 2007). A combination of -metal and Meissner shields reduces the residual magnetic field at the sample position down to 0.1 T and controls the direction of the polarization vectors with an accuracy of better than 1 deg. The beam polarization was 96% corresponding to a flipping ratio of 45.
III Polarized Neutron Formalism - Spherical Polarimetry
Before presenting in detail the experimental results we will introduce the interaction between a polarized neutron beam and the magnetic helix of MnSi following the formalism developed almost simultaneously by BlumeBlume (1963) and MaleyevMaleyev et al. (1962) in 1963. The helix is described by two orthogonal vectors and , which have the same amplitude and are perpendicular to the helix propagation vector . The magnetic structure factor for a reflection is given by:
| (5) | |||||
where is the amplitude of the Mn moments, the magnetic form factor of the Mn atoms, an atomic position, and an arbitrary phase angle. As the magnetic interaction vector is the projection of the magnetic structure factor onto a plane perpendicular to the scattering vector , it is convenient to choose the set of orthogonal polarization axes with:
,
perpendicular to the scattering plane and
completing the right-handed cartesian set.
In the geometry of the present experiment = with the propagation vector of the incoming neutron beam. For the polarimetric measurements the MnSi sample was oriented so that and . For this reflection the intensity of the diffracted beam was proportional to:
| (6) |
where is the polarization of the incoming beam. The second term is the chiral part characteristic of the spiral structure and it adds to the conventional first term for i.e. when the incident polarization is parallel to . On the other hand, the reflection is completely extinct for . Following Blume’s equations Blume (1963), the scattered polarization for MnSi is given by:
| (7) |
The first two terms form the ‘trivial’ magnetic part leading to for isotropically distributed electronic magnetic momentsMurani and Mezei (1980,). The chiral third term creates a polarization antiparallel to independently from the polarization state of the incoming beam. Both equations 6 and 7 lead to the rigorous and accurate determination of the chiral component by polarized neutrons. The more general form of eq. 7 is:
| (8) |
with the polarization transfer tensor and the polarization created by the chiral sample. It is then useful to have the incident polarization along , , and and to measure the outgoing polarization components along , and for each configuration of the incident polarization respectivelyBrown (2001). This measurement procedure is characteristic of spherical neutron polarimetry (SNP) and determines the polarization matrix :
| (9) |
where the denominator corrects for the finite efficiency of the neutron polarizer-analyzer system and the intrinsic imperfections of the experimental setup. For nuclear (coherent) scattering , i.e. 1 for and 0 otherwise:
For an ideal paramagnet all matrix elements are zero except :
In MnSi according to eq. 7 the scattered beam will always have a polarization antiparallel to the helix propagation vector, i.e. antiparallel to and . For this reason the first row of the matrix will be non-zero, ideally , with . In its most general form the chiral matrix can be written as:
where determines the chirality of the helix: for right and for left handed chirality. measures the fraction of the dominant chiral domain: = 1 for a single domain and = 0 for equally populated chiral domains or for the disordered paramagnetic state, in which case
reduces to .
The polarization matrix of MnSi below TC is that of an ideal chiral left handed single domain structure. At TC-4 K we found:
Just above TC, the intensity at drops dramatically, which leads to higher counting times and error bars. Nevertheless, the matrix remains unaffected and is that of a perfect left handed single chiral domain up to TC+1, e.g. at TC+0.4 K:
Above TC+1 the non-diagonal elements decrease slowly and chirality remains finite even well above TC. E.g. at TC+4 K we found:
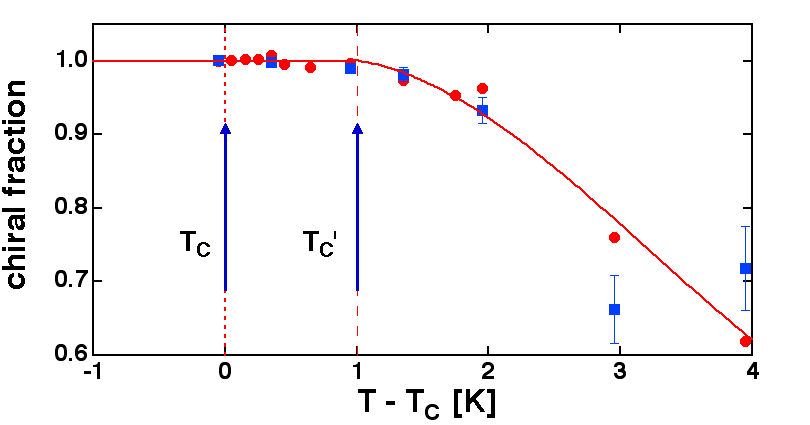
All data have been corrected for the background determined from polarimetric measurements at 50 K. Fig. 3 shows that and are within the error bars unaffected by TC and start to decrease only above TC+1 K. This result is confirmed by the intensity of the reflection when , in which case eq. 6 becomes:
| (10) | |||||
where the sign in front of the chiral contribution, , depends on the direction of (parallel or antiparallel) with respect to . The intensities in the spin flip channel are:
| (11) | |||
The chiral fraction can then be deduced from the ratio
(, with the background determined at 50 K. This method minimizes the error bars and systematic errors because both and are measured under identical conditions. The deduced chiral fraction is also shown in fig. 3 and coincides with the non-diagonal matrix elements.
Thus MnSi remains completely single domain chiral up to TTC+1 K, i.e. in the complete temperature range, where the isotropic scattering at the surface of the sphere with radius is observed. We identify T as the temperature, where the theoretically predicted skyrmion spin liquid phase sets in, and the analysis of the dynamic and static correlations in the following sections will confirm this hypothesis.
IV Neutron Spin Echo
The dynamics of MnSi was thoroughly investigated by triple axis spectroscopy (TAS) in the mid-80s Ishikawa et al. (1985). It was shown that strong magnetic correlations exist up to room temperature and that the magnetic excitation spectrum is well described by the Moriya-Kawabata theory for weak itinerant ferromagnets. The TAS measurements, however, did not have the resolution in energy transfer required to analyse the magnetic fluctuations close to TC. With Neutron Spin Echo spectroscopy we can reach the required resolution, follow very accurately the slowing down of the magnetic fluctuations and complement the TAS experiments. The fact that MnSi is completely chiral above TC was an unexpected outcome of the polarimetric measurements and also a posteriori the justification for combining NSE and Cryopad to polarimetric NSE.
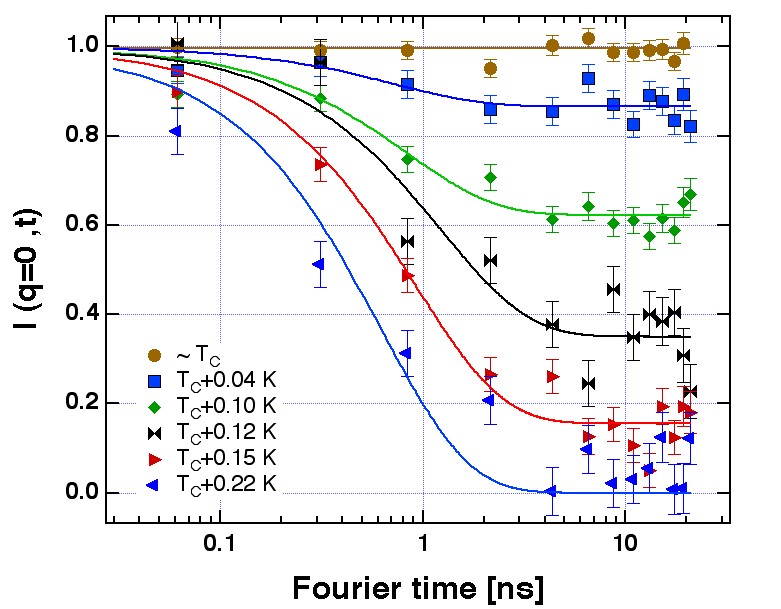
With the Cryopad on IN15 we were able to measure separately the relaxation of the diagonal and of the crossed chiral terms and . The corresponding intermediate scattering functions I(q,t) were obtained by normalizing the spectra against the resolution measured below TC, typically at 25 K. Fig. 4 shows polarimetric NSE spectra for the crossed term at . This was the first time that magnetic chiral fluctuations were measured directly and independently from the trivial diagonal () part.
The polarimetric NSE spectra display a purely exponential relaxation superimposed on an elastic term:
| (12) |
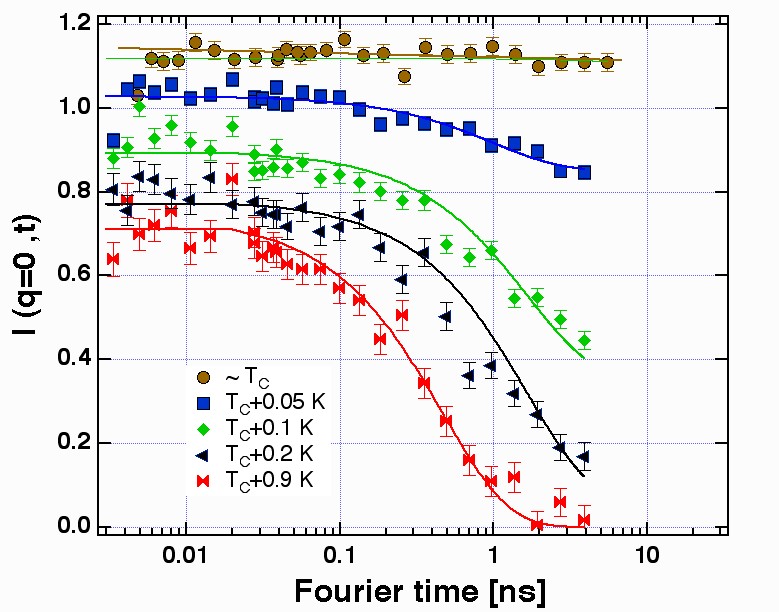
As seen in fig. 4 the elastic fraction evolves from 15% to 100% within 0.15 K following the fast increase of the intensity displayed in fig. 2 and masking the dynamics at TC. This behaviour is confirmed by standard NSE measurements (fig. 5), which however do not extrapolate to 1 at t0. The comparison with polarimetric NSE identifies this as an artefact due to the chiral magnetic scattering and not to additional dynamic components.
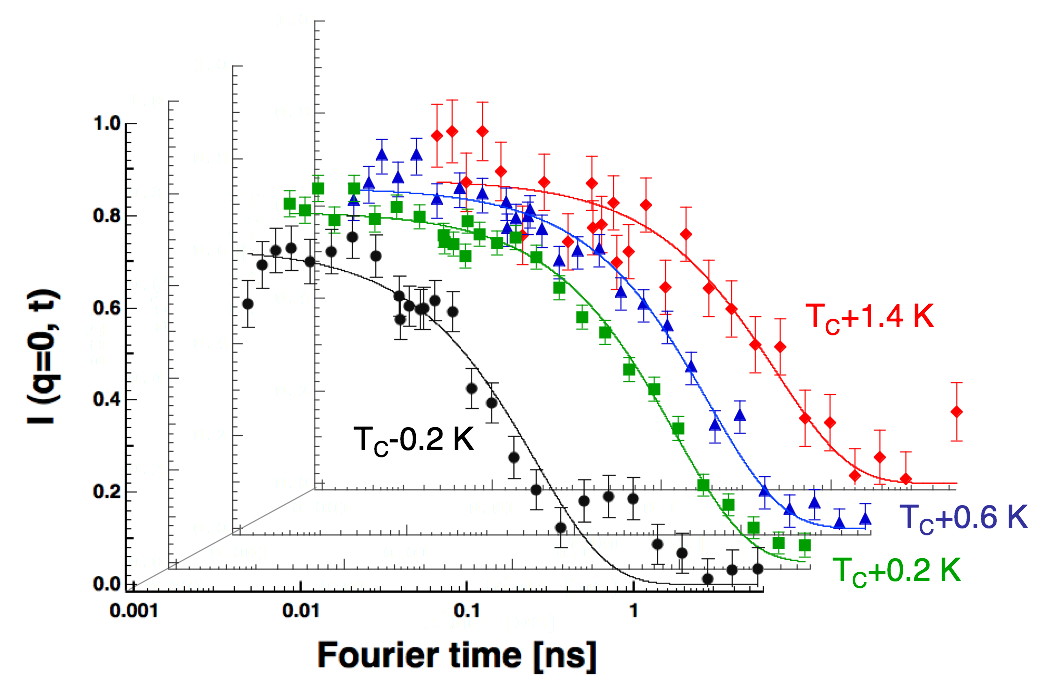
At the quasi-elastic scattering does not develop to a Bragg peak and the NSE spectra were not contaminated by an elastic contribution. Consequently the fluctuations could be followed even below TC (fig. 6). The decay is exponential with the same and deduced as at .
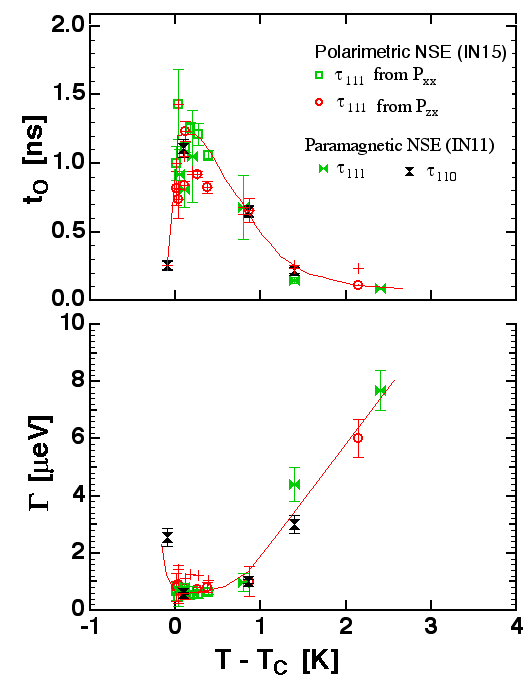
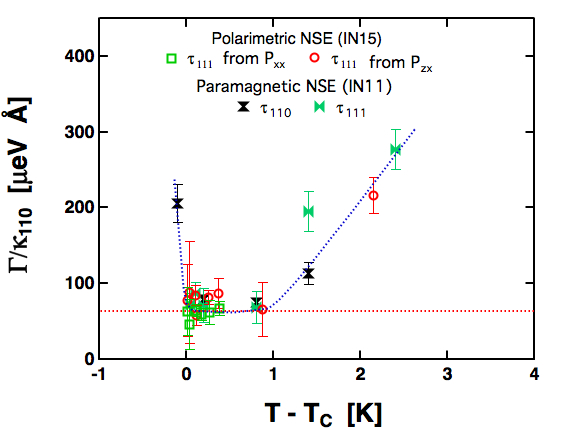
All relaxation times and linewidths at are plotted against temperature in fig. 7. The diagonal () and crossed terms ( and ) measured in the polarimetric NSE mode are also included. All data, even those in the closest vicinity of TC, fall on the same curve. Consequently, the relevant parameter for the fluctuations is the distance from the sphere with radius , not the Bragg peaks of the helical phase.
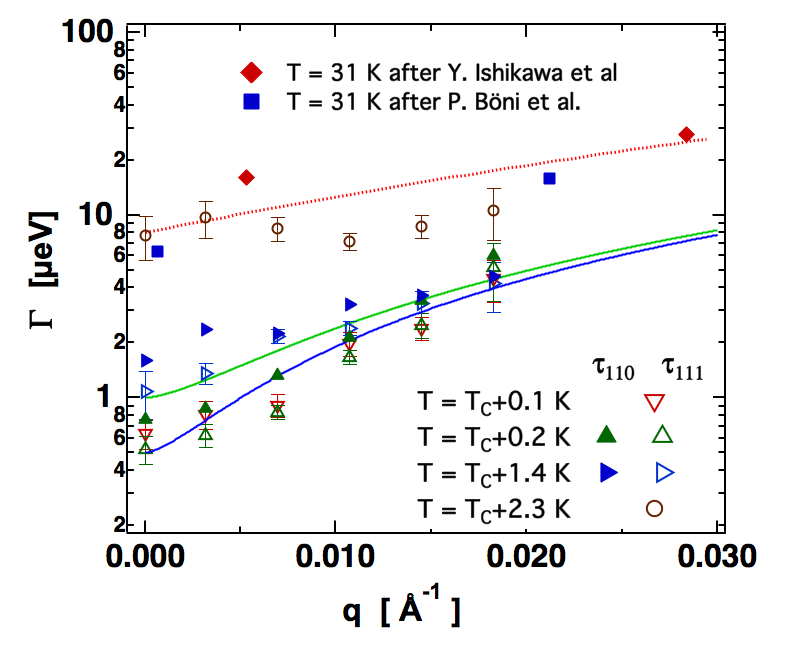
We will now discuss the -dependence of the relaxation. Close to TC the linewidths take their lowest values at the surface of the sphere with radius . We found that increases both for and and the low-q points in fig. 8 are the average for q=0.03 Å -1. However, above TC+1.4 K the q-dependence of flattens and it is no longer possible to identify the position of the minimum.
Close to TC levels off at 0.64 eV, which implies that the associated correlation length does not diverge at TC. The results will be discussed in the frame of dynamic scaling after the determination of the correlation length in the following section.
V Correlation Length
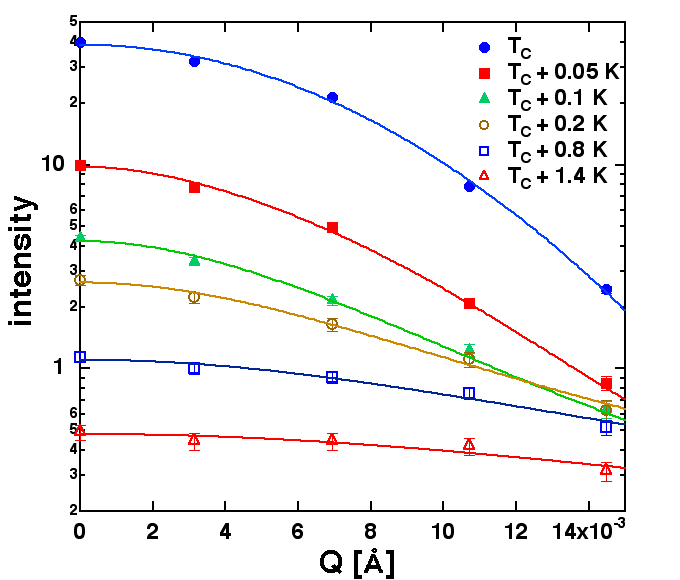
The dependence of the magnetic static structure factor was analysed in the configuration of eq. 11, where the magnetic intensity is maximum and the background correction negligible for T30 K.
Fig. 9 shows the scattered neutron intensity, which is proportional to , around in a log-lin scale. At TC the points are best fitted with by a Gauss function, with Å-1 leading to Å-1 FWHM, i.e. significantly broader than the -resolution of the instrument. Well above TC, the data are well described by the OZ function of eq. 2 convoluted with the Gauss resolution function.
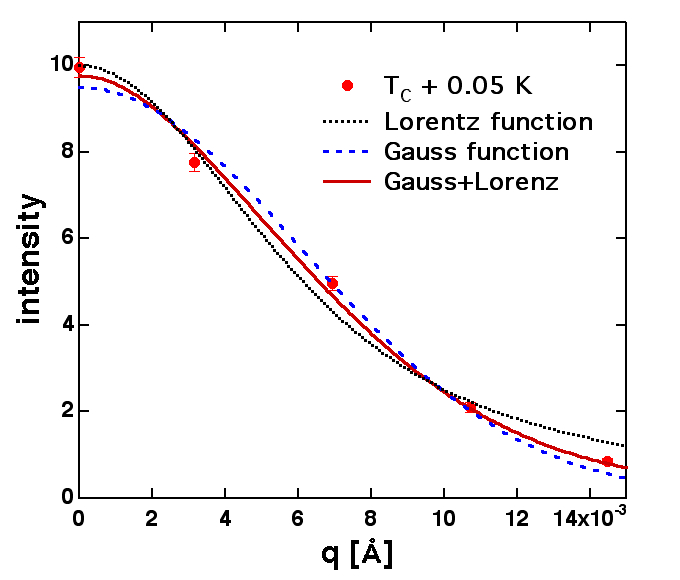
Just above TC, however, neither the Gauss nor the OZ functions fit satisfactorily the experimental data. Instead, the best fit is obtained by a superposition of a fluctuating OZ and an elastic Gauss with relative weights fixed from the NSE spectra, as shown by fig. 10. We note that all three fits in fig. 10 involve the same number (two) of independent parameters: the total intensity and the for the Gauss or for the Lorentz and Gauss+Lorentz fits respectively (in this case the width of the Gauss was fixed to that found below TC).
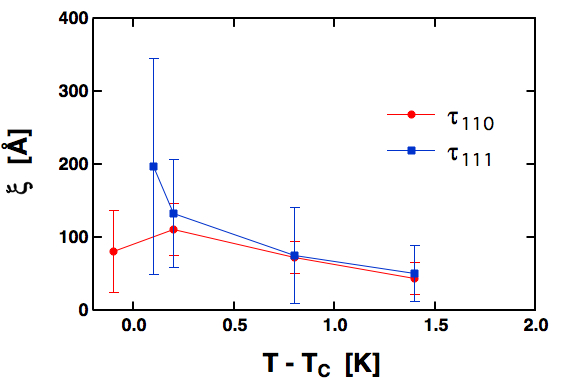
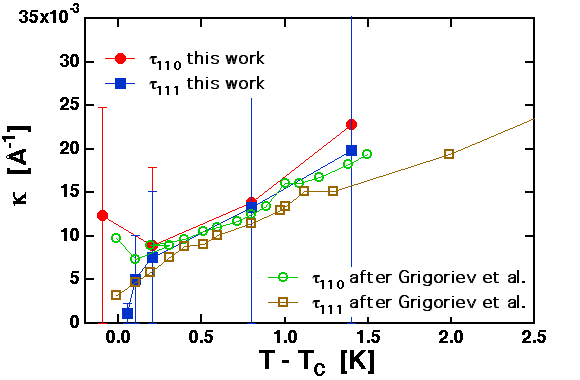
Similarly to the NSE spectra, the data analysis is easier at , where there is no contamination from Bragg peaks. At this position of the reciprocal space a simple Lorentzian describes the scattered neutron intensity at all temperatures, even below TC. All correlation lengths are plotted varsus T-TC in fig. 11 and the deduced values of are in excellent agreement with previous published dataGrigoriev et al. (2005) (fig. 12).
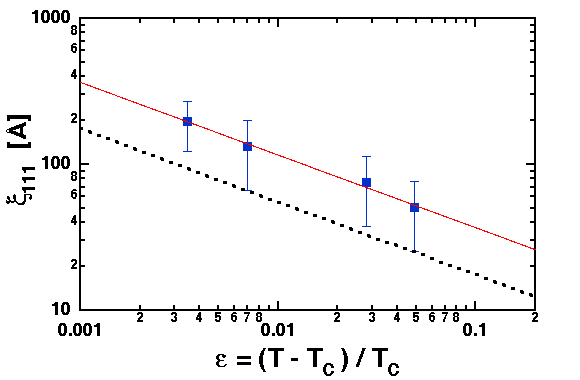
At the correlation length levels off at about 100 Å , i.e. about half the pitch of the helix. At the correlation length increases considerably close to TC following a power law of the reduced temperature similar to those found at second order phase transitions and illustrated by fig. 13. The continuous line in the figure corresponds to:
| (13) |
The black dotted line represents Å, the extrapolated curve from the high temperature TAS data of Ishikawa et al.Ishikawa et al. (1985). It is remarkable that this extrapolation from very high temperatures (100 K - 300 K ) is only a factor 2 off our results.
VI Dynamic Scaling
Dynamic scaling relates to (or inversely to ) through a homogenous function:
| (14) |
with the dimensionless ratio defining the critical () and hydrodynamic () regimes respectivelyHohenberg and Halperin (1977). At the critical limit, which is always reached at =0, the linewidth and relaxation times reflect the volume probed by the measurement :
| (15) |
with the dynamic exponent. For as in ferromagnets , whereas for antiferromagnets and MnSi, where the relevant parameter is , .
At the hydrodynamic limit, and , the dynamics is governed by the correlated volumes through the power laws:
| (16) |
The previous extensive study of spin fluctuations in MnSi with TASIshikawa et al. (1985) showed that the linewidth is equally well described by two universal scaling functions over an extremely large temperature scale, from 30 K up to the room temperature:
| (17) |
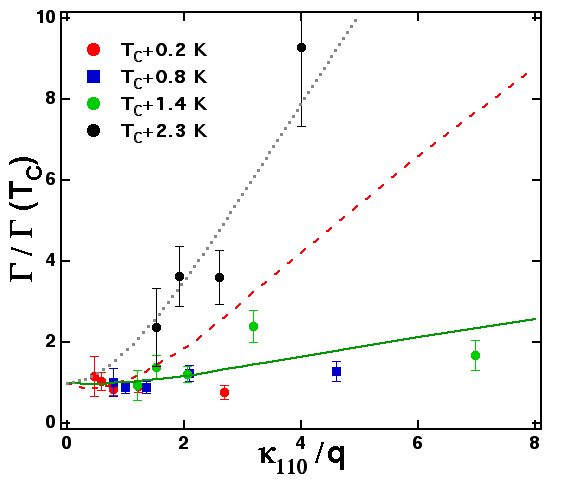
with Å-2, =50 meVÅ3 and A0=19.6 mevÅ5/2. Equation 17 is derived from the Moriya-Kawabata theory for weak itinerant ferromagnetsMoriya and Kawabata (1973) whereas eq. 17 has the form expected for dynamic scaling. The red dotted line going through the data at TC+2.3 K in fig 8 corresponds to the calculated values from eq. 17 and is in excellent agreement with our experimental results.
At high temperatures, the momentum transfer is the relevant parameter and . Close to TC, however, magnetic correlations build up at and the relevant parameter crosses over to , which is used in this work. Consequently also the dynamic critical exponent should cross over from to .
If the transition were of second order, an analysis along the lines of dynamic scaling would imply critical slowing down. In this case should decrease continuously to zero at TC following the divergence of . In contrast, remains finite and strictly the same as . Moreover, fig. 7 and fig. 12 show that close to TC both and are roughly proportional to , not to the “critical” . Consequently, we do not observe the critical slowing down and rapidly changing dynamic behaviour expected for second order phase transitions. This is underlined by fig. 14 where the ratio between all and the calculated levels off to a broad plateau between TC and T, pointing towards .
Fig. 15 shows the interdependence of the reduced dimensionless quantities T and /q.
Following the scaling assumption of eq. 14 all experimental data should collapse on a universal curve. This is obviously not the case. Close to TC both and do not vary with temperature and for this reason the data accumulate on the green continuous line of fig. 15, which is significantly different from the Resibois-Piette function for antiferromagnetsR sibois and Piette (1970). Above T there is a fast change of behaviour crossing over to eq.17 and the black dotted line in fig. 15.
VII Discussion
These high resolution neutron scattering data confirm the first order nature of the helical transition in MnSi seen by specific heat and ultrasonic attenuation measurementsStishov et al. (2007); Petrova and Stishov ((2009). In favour of the first order phase transition are:
a. the sharpness of the transition (fig. 2), even though the helical Bragg peaks are not resolution limited.
b. the coexistence of high and low temperature phases between TC and TC+0.2 K. At the NSE spectra are the superposition of a fluctuating and elastic part (fig. 4 and 5) and the static structure factor is best described by the superposition of a Lorentzian (fluctuating) and Gaussian (elastic) contributions (fig. 10).
c. the absence of critical slowing down at TC. The slow change of the dynamics scales with the non diverging correlation length .
Fluctuations are present above TC and can indeed be approximated by a power law (eq. 13 and fig. 13). For this reason, a selection of experimental data can always be bent to fit into the second order phase transition scheme by introducing crossovers, as it was recently done by Grigoriev at al.Grigoriev et al. (2010). However, second order phase transitions are global transformations involving all parameters of the system, and this is not the case in MnSi.
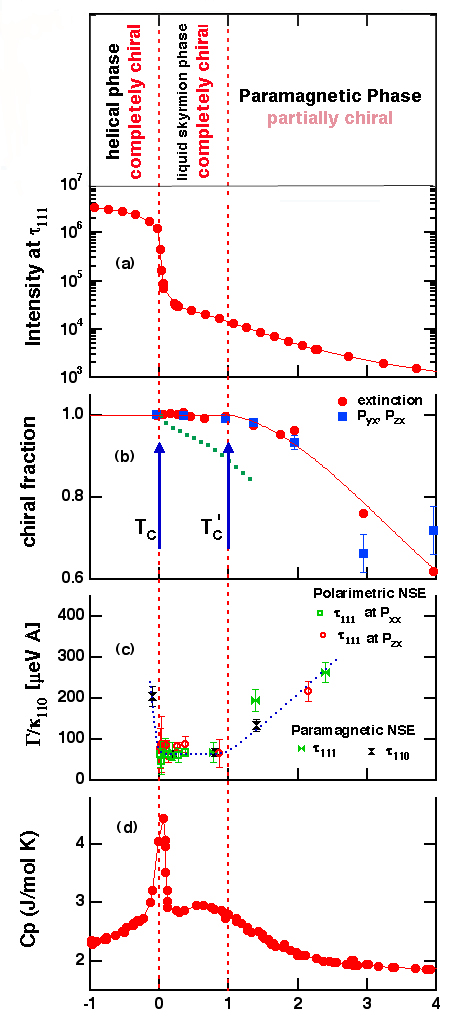
We will now proceed to the discussion of the fluctuating phase between TC and T. Fig. 16 recapitulates the most important findings of this work including the specific heat measured by Stishov et al.Stishov et al. (2007). The first order helical transition TC is marked by the sharp peak in the specific heat (fig. 16d) and the Bragg peak (fig. 16a). However, the helical transition has no effect on , the degree of single domain chirality. Comparison with theory shows that this is not a trivial effect. can indeed be calculated in the frame of a simple mean field modelGrigoriev et al. (2005) :
| (18) |
The measured lead to the dotted green line of fig. 16b, which is significantly different from the experimental data. Consequently, the simple assumption of an unpinned and fluctuating helical phase is not confirmed by the experiment. In contrast, =1 implies a high degree of chiral short range order for the fluctuating phase between TC and T.
T is exactly the theoretically predicted temperature for the formation of a skyrmionic ground state in MnSiRößler et al. (2006). Fig. 16 shows that this is not a singular event but part of a global transformation involving the dynamics as well as a broad maximum in the specific heatStishov et al. (2007). Besides specific heat, thermal expansion, sound velocity, sound absorption as well as resistivity measurements point towards a non trivial spin liquid phase Petrova and Stishov (2009). Skyrmions account for the inherent topology of this completely chiral spin liquid phase, which gives a scattering with rotational symmetry. Skyrmionic textures are energetically favourable at short distances, which explains the slow decrease of and its finite value well above TC. The correlation length gives a natural measurement of the skyrmion radius, which peaks are about half of the helix pitch close to TC, in agreement with the skyrmion hypothesis.
The Bragg peak of fig. 16a is a direct measurement of the helical order parameter. We speculate that in fig. 16b reflects the order parameter of the skyrmion spin liquid phase. The topology of skyrmions would explain the particular dynamics and the low dynamic exponent of . This skyrmion liquid phase would then be the magnetic equivalent of the blue phases in liquid crystals, which occur at a very limited temperature range above the helical phase. In this way the phase diagram of MnSi becomes very similar to that of cholesteric liquid crystals, emphasizing the parallel between magnetic and structural ground states. Similarly to liquid crystals, the transition to the helical state is of first order due to the different topologies of the helical and skyrmionic phases.
In summary, we combined high resolution neutron spin echo spectroscopy and spherical polarimetry to obtain a consistent picture of the spin liquid phase of MnSi above TC. The results evidence a first order transition between the helical phase and a skyrmion liquid phase. This completely (single domain) chiral and strongly fluctuating new state of matter occurs in a narrow temperature range above the helical phase of MnSi.
Acknowledgements.
C.P. thanks P. Böni, U. Rössler and E.L.-B. thanks P.J. Brown for fruitful discussions. The authors acknowledge the support of the ILL technical teams in particular E. Bourgeat-Lami, C. Gomez and E. Thaveron. Special thanks go to Thomas Krist for the compact solid state polarizer, which enabled the polarimetric NSE measurements. This project was partly supported by the European Commission under the 6th Framework Programme through the Key Action: Strengthening the European Research Area, Research Infrastructures. Contract no: RII3-CT-2003-505925.”References
- Bak and Jensen (1980) P. Bak and M. H. Jensen, J. Phys. C 13, L881 (1980).
- Shirane et al. (1983) G. Shirane et al., Phys. Rev. B 28, 6251 (1983).
- Ishida et al. (1985) M. Ishida et al., Phys. Soc. Jpn. 54, 2975 (1985).
- Williams et al. (1966) H. J. Williams et al., Journal of Applied Physics 37, 1256 (1966).
- Ishikawa et al. (1985) Y. Ishikawa et al., Phys. Rev. B 31, 5884 (1985).
- Ziebeck et al. (1982) K. R. A. Ziebeck et al., Z. Phys. B 48, 241 (1982).
- Petrova and Stishov ((2009) A. E. Petrova and S. M. Stishov, J. Phys.: Condens. Matter 21, 196001 ((2009)).
- Petrova and Stishov (2009) A. E. Petrova and S. M. Stishov, J. Phys.: Condens. Matter 21, 196001 (2009).
- Grigoriev et al. (2005) S. V. Grigoriev et al., Phys. Rev. B 72, 134420 (2005).
- Wright and Mermin (1989a) D. C. Wright and N. D. Mermin, Rev. Mod. Phys. 61, 385 (1989a).
- Skyrme (1961) T. Skyrme, Proc. R. Soc. Lond. Ser. A 260, 127 (1961).
- Barrett et al. (1995) S. E. Barrett et al., Phys. Rev. Lett. 74, 5112 (1995).
- Wright and Mermin (1989b) D. Wright and N. Mermin, Rev. Mod. Phys. 61, 385 (1989b).
- Mühlbauer et al. (2009) S. Mühlbauer et al., Science 323, 915 (2009).
- Yu et al. (2010a) X. Z. Yu, Y. Onose, N. Kanazawa, J. H. Park, J. H. Han, Y. Matsui, N. Nagaosa, and Y. Tokura, Nature 465, 901 (2010a).
- Yu et al. (2010b) X. Z. Yu, N. Kanazawa, Y. Onose, K. Kimoto, W. Z. Zhang, S. Ishiwata, Y. Matsui, and Y. Tokura, Nature Materials 10, 106 (2010b).
- Rößler et al. (2006) U. K. Rößler et al., Nature 442, 797 (2006).
- Binz et al. (2006) B. Binz, A. Vishwanath, and V. Aji, Phys. Rev. Lett. 96, 207202 (2006).
- I. Fischer (2008) A. R. I. Fischer, N. Shah, Phys. Rev. B 77, 024415 (2008).
- Pappas et al. (2009) C. Pappas, E. Lelièvre-Berna, P. Falus, P. M. Bentley, E. Moskvin, S. Grigoriev, and B. Farago, Phys. Rev. Lett. 102, 197202 (2009).
- Roessli et al. (2002) B. Roessli et al., Phys. Rev. Lett. 88, 237204 (2002).
- Mezei (1980) F. Mezei, Neutron Spin Echo, vol. 128 of Lecture Notes in Physics (Springer Verlag, Berlin, 1980).
- Mezei (1982) F. Mezei, Phys. Rev. Lett. 49, 1096 (1982).
- Lelièvre-Berna et al. (2005) E. Lelièvre-Berna et al., Physica B 356, 131 (2005).
- Brown (2001) P. J. Brown, Physica B 297, 198 (2001).
- Okorokov et al. (2005) A. I. Okorokov et al., Physica B 356, 259 (2005).
- Murani and Mezei (1980,) A. Murani and F. Mezei, Neutron Spin Echo, vol. 128 of Lecture Notes in Physics (Springer Verlag, Berlin, 1980,).
- Farago and Mezei (1986) B. Farago and F. Mezei, Physica B 136, 627 (1986).
- Pappas et al. (2008) C. Pappas, E. Lelièvre-Berna, P. Bentley, E. Bourgeat-Lami, E. Moskvin, M. Thomas, S. Grigoriev, and V. Dyadkin, Nucl. Inst. and Methods in Phys. Res. A 592, 420 (2008).
- Lelièvre-Berna et al. (2007) E. Lelièvre-Berna et al., Physica B 397, 120 (2007).
- Stishov et al. (2007) S. M. Stishov et al., Phys. Rev. B 76, 052405 (2007).
- Blume (1963) M. Blume, Phys. Rev. 130, 1670 (1963).
- Maleyev et al. (1962) S. Maleyev et al., Fiz. Tv. Tela 4 4, 3461 (1962).
- Böni et al. (2006) P. Böni et al., E21 Annual report (TU München, 2006).
- Hohenberg and Halperin (1977) P. Hohenberg and B. Halperin, Rev. Mod. Phys 49, 435 (1977).
- Moriya and Kawabata (1973) T. Moriya and A. Kawabata, J. Phys. Soc. Japan 34, 63 (1973).
- R sibois and Piette (1970) P. R sibois and C. Piette, Phys. Rev. Lett. 24, 514 (1970).
- Grigoriev et al. (2010) S. V. Grigoriev et al., Phys. Rev. B 81, 144413 (2010).