Stellar populations of ultraluminous infrared galaxies
Abstract
Ultraluminous infrared galaxies (ULIRGs) have several types according to dominance of starburst or AGN component. We made stellar population analysis for a sample of 160 ULIRGs to study the evolution of ULIRGs. We found that the dominance of intermediate-age and old stellar populations increases along the sequence of HII-like ULIRGs, Seyfert-HII composite ULIRGs, and Seyfert 2 ULIRGs. Consequently the typical mean stellar age and the stellar mass increase along the sequence. Comparing the gas mass estimated from the CO measurements with the stellar mass estimated from the optical spectra, we found that gas fraction is anti-correlated with the stellar mass. HII-like ULIRGs with small stellar masses do not possess enough gas and the total mass, and therefore have no evolution connections with massive Seyfert 2 ULIRGs. Only massive ULIRGs may follow the evolution sequence toward AGNs, and massive HII-like ULIRGs are probably in an earlier stage of the sequence.
Subject headings:
galaxies: infrared — galaxies: evolution — galaxies: starburst — galaxies: stellar content1. Introduction
Ultraluminous infrared galaxies (ULIRGs) are advanced mergers of gas-rich galaxies. They have an infrared luminosity greater than 1012 L⊙ in 8-1000 m band (e.g. Sanders & Mirabel, 1996; Lonsdale et al., 2006). Their high infrared luminosity comes from violent starbursts with significant contribution from active galactic nuclei (AGNs) in some ULIRGs (e.g. Farrah et al., 2003).
ULIRGs can be classified according to dominance of starburst or AGN component, namely as the HII-like ULIRGs, LINER ULIRGs, Seyfert-HII composite ULIRGs, Type 1 ULIRGs and Seyfert 2 ULIRGs. Sanders et al. (1988a, b) proposed an evolutionary scenario of ULIRGs from cool-ULIRGs to warm-ULIRGs and finally to QSOs. The cool-ULIRGs have and are preferably star-forming galaxies (Heckman et al., 1987), i.e. the HII-like galaxies. Here and are flux densities at 25 and 60 , respectively. The warm-ULIRGs have and preferably host an AGN (de Grijp et al., 1985; Beichman et al., 1986). ULIRGs are important to understand the evolution of merger galaxies and the possible connections between the starburst and AGNs. Further imaging and spectroscopy studies (e.g. Surace et al., 1998; Surace & Sanders, 1999; Surace et al., 2000; Lípari et al., 2003; Schweitzer et al., 2006; Netzer et al., 2007; Veilleux et al., 2009) and numerical simulations (e.g. Kormendy & Sanders, 1992; Springel et al., 2005; Naab et al., 2006) support this evolutionary scenario. However, this standard evolution sequence is questioned by Colina et al. (2001); Genzel et al. (2001); Tacconi et al. (2002); Rodríguez Zaurín et al. (2010).
If the standard evolutionary scenario is true, ULIRGs should experience the continuing conversion of gas component to stellar populations in their lifetime. ULIRGs in the earlier evolutionary stage are expected to possess more gas and young stars, less old stellar populations, smaller stellar mass and larger gas mass fraction, compared with those of ULIRGs in a later evolutionary stage. There should be enough gas in early stage ULIRGs to be converted into stars when they evolve to a later stage for a larger stellar mass.
The stellar population analysis of ULIRGs can shed light on ULIRG evolution. Previous such analyses were only carried out on very small samples (e.g. Canalizo & Stockton, 2000b, a, 2001; Rodríguez Zaurín et al., 2007, 2008; Soto & Martin, 2010). A slightly larger sample of 36 local ULIRGs was studied by Rodríguez Zaurín et al. (2009, 2010). In contrast to the standard evolutionary scenario, their stellar population analysis based on the optical spectra exhibits no significant differences of the stellar ages among the HII-like ULIRGs, LINER, and Seyfert 2 ULIRGs. Note that the physical parameters of ULIRGs are rather scatter (e.g. Veilleux et al., 2009), therefore, the possible evolutionary of ULIRGs can not be revealed if only a small sample is applied to.
In this work, we analyse the spectra of 160 ULIRGs available from the Sloan Digital Sky Survey (SDSS, Abazajian et al., 2009) for stellar populations. In Section 2, we introduce our ULIRG sample. The stellar population analysis of the sample is presented in Section 3. In Section 4, we discuss the inferred stellar age, mass and gas for different types of ULIRGs. Several factors which affect our analysis are discussed in Section 5, and conclusions are given in Section 6.
In this paper, we adopt = 70 km s-1 Mpc-1, and .
2. The ULIRG sample
For reliable stellar population analysis, we work on a large sample of ULIRGs which have optical spectra covering the wavelength regions of 4000 break and strong stellar absorptions near 4000 .


The SDSS database (DR7, Abazajian et al., 2009) released the spectra of more than 920,000 galaxies in the range of 3800 to 9200 in the observer frame. Following the procedures described in Hou et al. (2009), we found 398 ULIRG candidates from the SDSS DR7 spectral catalog (Abazajian et al., 2009) and IRAS Faint Sources Catalog (Moshir et al., 1992). We checked them from NASA/IPAC Extragalactic Database (NED) and SDSS images. We found that 38 of them are wrong identifications of ULIRGs due to either the known redshift of a ULIRG in the NED not consistent with the redshift from the SDSS database or an obviously nearby large bright galaxy as an IRAS source but with a mis-matched SDSS redshift. The spectra of 360 identified ULIRGs are then fitted and classified (Hou et al., 2009). Among them, 73 ULIRGs have broad lines and are of Type 1, and 287 objects are narrow-line ULIRGs. We will not work on Type 1 ULIRGs for stellar population studies in this paper because their spectra are dominated by strong AGN features (e.g. the power-law continuum, the strong and broad emission lines, the strong FeII features).
Based on the line ratios in the BPT diagrams (see Figure 1, Baldwin et al., 1981; Kewley et al., 2006), 185 of 287 narrow-line ULIRGs are further classified as 32 HII-like ULIRGs, 77 Seyfert-HII composite ULIRGs, 48 Seyfert 2 ULIRGs, 6 LINER ULIRGs, and 22 ambiguous objects. We omitted the other 102 narrow-line ULIRGs from stellar population analysis, because one or more lines either are redshifted outside the wavelength range or do not have a good signal-to-noise ratio for the classification in the BPT diagrams. We also discarded 22 ambiguous ULIRGs for our analysis because they are shown as one type in one BPT diagram but another type in the other diagram(s). Three Seyfert-HII composite ULIRGs are further skipped because more than half of pixels in their SDSS spectra are masked as bad. Therefore, we will study the stellar populations of 160 well-classified ULIRGs. Their redshift distribution is shown in Figure 2.
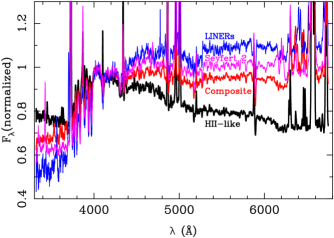
In Figure 3 we show the combined spectra for four types of narrow-line ULIRGs. The spectrum of every ULIRG is first normalized by the median flux in the wavelength – . The combined spectra are the weighted mean of the normalized spectra according to their signal-to-noise ratio in the wavelength range of – in the rest frame. The combined spectra clearly show that along the sequence of HII-like, Seyfert-HII composite, Seyfert 2, and LINER ULIRGs, the normalized continuum fluxes below 4000 decrease and the fluxes above 4000 increase, which roughly indicates that the fraction of old stellar populations increases along the sequence.
3. Stellar population analysis
The stellar population analysis is an important tool to study star formation in galaxies and evolution of galaxies. It has been applied to various type of galaxies, e.g. HII galaxies (e.g. Schmitt et al., 1996; Westera et al., 2004), AGNs (e.g. Cid Fernandes et al., 2004a, b), infrared selected galaxies (Chen et al., 2009, 2010), ULIRGs (e.g. Rodríguez Zaurín et al., 2010; Meng et al., 2010). Here, we use it for a large ULIRG sample to study the evolution sequence of ULIRGs.
We noticed that the fiber diameter of SDSS spectrograph is , corresponding to 3 kpc for a galaxy at redshift or kpc at . For any galaxies with different redshifts, the observed spectrum comes from central regions of different size. We use the software, STARLIGHT 111http://www.starlight.ufsc.br ( version 04, Cid Fernandes et al., 2005; Mateus et al., 2006; Asari et al., 2007), to analyze the stellar populations of ULIRGs in the central regions. We will discuss the aperture effect later.
The STARLIGHT fits an observed galaxy spectrum with a combination of simple stellar populations (SSPs). The intrinsic extinction due to the foreground dust in the host galaxy is considered and parameterized by the -band extinction . The line-of-sight stellar motions are modeled by a Gaussian distribution centered at the velocity and with the dispersion . The modeled spectrum is described by:
| (1) |
where is the synthetic flux normalized at , is the fractional contribution of the th SSP to the model flux at , is the normalized spectrum of the th SSP, and is the reddening term. The best fitting to search for the minimum , where is the weight factor, and is the uncertainty of observed spectrum given in the SDSS database. We used a base of SSPs with different ages and metallicities from the evolution synthesis models of Bruzual & Charlot (2003), and adopted the initial mass function from Chabrier (2003) and the Padova 1994 evolutionary tracks (Alongi et al., 1993; Bressan et al., 1993; Fagotto et al., 1994; Girardi et al., 1996) and STELIB library (Le Borgne et al., 2003). The base comprises of star population with 15 different ages between 1 Myr to 13 Gyr at each of the three metallicities: 0.2, 1, and 2.5 Z⊙. Here Z⊙ is the metallicities of the Sun. The reddening law of Calzetti et al. (1994) is adopted in the fitting.
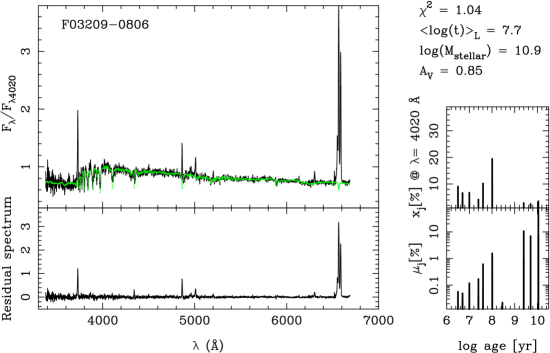
We obtained the spectra with uncertainties of 160 ULIRGs from SDSS. We corrected the Galactic reddening effect, and converted each spectrum to the rest-frame. The STARLIGHT was used to fit the continuum and absorption features. The emission lines and sky lines are discarded in the mask file of STARLIGHT. The spectrum pixels without error measurements or with negative flux values are excluded. In addition, the Na D doublet, , and other three bands, , , and are also masked, due to the bugs in SSP model (Le Borgne et al., 2003) or the large fitting residual in some regions (Mateus et al., 2006). Considering the redshift coverage of our sample, we restricted the fitting in the wavelength range for each spectrum. A power-law component, , is used in the STARLIGHT to account the AGN contribution to the observed continuum (Cid Fernandes et al., 2004b, 2005), and (Richstone & Schmidt, 1980; Cid Fernandes et al., 2004b) is adopted. The random Markov Chains method was used in the STARLIGHT, which needs an input of integer seed. Different seeds slightly affect the fitting results. Following Meng et al. (2010), we fit each spectrum 100 times with different seeds. The final fitted parameters are the mean values from 100 runs. One example of the spectrum fitting is shown in Figure 4.
| Type | young | intermediate-age | old | power-law |
|---|---|---|---|---|
| ( yr) | ( yr) | ( yr) | ||
| HII-like | 0.622 | 0.261 | 0.117 | |
| Composite | 0.355 | 0.408 | 0.138 | 0.099 |
| Syefert 2 | 0.177 | 0.500 | 0.198 | 0.125 |
| LINER | 0.112 | 0.579 | 0.261 | 0.048 |

The stellar populations in a galaxy can be described by the fractions of young stars of yr, intermediate-age stars of yr yr, and old stars of yr (Cid Fernandes et al., 2005). Here is the age of the th SSP. We obtain the fractional contributions of these three stellar populations of different ages and the power-law contribution to the model spectrum flux at 4020 . For each type of ULIRGs, we got their means as given in Table 1. Because there are only a small number (only 6) of LINER ULIRGs, we will not discuss their stellar population in the following.
The fractional contributions ( i.e. in Equation 1) of these stellar populations to the total stellar emission are shown in Figure 5. We found that they are very different for different types of ULIRGs. The young stellar population is more dominant for the HII-like ULIRGs than the composite and Seyfert 2 ULIRGs. The stellar populations of intermediate-age and old stars are more dominant in the Seyfert 2 ULIRGs than HII-like and composite ULIRGs. The older stellar populations and the significant power-law component in Seyfert 2 ULIRGs suggest that they are at a more evolved stage in the evolution track towards AGNs. The fraction distribution of stellar populations of composite ULIRGs suggests that they are at the transitional stage between HII-like and Seyfert 2 ULIRGs.
4. Physical parameters of different types of ULIRGs
The results of stellar population analysis of ULIRGs suggest the possible evolution sequence from HII-like, composite, to Seyfert 2 ULIRGs. The HII-like ULIRGs are at an earlier evolutionary stage, the composite ULIRGs are at a transitional stage, and the Seyfert 2 ULIRGs are at a more evolved stage. In this section, we discuss the physical parameters of ULIRG galaxies, namely, the mean stellar age, stellar mass, and gas mass, which may be related to the possible evolutionary sequence.
4.1. The mean stellar age
Based on the results of the stellar population analysis, we can get the light-weighted mean stellar age (Cid Fernandes et al., 2005):
| (2) |
which is an indicator of star formation history. The other such an indicator is Dn(4000) obtained by the MPA/JHU group222http://www.mpa-garching.mpg.de/SDSS/DR7/, which is defined as the average flux density ratio for the bands and (Bruzual A., 1983; Balogh et al., 1999). We compared them (Figure 6) and found that they are well correlated, with the Spearman Rank-Order Correlation Coefficient of . The best fitting is
| (3) |

The distributions of for HII-like, composite and Seyfert 2 ULIRGs are shown in the right panels of Figure 6. The mean values of for three types of ULIRGs, HII-like, composite, and Seyfert 2, are 7.6, 8.0 and 8.4, with the standard deviations of 0.4, 0.5 and 0.4, respectively. The increase of these mean values is consistent with the evolution sequence from HII-like ULIRGs and composite ULIRGs to Seyfert 2 ULIRGs. The young stellar population ( yr) are always present in ULIRGs (see Figure 6) due to the enhanced star formation in galaxy merger process. The large deviations of for these types of ULIRGs are probably caused by the complex dynamical process and star formation history of merger systems. Therefore, both and Dn(4000) are only the rough age indicator of ULIRGs.
4.2. The stellar mass
ULIRGs experience the continuing conversion of gas to stars. The stellar masses in ULIRGs are mostly contributed by intermediate-age and old stars (see distribution in Figure 4), and thus are a possible indicator for the ULIRG evolution.
The stellar mass of a ULIRG in the central 3′′ for the SDSS fiber spectrograph, , in unit of , can be estimated from the the stellar mass parameter given by STARLIGHT333http://www.starlight.ufsc.br/papers/Manual_StCv04.pdf:
| (4) |
where is the luminosity distance in cm. The aperture effect must be corrected by using the SDSS Petrosian magnitude (Blanton et al., 2001), , and fiber magnitude, , so that the estimated mass can be a constant fraction of the total mass of galaxies, independent of their positions and redshift. The aperture correction factor for each SDSS photometric band is roughly given by (Hopkins et al., 2003):
| (5) |
The spectra of ULIRGs fitted for the stellar population analysis roughly cover the , , , and bands. We take the average of the correction factors of these bands weighted by their uncertainty ,
| (6) |
to correct the aperture effect for each ULIRG. The corrected stellar mass, , in unit of , which is a constant fraction of the total stellar mass in a ULIRG, then can be estimated by
| (7) |

We obtained for the ULIRGs in our sample. To show the uncertainty of such corrected mass estimates from the fiber spectrum of the central part of ULIRGs, we compared them with the total stellar masses of whole galaxies estimated by the MPA/JHU group from the SDSS photometric data of , , , and bands (see the footnote No.5 on their webpage, Salim et al., 2007). We found that they are well correlated (see Figure 7) with the Spearman Rank-Order Correlation Coefficient , which means that the aperture-corrected stellar masses calculated from the STARLIGHT parameters are statistically fine. The data scatter in Figure 7 roughly indicates the uncertainty of the mass estimates. 444In our sample, the total dynamical masses of four ULIRGs, F09039+0503, F13428+5608, F15250+3609 and F15327+2340, can be calculated from the central velocity dispersion (Dasyra et al., 2006). As suggested by the referee, we got of 10.9, 11.1, 10.9, and 11.2 and plotted them in the Figure 7 for comparison with the total stellar masses derived by the stellar population analysis. Considering the typical gas content of ULIRGs of 10 (see Section 4.3), we think different kinds of mass estimates are consistent with each other.
The most important feature in Figure 7 is the obviously different distributions of for HII-like, composite and Seyfert 2 ULIRGs, whichever the masses estimated from either spectral or photometric analysis are used. The mean of the distribution for the mass from the spectral analysis for three types of ULIRGs, HII-like, composite, and Seyfert 2, are 10.70, 11.17 and 11.40, with the standard deviations of 0.45, 0.38 and 0.25, respectively. Seyfert 2 ULIRGs always have , larger than the masses in HII-like or composite ULIRGs (see Figure 7). The increase of the stellar masses along the sequence from HII-like ULIRGs to the composite ULIRGs and Seyfert 2 ULIRGs is consistent with the standard evolutionary scenario of ULIRGs.
4.3. Gas in ULIRGs
We noticed that Seyfert 2 ULIRGs mostly have (see Figure 7). However, many HII-like ULIRGs or composite ULIRGs have much smaller stellar mass, . If the evolutionary sequence from HII-like ULIRGs to composite ULIRGs and Seyfert ULIRGs is true, there should be enough gas to be converted to stars. The gas mass in ULIRGs is a key parameter to verify the standard evolution scenario of ULIRGs.

We collected the CO observations of ULIRGs to study their gas content. Up to now, 60 ULIRGs and LIRGs have measurements of CO(1-0) (Sanders et al., 1991; Solomon et al., 1997; Chung et al., 2009). However, only 10 of them have the optical spectra available from SDSS, and we have got the relevant mass estimates. CO observations of 9 ULIRGs were observed by Solomon et al. (1997) using the IRAM 30m telescope, and 1 ULIRG by Chung et al. (2009) using FCRAO 14m telescope. The gas mass (in unit of of ) can be estimated from the CO luminosity (in unit of K km s-1 pc2) (Downes & Solomon, 1998),
| (8) |
After the CO luminosity is converted to the same cosmology adopted in this paper, we got the gas masses for these 10 ULIRGs (see Figure 8). They are between , typical for normal gas-rich galaxies, except for the only one HII-like ULIRG, F08572+3915, which have a much smaller CO luminosity (Solomon et al., 1997; Chung et al., 2009) and hence the smaller gas mass. Clearly, more gas exists in ULIRGs with a smaller stellar mass. We further collected CO measurements (Sanders et al., 1991; Solomon et al., 1997; Chung et al., 2009) of 9 HII-like ULIRGs (Veilleux et al., 1999), which have no SDSS spectra available for stellar population analysis above. We take the mean for these HII-like ULIRGs, and plotted them in Figure 8.
The gas mass from the CO measurements (the upper panel of Figure 8) and the gas fraction of total mass (the lower panel of Figure 8) seem to be anti-correlated with the stellar mass for the ULIRGs ( and ), if we do not consider the outlier F08572+3915. The anti-correlation is only marginally significant because of the small sample of data available. The possible anti-correlation is preserved for the gas fraction and the stellar mass estimated from photometric analysis.
HII-like ULIRGs with a gas fraction follow the anti-correlation. Gas in ULIRGs may be eventually converted to stars. We noticed that about half of HII-like ULIRGs have a stellar mass less than (see Figure 7). HII-like ULIRGs in Figure 8 have a gas mass less than and a gas fraction less than . For those less massive HII-like ULIRGs, there is not enough gas to form stars, and they are not massive enough in total to evolve to Seyfert 2 ULIRGs (). Only massive HII-like ULIRGs () may follow the standard evolutionary scenario of ULIRGs and have a possible connection between the starbursts and AGNs.
5. Discussions
Stellar population analysis for narrow-line ULIRGs show the systematical changes of stellar age and mass along the sequence from the HII-like ULIRGs, to the composite ULIRGs and Seyfert 2 ULIRGs. Here we discuss several factors which may affect the results of stellar population analysis.
5.1. Power-law AGN contribution for spectral continuum
During the stellar population analysis with STARLIGHT, we used a power-law component, , with a fixed to represent the AGN contribution to the continuum spectrum (Cid Fernandes et al., 2004b, 2005). The AGN contribution is significant for composite, Seyfert 2 and LINER ULIRGs, but not for HII-like ULIGRs. However, the index for the power-law contribution, , could be to (see Natali et al., 1998). To evaluate the influence of the power-law index in the stellar population analysis, we re-do the fittings to the all spectra of 160 ULIRG sample with different values of , from , 1.25, 1.5, 1.75, to 2.0, for ten times each with different random seeds. We found that the change of by different values is less than 1%, which is not adequate to use to judge the best for fitting. Changes of the stellar mass and the mean stellar age caused by different are always less than 10%. Therefore, the adopted power-law index of is fine for the stellar population analysis.
5.2. Different bases of simple stellar populations
The evolutionary population synthesis method is mainly based on the stellar evolution model. We have used a base of 45 simple stellar populations (SSPs) for the stellar population analysis. The different bases of SSPs may affect the fitting results. Following the same procedures described in Section 3, we re-do the fittings to the spectra for 160 ULIRGs with a base of 150 SSPs (25 ages and 6 metallicities) and a base of 15 SSPs (15 ages and 1 metallicity) extracted from Bruzual & Charlot (2003). Although the fractional contribution of each stellar population component does not remain the same and may vary about 20%, the mean stellar age and stellar mass do not change significantly, less than 10%. Their distributions are consistent with those shown in Section 4 for different types of ULIRGs.

5.3. The aperture effect
We made stellar population analysis for the SDSS spectrum of the central region. The aperture effect has been corrected for the mass estimates, but not for the mean stellar age. To evaluate the aperture effect, we divided the ULIRG sample to several redshift bins, and re-do the analysis. In each redshift bin, the linear size of the aperture is almost the same for all ULIRGs, and the aperture effect is almost the same. Here we take the redshift bin of as the example which has the largest number of ULIRGs in the bin. As shown in Figure 9, the correlation between (4000) and keeps the same as the whole sample of ULIRGs. The distributions of for HII-like, composite and Seyfert 2 ULIRGs in the right panel of Figure 9 also show similar offsets as the whole sample. So do for other redshift bins. Therefore, we believe that the aperture effect does not influence our results.
5.4. Extinction
In the stellar population synthesis model of STARLIGHT (Cid Fernandes et al., 2005; Mateus et al., 2006), the extinction was considered as a foreground screen and fitted by one parameter, the -band extinction . But the young, intermediate and old stellar populations have different extinctions in a galaxy. Particularly the young stellar population was more extinguished than the others, being in places very dust obscured. Different should be assumed for the different populations. However, this can not be achieved in the model.

From the stellar population analysis to ULIRGs, the distributions of extinction parameter given by the STARLIGHT model for HII-like ULIRGs, composite ULIRGs and Seyfert 2 ULIRGs are very similar, as shown in Figure 10. The means of for three types of ULIRGs are 0.91, 1.09 and 0.92 with the standard deviations of 0.28, 0.39 and 0.36, respectively. The extinction parameters of HII-like and Seyfert 2 ULIRGs on average are slightly smaller than that of composite ULIRGs, which is consistent with Veilleux et al. (2009).
The distributions of the mean stellar age for different ULIRGs discussed in Section 4 are probably not influenced by the simplified treatment of extinction in the model. The mean stellar age given by the stellar population synthesis model are well correlated with results of Dn(4000) (see Figure 6), which verifies the mean age. On the other hand, in ULIRGs, the stellar mass is dominant by old stellar populations (see the right panels of Figure 4), which are expected to suffer less from extinction than young stellar populations. Therefore, the simplified extinction in the model probably does not affect our conclusions for ULIRGs.
6. Conclusions
We analyse the stellar populations for a sample of 160 narrow-line ULIRGs. They are optically classified as 32 HII-like ULIRGs, 74 Seyfert-HII composite ULIRGs, 6 LINER ULIRGs and 48 Seyfert 2 ULIRGs. We found that that along the sequence of HII-like, composite and Seyfert 2 ULIRGs, both the mean stellar age and the aperture-corrected stellar mass increase. This supports the standard evolutionary scenario of ULIRGs in which the Seyfert 2 ULIRGs are in a late stage of ULIRG evolution with a large mean stellar age and a large stellar mass () while HII-like ULIRGs are in an early stage with a young stellar age and a small stellar mass on average.
Whether HII-like ULIRGs have enough gas for starburst, so that they can evolve to Seyfert 2 ULIRGs? We collected CO measurements of 10 ULIRGs which have the SDSS spectra for the stellar population analysis. The gas mass fractions seem to be anti-correlated with the stellar masses for massive ULIRGs. All ULIRGs in our sample with CO measurements have a gas mass less than . HII-like ULIRGs with a small stellar mass () do not possess enough gases for starburst, and therefore have no evolution connections with massive Seyfert 2 ULIRGs. We conclude that only massive HII-like ULIRGs and composite ULIRGs may follow the evolution sequence toward AGNs.
References
- Abazajian et al. (2009) Abazajian, K. N., et al. 2009, ApJS, 182, 543
- Alongi et al. (1993) Alongi, M., Bertelli, G., Bressan, A., Chiosi, C., Fagotto, F., Greggio, L., & Nasi, E. 1993, A&AS, 97, 851
- Asari et al. (2007) Asari, N. V., Cid Fernandes, R., Stasińska, G., Torres-Papaqui, J. P., Mateus, A., Sodré, L., Schoenell, W., & Gomes, J. M. 2007, MNRAS, 381, 263
- Baldwin et al. (1981) Baldwin, J. A., Phillips, M. M., & Terlevich, R. 1981, PASP, 93, 5
- Balogh et al. (1999) Balogh, M. L., Morris, S. L., Yee, H. K. C., Carlberg, R. G., & Ellingson, E. 1999, ApJ, 527, 54
- Beichman et al. (1986) Beichman, C. A., Soifer, B. T., Helou, G., Chester, T. J., Neugebauer, G., Gillett, F. C., & Low, F. J. 1986, ApJ, 308, L1
- Blanton et al. (2001) Blanton, M. R., Dalcanton, J., Eisenstein, D., & Loveday, J. e. a. 2001, AJ, 121, 2358
- Bressan et al. (1993) Bressan, A., Fagotto, F., Bertelli, G., & Chiosi, C. 1993, A&AS, 100, 647
- Bruzual & Charlot (2003) Bruzual, G. & Charlot, S. 2003, MNRAS, 344, 1000
- Bruzual A. (1983) Bruzual A., G. 1983, ApJ, 273, 105
- Calzetti et al. (1994) Calzetti, D., Kinney, A. L., & Storchi-Bergmann, T. 1994, ApJ, 429, 582
- Canalizo & Stockton (2000a) Canalizo, G. & Stockton, A. 2000a, ApJ, 528, 201
- Canalizo & Stockton (2000b) —. 2000b, AJ, 120, 1750
- Canalizo & Stockton (2001) —. 2001, ApJ, 555, 719
- Chabrier (2003) Chabrier, G. 2003, PASP, 115, 763
- Chen et al. (2010) Chen, X. Y., Liang, Y. C., Hammer, F., Prugniel, P., Zhong, G. H., Rodrigues, M., Zhao, Y. H., & Flores, H. 2010, A&A, 515, A101+
- Chen et al. (2009) Chen, X. Y., Liang, Y. C., Hammer, F., Zhao, Y. H., & Zhong, G. H. 2009, A&A, 495, 457
- Chung et al. (2009) Chung, A., Narayanan, G., Yun, M. S., Heyer, M., & Erickson, N. R. 2009, AJ, 138, 858
- Cid Fernandes et al. (2004a) Cid Fernandes, R., et al. 2004a, ApJ, 605, 105
- Cid Fernandes et al. (2004b) Cid Fernandes, R., Gu, Q., Melnick, J., Terlevich, E., Terlevich, R., Kunth, D., Rodrigues Lacerda, R., & Joguet, B. 2004b, MNRAS, 355, 273
- Cid Fernandes et al. (2005) Cid Fernandes, R., Mateus, A., Sodré, L., Stasińska, G., & Gomes, J. M. 2005, MNRAS, 358, 363
- Colina et al. (2001) Colina, L., Borne, K., Bushouse, H., Lucas, R. A., Rowan-Robinson, M., Lawrence, A., Clements, D., Baker, A., & Oliver, S. 2001, ApJ, 563, 546
- Dasyra et al. (2006) Dasyra, K. M., et al. 2006, ApJ, 651, 835
- de Grijp et al. (1985) de Grijp, M. H. K., Miley, G. K., Lub, J., & de Jong, T. 1985, Nature, 314, 240
- Downes & Solomon (1998) Downes, D. & Solomon, P. M. 1998, ApJ, 507, 615
- Fagotto et al. (1994) Fagotto, F., Bressan, A., Bertelli, G., & Chiosi, C. 1994, A&AS, 104, 365
- Farrah et al. (2003) Farrah, D., Afonso, J., Efstathiou, A., Rowan-Robinson, M., Fox, M., & Clements, D. 2003, MNRAS, 343, 585
- Genzel et al. (2001) Genzel, R., Tacconi, L. J., Rigopoulou, D., Lutz, D., & Tecza, M. 2001, ApJ, 563, 527
- Girardi et al. (1996) Girardi, L., Bressan, A., Chiosi, C., Bertelli, G., & Nasi, E. 1996, A&AS, 117, 113
- Heckman et al. (1987) Heckman, T. M., Armus, L., & Miley, G. K. 1987, AJ, 93, 276
- Hopkins et al. (2003) Hopkins, A. M., et al. 2003, ApJ, 599, 971
- Hou et al. (2009) Hou, L. G., Wu, X., & Han, J. L. 2009, ApJ, 704, 789
- Kewley et al. (2006) Kewley, L. J., Groves, B., Kauffmann, G., & Heckman, T. 2006, MNRAS, 372, 961
- Kormendy & Sanders (1992) Kormendy, J. & Sanders, D. B. 1992, ApJ, 390, L53
- Le Borgne et al. (2003) Le Borgne, J., et al. 2003, A&A, 402, 433
- Lípari et al. (2003) Lípari, S., Terlevich, R., Díaz, R. J., Taniguchi, Y., Zheng, W., Tsvetanov, Z., Carranza, G., & Dottori, H. 2003, MNRAS, 340, 289
- Lonsdale et al. (2006) Lonsdale, C. J., Farrah, D., & Smith, H. E. 2006, Ultraluminous Infrared Galaxies (Astrophysics Update 2), 285–+
- Mateus et al. (2006) Mateus, A., Sodré, L., Cid Fernandes, R., Stasińska, G., Schoenell, W., & Gomes, J. M. 2006, MNRAS, 370, 721
- Meng et al. (2010) Meng, X., Wu, H., Gu, Q., Wang, J., & Cao, C. 2010, ApJ, 718, 928
- Moshir et al. (1992) Moshir, M., Kopman, G., & Conrow, T. A. O. 1992, IRAS Faint Source Survey, Explanatory supplement version 2 (Pasadena: Infrared Processing and Analysis Center, California Institute of Technology)
- Naab et al. (2006) Naab, T., Jesseit, R., & Burkert, A. 2006, MNRAS, 372, 839
- Natali et al. (1998) Natali, F., Giallongo, E., Cristiani, S., & La Franca, F. 1998, AJ, 115, 397
- Netzer et al. (2007) Netzer, H., et al. 2007, ApJ, 666, 806
- Richstone & Schmidt (1980) Richstone, D. O. & Schmidt, M. 1980, ApJ, 235, 361
- Rodríguez Zaurín et al. (2007) Rodríguez Zaurín, J., Holt, J., Tadhunter, C. N., & González Delgado, R. M. 2007, MNRAS, 375, 1133
- Rodríguez Zaurín et al. (2008) Rodríguez Zaurín, J., Tadhunter, C. N., & González Delgado, R. M. 2008, MNRAS, 384, 875
- Rodríguez Zaurín et al. (2009) —. 2009, MNRAS, 400, 1139
- Rodríguez Zaurín et al. (2010) —. 2010, MNRAS, 403, 1317
- Salim et al. (2007) Salim, S., et al. 2007, ApJS, 173, 267
- Sanders & Mirabel (1996) Sanders, D. B. & Mirabel, I. F. 1996, ARA&A, 34, 749
- Sanders et al. (1991) Sanders, D. B., Scoville, N. Z., & Soifer, B. T. 1991, ApJ, 370, 158
- Sanders et al. (1988a) Sanders, D. B., Soifer, B. T., Elias, J. H., Madore, B. F., Matthews, K., Neugebauer, G., & Scoville, N. Z. 1988a, ApJ, 325, 74
- Sanders et al. (1988b) Sanders, D. B., Soifer, B. T., Elias, J. H., Neugebauer, G., & Matthews, K. 1988b, ApJ, 328, L35
- Schmitt et al. (1996) Schmitt, H. R., Bica, E., & Pastoriza, M. G. 1996, MNRAS, 278, 965
- Schweitzer et al. (2006) Schweitzer, M., et al. 2006, ApJ, 649, 79
- Solomon et al. (1997) Solomon, P. M., Downes, D., Radford, S. J. E., & Barrett, J. W. 1997, ApJ, 478, 144
- Soto & Martin (2010) Soto, K. T. & Martin, C. L. 2010, ApJ, 716, 332
- Springel et al. (2005) Springel, V., Di Matteo, T., & Hernquist, L. 2005, ApJ, 620, L79
- Surace & Sanders (1999) Surace, J. A. & Sanders, D. B. 1999, ApJ, 512, 162
- Surace et al. (2000) Surace, J. A., Sanders, D. B., & Evans, A. S. 2000, ApJ, 529, 170
- Surace et al. (1998) Surace, J. A., Sanders, D. B., Vacca, W. D., Veilleux, S., & Mazzarella, J. M. 1998, ApJ, 492, 116
- Tacconi et al. (2002) Tacconi, L. J., Genzel, R., Lutz, D., Rigopoulou, D., Baker, A. J., Iserlohe, C., & Tecza, M. 2002, ApJ, 580, 73
- Veilleux et al. (1999) Veilleux, S., Kim, D., & Sanders, D. B. 1999, ApJ, 522, 113
- Veilleux et al. (2009) Veilleux, S., et al. 2009, ApJS, 182, 628
- Westera et al. (2004) Westera, P., Cuisinier, F., Telles, E., & Kehrig, C. 2004, A&A, 423, 133