Limit of validity of Ostwald’s rule of stages in a statistical mechanical model of crystallization
Abstract
We have only rules of thumb with which to predict how a material will crystallize, chief among which is Ostwald’s rule of stages. It states that the first phase to appear upon transformation of a parent phase is the one closest to it in free energy. Although sometimes upheld, the rule is without theoretical foundation and is not universally obeyed, highlighting the need for microscopic understanding of crystallization controls. Here we study in detail the crystallization pathways of a prototypical model of patchy particles. The range of crystallization pathways it exhibits is richer than can be predicted by Ostwald’s rule, but a combination of simulation and analytic theory reveals clearly how these pathways are selected by microscopic parameters. Our results suggest strategies for controlling self-assembly pathways in simulation and experiment.
I Introduction
Crystallization frequently happens in a ‘multi-stage’ manner, with a parent phase (e.g. a solution) first transforming into an intermediate phase (e.g. a dense liquid) before the stable solid emerges Zhang and Liu (2009); Chung et al. (2008, 2010). One of the few guidelines we have for predicting when crystallization intermediates will appear is Ostwald’s rule of stages, which states that the parent phase will first transform into the phase closest to it in free energy Ostwald (1897); Threlfall (2003). It is widely upheld. For instance, sulfur crystallizes from solution by first forming a dense liquid Ostwald (1897). Melts Cech (1957) and aerosols Fox et al. (1995) also display expected precursors of the stable crystal. On the computer, a microscopic analog of the rule is seen: the freezing of polar fluids, model proteins Wolde and Frenkel (1999) and molecular nitrogen Leyssale et al. (2003) can all take place via nuclei whose composition reflects that of an intermediate phase. But the rule has no theoretical foundation Cardew et al. (1984) and is not universally obeyed. Amino acid crystallization Kitamura (2009), the simulated freezing of molecular CO2 Leyssale et al. (2005) and Potts model phase transformations Sanders et al. (2007) can all take place without involvement of metastable polymorphs. Further, simulations of charged colloids Sanz et al. (2007) show that sluggish dynamics can invalidate the closely-related Stranski-Totomanow conjecture Stranski and Totomanov (1933), the prediction that the first phase seen is the one separated from the parent phase by the smallest free energy barrier.
The limitations of these rules of thumb motivate us to look for connections between crystallization pathways and microscopic features of particle interactions and dynamics. Here we study a lattice model of anisotropic particles. Our model is designed to mimic, in a generic way, the ability of materials such as proteins Galkin and Vekilov (2000); Chung et al. (2010) and ions Radha et al. (2010) to crystallize by first forming a disordered phase. It is also designed to be simple enough to allow thorough assessment of how its microscopic parameters control its crystallization behavior. Here we describe this behavior in detail. We show where in phase space Ostwald’s rule is likely to hold, and where it is likely to fail. Because the essence of the microscopic features of our model are common to a wide range of physical systems, the trends we have identifed might be used as a guide to select particular crystallization pathways in simulation and experiment.
II Model and simulation protocol
We consider a collection of particles that live on a featureless two-dimensional substrate, which we model as a square lattice. Lattice sites may be vacant or be occupied by a particle. Nearest-neighbor particles receive a ‘nonspecific’ interaction energy reward of . Particles are anisotropic, and can point in any of discrete directions. Neighboring particles receive an additional ‘specific’ energy reward of if they are aligned, and a penalty of if they are antialigned. The larger is , the more precisely must two particles align before they receive the specific binding reward (we shall explore the effect of varying ). Each particle on the substrate feels a chemical potential .
We simulated our model using the Monte Carlo procedure described in Appendix A. This procedure allows particles to translate (adsorb to and desorb from the substrate), and to rotate in place on the substrate. We have explored the effect of varying extensively the relative rate of proposing rotation and translation moves, because we expect rotational and translational mobilities to vary considerably from one material to another. For instance, the limit of slow rotations () might be appropriate for particles, like DNA-linked colloids, that must unbind in order to rotate appreciably Dai et al. (2010). It is also likely that particles of different sizes explore their positional and angular interaction ranges at different rates note . We used this procedure in concert with umbrella sampling Torrie and Valleau (1977) to calculate free energy landscapes for crystallization (biasing the size and degree of crystallinity of the system’s largest cluster Wolde and Frenkel (1999)), and in concert with transition path sampling Bolhuis et al. (2002); Pan and Chandler (2004) and forward flux sampling Allen et al. (2005) to generate dynamical crystallization trajectories. The combination of these methods reveals the distinct effect on crystallization of thermodynamics and dynamics.
III Simulation Results
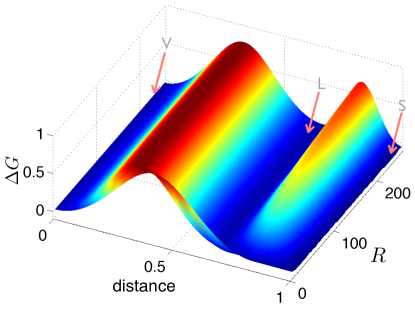
In Fig. 1 we show the phase diagram of the model as a function of interaction strengths and , for angular specificity . Snapshots of phases are also shown: particles with 4 parallel neighbors (crystalline particles) are green; particles with no parallel neighbors (fluid particles) are dark blue. Intermediate particles, with 1–3 parallel neighbors, are blue-green. When both interactions are weak the stable phase is a homogeneous fluid phase (H) of moderate density and little orientational order. When is large enough (above the ‘freezing line’), the orientationally-ordered solid (S) is stable. When is sufficiently large (to the right of the ‘demixing line’), phase H disappears and dense liquid (L) and sparse vapor (V) phases become viable. Our choice of (see Appendix) ensures that above the freezing line and to the right of the demixing line the liquid phase lies intermediate in free energy between the vapor phase and the stable solid. In this regime, Ostwald’s rule suggests that a vapor should transform into a liquid before it crystallizes. But is this true?
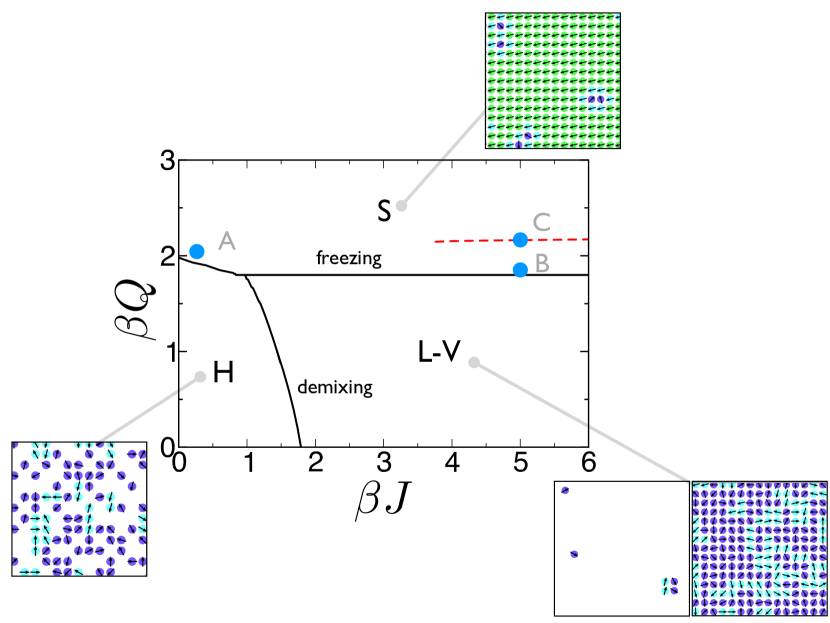
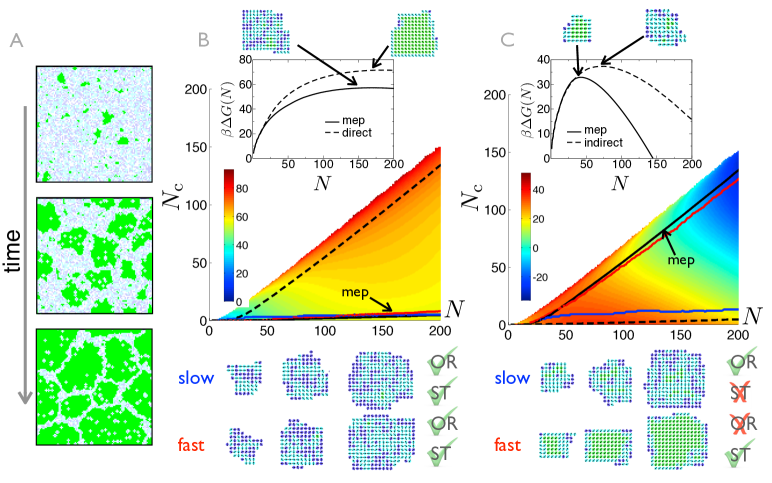
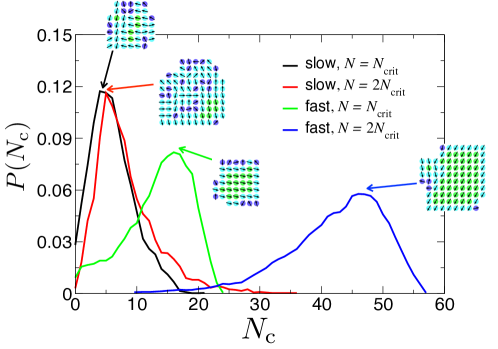
Crystallization pathways at points A, B and C in phase space are shown in Fig. 2. At point A in phase space, only phases H and S are viable, and crystallization is straightforward: it consists of the direct transformation of H into S. At point B on the phase diagram (in our regime of interest) an empty substrate immediately becomes host to the metastable low-density vapor. We show in Fig. 2 the free energy of formation from the vapor of a dense nucleus as a function of nucleus size and the number of crystalline particles it contains. The minimum energy pathway (‘mep’, solid line) from the vapor to the crystal is an indirect one (sometimes called a ‘two-step’ or ‘nonclassical’ pathway) that displays a liquidlike critical nucleus. The direct pathway (dashed line) via a crystalline critical nucleus is disfavored by about 15 . The indirect pathway is made possible by the intermediate liquid phase, but because we are far from the demixing line is not a result of critical density fluctuations Wolde and Frenkel (1997). Dynamical trajectories generated using a wide range of particle rotation rates adhere to the indirect pathway (red line, fast rotation: ; blue line, slow rotation: ): a liquid nucleates on the substrate, and only subsequently does the crystal emerge from the liquid. For rapid rates of rotation the postcritical liquid readily transforms into a crystal while still only of small size M1, while for sluggish rotation rates the liquid consumes the substrate, and fails to crystallize during the course of the simulation M2.
At point C in phase space the liquid remains intermediate in free energy between the parent phase and the stable solid, but the driving force for crystallization is qualitatively different: the direct pathway, with a crystalline critical nucleus, is preferred! The indirect pathway with a liquidlike critical nucleus is still viable, but is disfavored by about . Because of this relatively small discrepancy in barrier heights, both pathways can be seen in dynamic simulations. For a sufficiently fast rotation rate (red line, ) the direct pathway is taken: a crystal nucleates and grows on the substrate. No liquid is seen. For a slow rotation rate (blue line, ) the indirect pathway is seen, and the substrate is again consumed by a liquid, M3, M4, and A7.
A relic of the liquid phase therefore influences the crystallization pathway some way past the freezing line, but eventually thermodynamics favors a direct mode of crystallization: the critical nucleus is crystalline above the horizontal red line on the phase diagram of Fig. 1. The question of how much liquid is seen in simulations is one that cannot be addressed by Ostwald’s rule (‘OR’ in caption). Assuming that it applies (it pertains to metastable intermediate phases, and the liquid at B and C is at most weakly so), it is satisfied in a macroscopic sense by the ‘slow rotation’ (blue) trajectories at point B, but only in a microscopic sense by the ‘fast rotation’ (red) trajectories. It is violated by the ‘fast’ trajectories at C, but not by the ‘slow’ trajectories. Moreover, the latter involve passage over a free energy barrier larger than the smallest available, going against the sense of the Stranski-Totomanow conjecture (‘ST’ in caption).
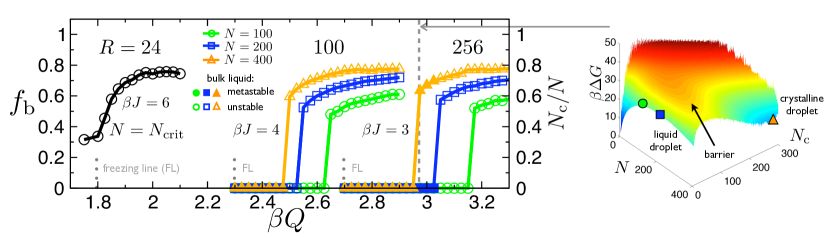
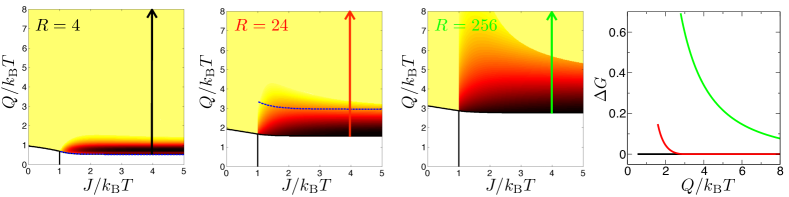
The microscopic thermodynamic control of our model’s crystallization pathway is the competition between the angular specificity and potency of specific binding. In Fig. 3 we show that the thermodynamically-preferred composition of the critical nucleus (and of small nuclei of specified size) is liquidlike for small (just above the freezing line), and becomes increasingly crystalline as one increases : this trend acts against the sense of Ostwald’s rule. By contrast, increasing acts in favor of Ostwald’s rule: as grows, the liquid becomes more strongly metastable to crystallization, giving rise to free energy barriers that hinder the transformation of a liquid droplet into a solid one (compare surfaces top right and top left).
IV Analytic Results
Interestingly, we can anticipate these thermodynamic trends using simple microscopic theory. We calculated analytically (see Appendix B) the model’s bulk free energy , in a self-consistent mean-field approximation, as a function of order parameters (density) and (crystallinity):
| (1) |
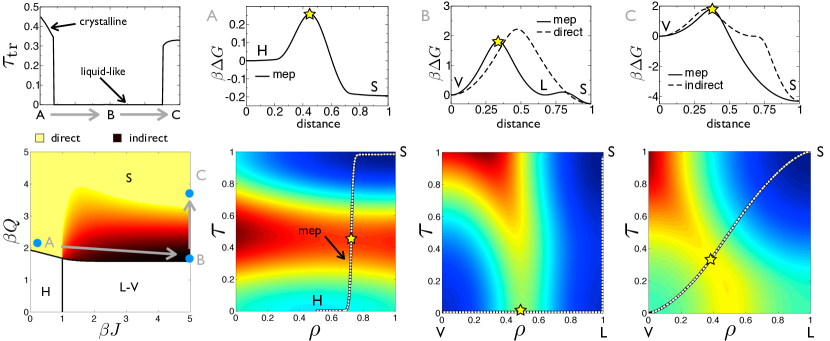
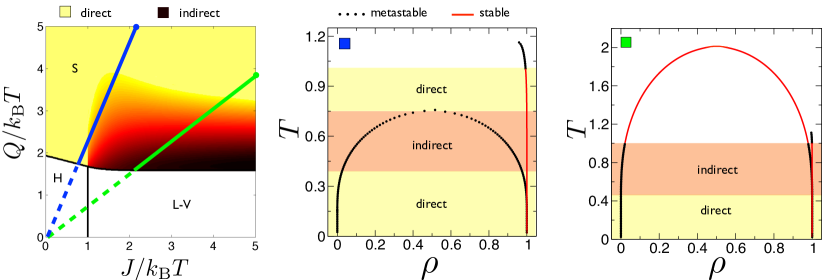
Here is the lattice coordination number. From Eq. (1) we obtained the phase diagram shown in Fig. 4, which resembles qualitatively its simulated counterpart. The microscopic parameters of the model control distinct critical behaviors, but they also shape the bulk free energy landscape even in regimes away from any phase transition. Furthermore, previous work reveals that the bulk free energy landscape suggests the qualitative character of the thermodynamically-preferred crystallization pathway Shen and Oxtoby (1996); Lutsko and Nicolis (2006): bulk wells indicate driving forces for appearance of phases, and bulk barriers are an important component of droplet surface tensions in a Cahn-Hilliard approximation. On bulk surfaces we calculated the minimum energy pathways between parent and solid phases (shown by white dashed lines on surfaces at points A, B, C), and shaded the phase diagram according to how ‘direct’ are those pathways. The resulting ‘pathway diagram’ describes qualitatively the thermodynamic driving force for crystallization for given microscopic parameters, and mirrors the changes of cluster composition seen in our umbrella sampling (thermodynamic) simulations: indirect crystallization pathways become viable to the right of the demixing line, and are supplanted by a direct mechanism some distance above the freezing line. This correspondence is a central result of this paper. This change of mechanism takes place in a regime of phase space in which the hierarchy of stable phase remains unchanged: in other words, the phase diagram in this regime is featureless, but the pathway diagram is not.
The analytic theory allows a comprehensive survey of parameter space. Increasing , the number of accessible orientational states, has the effect of increasing the bulk free energy barrier between crystal and liquid phases (Fig. 5), a trend reflected in simulations of finite-size clusters (Fig. 3). Fig. 6 shows pathway diagrams for three particles with different value of , which display similar trends (though a stronger specific interaction is needed to effect a change of pathway for large ). Finally, Fig. A8 shows the relation between the phase diagram and the conventional temperature-density one. The analytic estimate of pathway is a useful starting point for directing simulations, but it contains no dynamical information: we have seen in simulations that sluggish rotational dynamics can render the actual crystallization mechanism different to the thermodynamically-preferred one.
V Conclusions
We have identified the microscopic controls of crystallization in a model of anisotropic particles that can form both disordered and crystalline phases. Our work complements previous studies that reveal how changes of intensive parameters, such as temperature Duff and Peters (2009) and pressure Desgranges and Delhommelle (2007), can change crystallization pathways in model systems. Although rules of thumb are of limited use in predicting our model’s crystallization pathway, a combination of simulation and analytic theory reveals that a liquid phase is likely to be seen prior to crystallization if 1) particles rotate sluggishly; 2) if particles must align precisely in order to crystallize (i.e. if is large); and 3) if the specific attraction is just strong enough to render the crystal stable (but not so strong as to render small droplets of crystal lower in free energy than droplets of liquid of similar size). While our model is idealized, and certainly does not capture the detailed microscopics of the way real particles interact, it does show that the type of complex crystallization pathway observed in many experiments emerges as soon as one assigns to a particle a translational degree of freedom and a rotational one. Further, while we expect differences in the details of particle interactions in two- and three dimensions, the correspondence of mean field theory (which tends to work better the higher the dimension) and simulation results, and related dynamic ‘crossovers’ seen in three-dimensional models Duff and Peters (2009), suggest that the results of this study are not limited to two-dimensional systems. With this in mind, we conjecture that the observations made here might be used as a starting point to guide experiments. For instance, they suggest that one could control the crystallization pathway of a protein if one could devise ways of altering, independently, that protein’s nonspecific attraction ‘’ (e.g. using PEG) and specific attraction ‘’ and ‘’ (e.g. through mutation or using multivalent salt Zhang et al. (2011)). One might also design anisotropic nanoparticles of specific rotational and translational mobilities in order to encourage a direct or indirect crystallization pathway. Finally, we used the ‘pathway diagram’ of Fig. 4 to select interesting regions of phase space for our simulation work: analytic treatment of other models might furnish similar microscopic ‘maps’ to guide simulation studies.
VI Acknowledgements.
We thank Jim DeYoreo, Tom Haxton, Rob Jack, Daphne Klotsa and Dina Mirijanian for comments on the manuscript, and Daan Frenkel, Phill Geissler, Lutz Maibaum and Will McKerrow for discussions. L.O.H. was supported by the Center for Nanoscale Control of Geologic CO2, a U.S. D.O.E. Energy Frontier Research Center, under Contract No. DE-AC02–05CH11231. This work was done at the Molecular Foundry, Lawrence Berkeley National Laboratory, supported under the same DOE Contract No. We thank NERSC for computational resources.
References
- Zhang and Liu (2009) T. H. Zhang and X. Y. Liu, Angew. Chem. Int. Ed 48, 1308 (2009).
- Chung et al. (2008) S. Y. Chung, Y. M. Kim, J. G. Kim, and Y. J. Kim, Nature Physics 5, 68 (2008)
- Chung et al. (2010) S. Chung, S. H. Shin, C. R. Bertozzi, and J. J. De Yoreo, Proceedings of the National Academy of Sciences U.S.A. 107, 16536 (2010).
- Ostwald (1897) W. Ostwald, Z. Phys. Chem. 22 (1897).
- Threlfall (2003) T. Threlfall, Organic Process Research & Development 7, 1017 (2003).
- Cech (1957) R. E. Cech, Transactions of the American Institute of Mining, Metallurgical, and Petroleum Engineers, Incorporated p. 585 (1957).
- Fox et al. (1995) L. E. Fox, S. C. Wofsy, D. R. Worsnop, and M. S. Zahniser, Science 267, 351 (1995).
- Wolde and Frenkel (1999) P. R. Wolde and D. Frenkel, Physical Chemistry Chemical Physics 1, 2191 (1999).
- Leyssale et al. (2003) J. M. Leyssale, J. Delhommelle, and C. Millot, Chemical Physics Letters 375, 612 (2003).
- Cardew et al. (1984) P. Cardew, R. Davey, and A. Ruddick, Journal of the Chemical Society, Faraday Transactions 2 80, 659 (1984).
- Kitamura (2009) M. Kitamura, CrystEngComm 11, 949 (2009).
- Leyssale et al. (2005) J. M. Leyssale, J. Delhommelle, and C. Millot, Journal of Chemical Physics 122, 184518 (2005).
- Sanders et al. (2007) D. Sanders, H. Larralde, and F. Leyvraz, Physical Review B 75, 132101.
- Sanz et al. (2007) E. Sanz, C. Valeriani, D. Frenkel, and M. Dijkstra, Physical Review Letters 99, 55501 (2007).
- Stranski and Totomanov (1933) I. N. Stranski and D. Totomanov, Z. Phys. Chem 163, 399 (1933).
- Galkin and Vekilov (2000) O. Galkin and P. G. Vekilov, Proc. Nat. Acad. Sci. 97, 6277 (2000).
- Radha et al. (2010) A. Radha, T. Forbes, C. Killian, P. Gilbert, and A. Navrotsky, Proceedings of the National Academy of Sciences 107, 16438 (2010).
- Dai et al. (2010) W. Dai, S. Kumar, and F. Starr, Soft Matter (2010).
- (19) An object of radius in physiological aqueous solution possesses a range of attraction that is characteristically a nanometer. The fact that does not scale with is important to the thermodynamics of particle association Wolde and Frenkel (1997), and is likely to be important dynamically. From Stokes’ law, the characteristic time for two particles to explore the extent of their range of attraction is , and the characteristic time for particles to explore their orientational degrees of freedom (e.g. thinking of the present model, to move from parallel to antiparallel registry) scales as . The ratio of these characteristic times scales as , and we therefore expect a large change of this ratio upon moving from a small protein of 1 nm to a patchy nanoparticle of 100 nm.
- Torrie and Valleau (1977) G. Torrie and J. Valleau, Journal of Computational Physics 23, 187 (1977).
- Bolhuis et al. (2002) P. G. Bolhuis, D. Chandler, C. Dellago, and P. L. Geissler, Annual Review of Physical Chemistry 53, 291 (2002).
- Pan and Chandler (2004) A. Pan and D. Chandler, J. Phys. Chem. B 108, 19681 (2004).
- Allen et al. (2005) R. Allen, P. Warren, and P. Ten Wolde, Physical Review Letters 94, 18104 (2005).
- Wolde and Frenkel (1997) P. R. Wolde and D. Frenkel, Science 277, 1975 (1997).
- Shen and Oxtoby (1996) Y. C. Shen and D. W. Oxtoby, Physical Review Letters 77, 3585 (1996).
- Lutsko and Nicolis (2006) J. Lutsko and G. Nicolis, Physical Review Letters 96, 046102 (2006).
- Duff and Peters (2009) N. Duff and B. Peters, Journal of Chemical Physics 131, 184101 (2009).
- Desgranges and Delhommelle (2007) C. Desgranges and J. Delhommelle, Physical Review Letters 98, 235502 (2007).
- Zhang et al. (2011) F. Zhang, G. Zocher, A. Sauter, T. Stehle, and F. Schreiber, Journal of Applied Crystallography 44, 0 (2011).
- Allen et al. (2006) R. J. Allen, D. Frenkel, and P. R. ten Wolde, 124, 024102 (2006).
- Peters and Trout (2006) B. Peters and B. L. Trout, Journal of Chemical Physics 125, 054108 (2006).
- Peters et al. (2007) B. Peters, G. T. Beckham, and B. L. Trout, The Journal of Chemical Physics 127, 034109 (2007).
- Geng and Selinger (2009) J. Geng and J. Selinger, Physical Review E 80, 11707 (2009).
- Whitelam (2010) S. Whitelam, J. Chem. Phys. 132, 194901 (2010).
- Asherie et al. (1996) N. Asherie, A. Lomakin, and G. B. Benedek, Phys. Rev. Lett. 77, 4832 (1996).
Appendix A Simulation details
We simulated our model using the following grand canonical Metropolis Monte Carlo procedure. This procedure effects a diffusive dynamics and assumes the substrate to be in contact with a thermal bath and a particle bath (i.e we assume the substrate to be in contact with bulk solution). We select at random a lattice site. If that site is occupied by a particle then with probability we attempt to delete its occupant. We accept this deletion with probability , where and is the change of interaction energy following the proposed deletion. With probability we instead attempt to change the particle’s orientation by unit, modulo (we assume particles to rotate in a plane, and so orientation neighbors orientation ). We accept changes of rotation with probability . If the chosen site is vacant then we attempt to occupy it with a particle whose orientation is chosen randomly. This attempt succeeds with probability . The factors of in insertion and deletion rates are required to preserve detailed balance: insertions are always attempted if a lattice site is vacant, but deletions are attempted only with probability if a lattice site is occupied. The factors of are present for a similar reason: insertion of a particle of a given orientation is attempted with probability , but proposing the reverse of that particular insertion occurs with unit probability. We used a lattice of sites, periodically replicated in each direction.
The basic rate for particle translations (adsorptions and desorptions) is . The basic rate for particle rotations has two contributions: the first scales as , and comes from explicit rotation moves; the factor of accounts for the characteristic time to visit rotational states. The second contribution scales as , and comes from explicit translations (particles attach to the substrate with randomly-chosen orientations, and so removal and reattachment of a particle allows an effective sampling of its orientation). The first mode of orientation-sampling is most effective in the bulk of a liquidlike cluster, while the second mode operates most readily at the surface of a cluster (where particle detachments are most frequent). There is therefore no constant effective rate at which a cluster explores the configuration space shown in Fig. 1. We report values of a parameter , the relative rate of proposing a rotation or translation. Our scheme does not account for in-plane particle diffusion, focusing instead on mass transport from the bulk.
We set , where is the coordination number of the lattice. Our choice of ensures that, to a mean-field approximation, liquid and vapor phases are equal in free energy. The contribution is the usual Ising model term. The term penalizes particles relative to vacancies by an amount that exactly compensates the entropy difference between particles and vacancies. This choice is motivated by the fact that we consider our simulation protocol to reflect the diffusion of material to and from the substrate, with no change of that material’s rotational freedom, rather than to model its creation or destruction (which would be accompanied by creation or destruction of rotational entropy). In simulations, orientational correlations in the liquid lower its free energy below that of the vapor by an amount that decreases with increasing .
In umbrella sampling simulations, cluster size and crystallinity were constrained using harmonic bonds of spring constant 0.2 within windows of width 5 (particles). Dynamical trajectories were sown, grown and harvested using the original forward flux sampling (FFS) algorithm Allen et al. (2006) and the aimless shooting transition path sampling algorithm Peters and Trout (2006); Peters et al. (2007). FFS simulations used an interval of 5 between interfaces, 1000 starting configurations in the initial basin and trials per interface.
Appendix B Mean-field theory
The energy function of our model is , where runs over the nearest neighbors of , and is a chemical potential. The variable is 0 if lattice site is vacant, and is 1 if it is occupied. The pairwise interaction is
where is the orientation of the particle at lattice site . The function is 1 if (aligned particles receive an extra energetic reward), and is zero otherwise. The function is 1 if and are units different, modulo (antialigned particles receive an energetic penalty), and is zero otherwise.
We can derive the free energy of this model in a mean-field approximation Geng and Selinger (2009); Whitelam (2010) by assuming that each site feels only the thermal average of the fluctuating variables at neighboring sites. The effective interaction at a given site is to this approximation
where we have dropped site labels. By symmetry, all but two terms in the sum over vanish. The effective free energy per site is then , where and , where and . Thermal averages are defined self-consistently through the relation . The trace can be carried out by assuming, without loss of generality, the ordering direction to be . The result is Eq. (1), in which is the density and is the crystallinity order parameter. The latter distinguishes disordered fluid phases (for which ) from the ordered solid phase (for which ).