The XMM-Newton survey of the Small Magellanic Cloud:
XMMU J005011.2-730026 = SXP214, a Be/X-ray binary pulsar
††thanks: Based on observations with
XMM-Newton, an ESA Science Mission with instruments and contributions
directly funded by ESA Member states and the USA (NASA)
Abstract
In the course of the XMM-Newton survey of the Small Magellanic Cloud (SMC), a region to the east of the emission nebula N19 was observed in November 2009. To search for new candidates for high mass X-ray binaries the EPIC PN and MOS data of the detected point sources were investigated and their spectral and temporal characteristics identified. A new transient (XMMU J005011.2-730026= SXP214) with a pulse period of 214.05 s was discovered; the source had a hard X-ray spectrum with power-law index of 0.65. The accurate X-ray source location permits the identification of the X-ray source with a 15th magnitude Be star, thereby confirming this system as a new Be/X-ray binary.
keywords:
stars:neutron - X-rays:binaries1 Introduction and background
The Be/X-ray systems represent the largest sub-class of all High Mass X-ray Binaries (HMXB). A survey of the literature reveals that of the 240 HMXBs known in our Galaxy and the Magellanic Clouds (Liu et al., 2005, 2006), 50% fall within this class of binary. In fact, in recent years it has emerged that there is a substantial population of HMXBs in the SMC comparable in number to the Galactic population. Though unlike the Galactic population, all except one of the SMC HMXBs are Be star systems. In these systems the orbit of the Be star and the compact object, presumably a neutron star, is generally wide and eccentric. X-ray outbursts are normally associated with the passage of the neutron star close to the circumstellar disk (Okazaki & Negueruela 2001), and generally are classified as Types I or II (Stella, White & Rosner, 1986). The Type I outbursts occur periodically at the time of the periastron passage of the neutron star, whereas Type II outbursts are much more extensive and occur when the circumstellar material expands to fill most, or all of the orbit. This paper concerns itself with Type I outbursts. General reviews of such HMXB systems may be found in Negueruela (1998), Corbet et al. (2008) and Coe et al. (2000, 2008).
One of the aims of the XMM-Newton large program SMC survey (Haberl & Pietsch 2008a) is the ongoing study of the Be/X-ray binary population of the SMC, which can be used as a star formation tracer for 50 Myr old populations (Antoniou et al. 2010). In this paper we present the analysis of X-ray and optical data from the newly discovered X-ray pulsar XMMU J005011.2-730026, hereafter referred to more simply as SXP214 following the naming convention of Coe et al (2005) for X-ray binary pulsars in the SMC.
2 X-ray Observations
The local group galaxies are best suited to study their X-ray source populations using present day observatories. Extending the existing archival observations, we have carried out a large program in 2009 with XMM-Newton to obtain a complete X-ray survey of the SMC in the 0.1-10 keV band. The hard X-ray source SXP214 that is the subject of this work was discovered as transient in observation 14 (observation ID 0601211401 of the survey), on 4 Nov. 2009. The field is centred about 22′ east of the emission nebula N19 in the south-western part of the SMC bar. It was observed by all three EPIC instruments (Strüder et al., 2001, Turner et al., 2001) at off-axis angles between 12.9′ and 13.7′ on CCD 10, 3, and 4 for EPIC-pn, EPIC-MOS1, and EPIC-MOS2, respectively. All three cameras were operated in full-frame imaging mode with CCD readout frame times of 73 ms (pn) and 2.6 s (MOS). We used the XMM-Newton Science Analysis System (SAS) version 10.0.0111http://xmm.esac.esa.int/sas/ to reduce the data.
To correct the astrometric bore-sight, we identified eight sources (mainly known Be/X-ray binaries) in the field of view (FoV) with the Magellanic Clouds Photometric Survey of Zaritsky et al. (2002) and obtained a shift of RA=0.10″ and Dec=0.70″. The corrected X-ray position as found by emldetect is R.A. = 00h50m1095 and Dec. = –73°00′250 (J2000.0), with a statistical error of 0.18″ and a systematic uncertainty of 1″ (1 confidence for both cases). The relatively large systematic error is caused by the large off-axis angle of the source.
To remove times affected by background flares due to soft protons which occured at the end of the observation (performed at the end of the satellite orbit) we defined good time intervals by applying thresholds on the background count rate in the 7.0–15.0 keV band of 8 and 2.5 cts ks-1 arcmin-2 for EPIC-pn and EPIC-MOS, respectively. The soft proton background was at a very low level during the first part of the observation, thus resulting in net exposure times of 31.4 ks and 32.7 ks for EPIC-pn and EPIC-MOS, respectively.
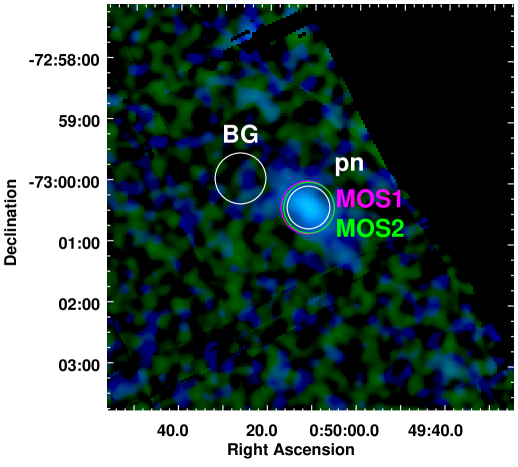
To define extraction regions (see Fig. 1) for the source and background with optimised signal to noise ratio, the SAS task eregionanalyse was used. We ensured that the source extraction region had a distance of 10″ to other detected sources. For the background extraction, we defined a circular region covering the same point source free area on the sky for all three detectors. To avoid systematic detector background variations present close to CCD borders where the source was located, we chose an area on the same CCDs as the source, and in the case of pn at a similar distance to the readout node. This restricted our selection to a radius of 25″. We extracted spectra, by selecting single and double pixel events from the EPIC-pn data and single to quadruple events from EPIC-MOS data, both with FLAG = 0. The EPIC-pn/MOS1/MOS2 spectra contain 989/464/396 background subtracted counts in the 0.2–10.0 keV band, respectively, and were binned to a minimum signal-to-noise ratio of 5 for each bin. To increase the statistics for the timing analysis we also generated a merged event list from all three instruments, containing 2053 cts (source + background).
2.1 Spectral analysis
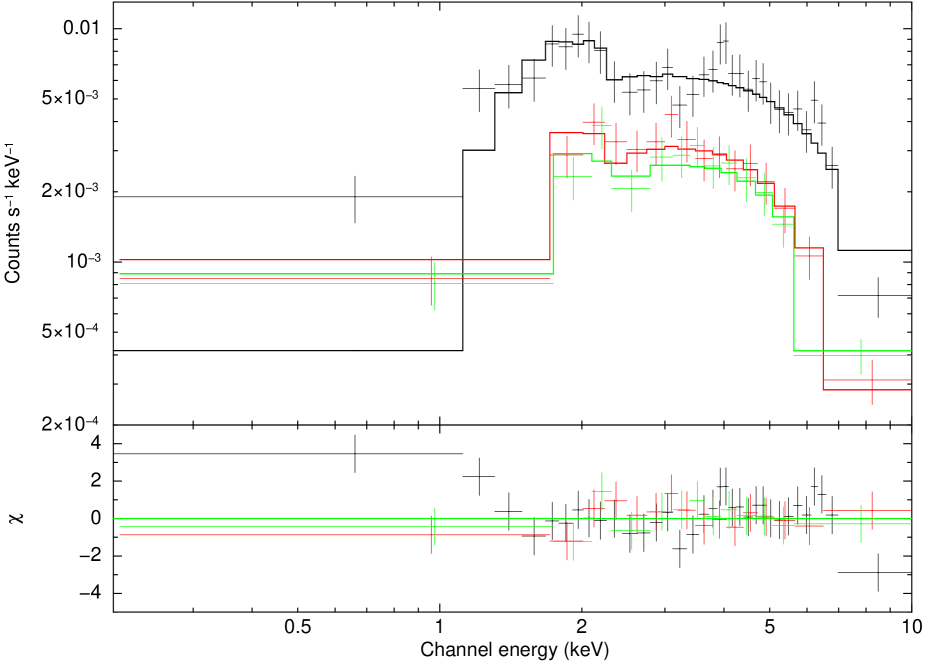
We used XSPEC (Arnaud et al, 1996) version 12.6.0k for spectral fitting. The three EPIC spectra (see Fig. 2) were fitted simultaneously with a common set of spectral model parameters and a relative normalisation factor for instrumental differences. The Galactic photo-electric foreground absorption was set to a column density of NH,GAL = 6 cm-2 with abundances according to Wilms et al (2000). The SMC column density was a free parameter with abundances for elements heavier than Helium fixed at 0.2 (Russell & Dopita 1992). The emission was modelled with an absorbed power-law where we obtained an SMC column density N cm-2, a photon-index and a flux in the 0.2–10.0 keV band of erg cm-2 s-1. Assuming a distance of 60 kpc, this corresponds to an unabsorbed luminosity of erg s-1. The model resulted in an acceptable fit with , with relative normalisation factors c, c (relative to c).
Since the EPIC-pn spectrum indicates a weak excess at 6.5 keV, we investigated a possible contribution of iron K emission lines at 6.4 keV (fluorescent emission) and 6.7 keV (Fe XXV) by assuming an unresolved line width. We obtained 90% upper limits of 4.0 photons cm-2 s-1 and 3.0 photons cm-2 s-1, which correspond to equivalent width upper limits of 215 eV and 163 eV, respectively.
2.2 Timing analysis
The photon arrival times were randomised within the detector CCD frame time and recalculated for the solar system barycentre using the SAS task barycen. We searched for pulsations in the X-ray light curves in the EPIC standard energy bands (0.2-0.5 keV, 0.5-1.0 keV, 1.0-2.0 keV, 2.0-4.5 keV and 4.5-10 keV) and combinations of them, using fast Fourier transform (FFT) and light curve folding techniques. The power density spectra derived from light curves in various energy bands from the different EPIC instruments showed a periodic signal at 0.00467 Hz. To maximise the signal to noise ratio, we created light curves from the merged EPIC event list (filtered by the GTIs common to EPIC-pn and -MOS). Figure 3 shows the inferred power density spectrum from the 0.2-10.0 keV energy band with the clear peak at a frequency of 0.00467 Hz. Following Haberl, Eger & Pietsch (2008) we used a Bayesian periodic signal detection method (Gregory & Loredo, 1996) to determine the pulse period with 1 error to s. In Fig. 4, pulse profiles folded with this period in different energy bands (based on the EPIC standard bands) are shown. Clear variations are seen above 1 keV, while due to the high absorption at lower energies the count rate is insufficient to detect a significant modulation. Hardness ratios were derived from the pulse profiles in two adjacent energy bands (HRi = (Ri+1 Ri)/(Ri+1 + Ri) with Ri denoting the background-subtracted count rate in energy band (with from 1 to 4). Given the relatively low count rate, no significant hardness ratio variations are seen. We determined a pulsed fraction of % for the 0.210.0 keV band, assuming a sinusoidal pulse profile.


2.3 Long-term X-ray variability
The position of SXP214 was observed with XMM-Newton three times before our large programme SMC survey, without any detection of the source. To derive upper limits, we used sensitivity maps of EPIC-pn and derived 3 upper limits in the 0.2–10.0 keV band of 5.3 cts s-1 (ObsID: 0110000101, 2000 Oct. 15), 1.1 cts s-1 (ObsID: 0404680101, 2006 Oct. 5), and 4.1 cts s-1 (ObsID: 0403970301, 2007 Mar. 12). Assuming the best fit power-law spectrum from above, this corresponds to absorbed flux limits of 5.0 erg cm-2 s-1, 1.0 erg cm-2 s-1, and 3.9 erg cm-2 s-1 or absorption corrected luminosity limits of 2.5 erg s-1, 5.0 erg s-1, and 1.9 erg s-1, respectively. The second limit is higher, due to a shorter background screened exposure of 7.7 ks, compared to 21 ks for the other two observations. The upper limits show that SXP214 increased in brightness at least by a factor of 30 during its outburst.
SXP214 has frequently fallen within the field of view of RXTE as part of the long-term monitoring of the SMC being carried out by some of the authors on this paper (see Galache et al, 2008 for a discussion of this campaign). Though the collimator sensitivity to SXP214 has been very high for periods of many months at a time, there are only eight possible detections with a confidence 99% at a high collimator response of 0.5 in over 10 years. These detections are shown in Figure 5. Unfortunately, the sparsity of these detections do not give us any significant insight into the binary period of this system. Neither do they reveal any obvious long term spin period change.
The RXTE pulse amplitude may be converted to luminosity assuming a distance of 60kpc to the SMC (though the depth of the sources within the SMC is unknown and may affect this distance by up to 10kpc). The X-ray spectrum was assumed to be a power law with a photon index = 1.5 and an . Furthermore it was assumed that there was an average pulse fraction of 33% for all the measurements and hence the correct total flux is 3 times the pulse component. Thus the luminosity may be determined from the pulse amplitude values shown in Figure 5 using the relationship:
= 0.4 3 erg s-1
where = pulsed amplitude counts in units of PCU-1 s-1.
The conclusion from the RXTE data is that there have been no major X-ray outbursts ( erg/s) over the last decade from SXP214.

3 The optical counterpart
3.1 Optical & IR photometry
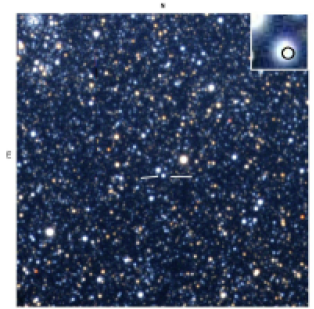
From its precise X-ray position the optical counterpart to SXP214 is identified as SMC SC5 207965 in OGLE II and SMC100.3 36998 in OGLE III (Udalski et al, 1997)- see Figure 6. It is also present in the MACHO data as object 212.15966.18, but since those data significantly overlap in time with the OGLE II data, and are not taken through a standard I band filter, they are not discussed any further. The long term optical measurements of the counterpart to SXP214 are presented in Figure 7.
An extra I band point was obtained as part of a set of BVRI observations made using the Faulkes Telescope on 25 Nov 2009 (MJD 55160) - 21d after the XMM detection reported here. The Faulkes Telescope is located at Siding Spring, Australia and is a 2m, fully autonomous, robotic Ritchey-Chretien reflector on an alt-azimuth mount. The telescope employs a Robotic Control System (RCS). The telescope was used in Real Time Interface mode for the observation of SXP214. All the observations were pipeline-processed (flat-fielding and de-biasing of the images). The magnitudes of the optical counterpart in all the observed bands were determined by comparison with several other nearby stars on the same image frame. In the case of the I-band stars from the OGLE database were used - these comparison stars have not exhibited any significant variability in the last 8 years of OGLE monitoring. In all other wavebands reference stars from the catalogue of Massey (2002) were used.
The IR counterpart is identified as Sirius 00501126-7300260 (Kato et al, 2007) and 2MASS 00501125-7300260. The Sirius observations took place on 31 August 2002 and obtained the following results: J = 15.320.02, K = 15.370.02. New measurements in the J, H & K photometric bands were obtained on 2009 Dec 11 (MJD 55176) with the same Sirius camera on the 1.4m IRSF telescope in South Africa (Kato et al. 2007). The full set of photometric measurements are shown in Table 1 and reveal that the IR magnitudes were fainter by 0.3 at the time of the XMM-Newton detection compared with the catalogue numbers.
| Waveband | Magnitude | Error on Magnitude |
|---|---|---|
| B | 15.22 | 0.02 |
| V | 15.33 | 0.02 |
| R | 15.47 | 0.01 |
| I | 15.47 | 0.03 |
| J | 15.67 | 0.02 |
| H | 15.55 | 0.03 |
| K | 15.61 | 0.09 |
The (B-V) colour index obtained from our data is (B-V)=–0.110.03. Correcting for an extinction to the SMC of E(B-V)=0.09 (Schwering & Israel 1991) gives an intrinsic colour of (B-V)=– 0.200.03. From Wegner (1994) this indicates a spectral type in the range B1V - B3V - typical of optical counterparts to Be/X-ray binaries in the SMC (McBride et al. 2008). However, care must always be taken when interpreting colour information as a spectral type in systems that clearly have circumstellar disks. Such disks can make significant contributions to the B and V bands.

The OGLE III data were detrended using a polynomial function and then subjected to a period search in the range 2 – 200d. Longer periods are harder to explore because they tend to approach the length of each data block (200d) and the annual observing cycle. Two strong adjacent peaks emerged in the power spectrum - see Figure 8. These peaks are at 4.520d and 4.576d. According to the Corbet diagram for the SMC sources (Corbet et al., 2009) it is very unlikely that SXP214 could have a binary period of this order. In fact, one of the two peaks (4.576d) appears to be a beat period between the other period and the annual sampling of the OGLE III data. This is confirmed by examining just one year of the data set which reveals just the one peak at 4.520d. Furthermore, if this period does not represent a binary period, then the most likely explanation is that it is a Non-Radial Pulsation (NRP) within the Be star (Diago et al., 2008), or, perhaps, the beat of the true NRP period with the daily sampling.

3.2 Optical spectroscopy
Spectroscopic observations of the H region were made on 11 Dec. 2009 (MJD 55176) using the 1.9m telescope of the South African Astronomical Observatory (SAAO). A 1200 lines per mm reflection grating blazed at 6800Å was used with the SITe CCD which is effectively 266 1798 pixels in size, creating a wavelength coverage of 6200Å to 6900Å . The intrinsic resolution in this mode was 0.42Å /pixel. The spectrum resulting from a 2000s integration is shown in Figure 9.

The signal to noise is poor in this spectrum, but there is definite evidence for a weak feature around H. An H line emission width of -1.51.0Å is estimated. Higher quality data are definitely required to establish if the line shows any structure. Absorption line features associated with HeI at rest wavelengths of 6406Å and 6676Å are also marked on the figure.
Additional observations were made using the Integral Field Spectroscopy (IFS) instrument on 28 December, 2010 at Siding Springs Observatory using the 2.3m Advanced Technology Telescope and its Wide Field Spectrograph (WiFeS). The 1200 second single exposure was made in the central region of SXP214 at position angle (east of north) 0 degrees under clear skies with seeing estimated at one arcsec. The exposure was made in classical equal mode using the RT560 beam splitter and 3000 Volume Phased Holographic (VPH) gratings. For these gratings, the blue (708 lines mm-1) range includes 3200 – 5900 Å. The data were reduced using the WiFeS data reduction pipeline based on NOAO (National Optical Astronomy Observatory) IRAF software. This data reduction package was developed from the Gemini IRAF package (McGregor et al. 1997). Use of the pipeline consists of four primary tasks: wifes to set environment parameters, wftable to convert single extension FITS file formats to Multi-Extension FiTS ones and create file lists used by subsequent steps, wfcal to process calibration frames including bias, flat-field, arc and wire; and wfreduce to apply calibration files and create data cubes for analysis. Using QFitsView3222Written by Thomas Ott and freely available at www.mpe.mpg.de/ ott/dpuser/index.html, a spectrum of SXP214 in the blue range was created and is shown in Figure 10.

4 Discussion and Conclusions
During the XMM-Newton survey of the SMC we discovered a new hard X-ray transient with a 0.210 keV luminosity of erg/s. The precise position derived from the EPIC data allowed us to identify a V=15.3 mag early type star as optical counterpart. An optical spectrum taken at SAAO revealed a weak Hα line which clearly identifies the source as a Be/X-ray binary in the SMC. After SXP11.87, this is the second discovery of such a system during the XMM-Newton SMC survey (Sturm et al 2010).
SXP214 shows X-ray pulsations with a period of 214.05s and a hard (power law) X-ray spectrum (photon index of 0.65). Conspicuous are the residuals in the EPIC-pn spectrum at low energies (1.5keV - see Fig. 2). This might be caused by instrumental differences at high off-axis angles or by the contribution of a soft excess (Hickox et al, 2004). In the latter case, the low count rate and the high absorption do not allow to fit an additional component. We note that a soft excess originating near the neutron star (accretion column or disk) and absorbed by the same high column density as the power-law component would require an unrealistic high luminosity of L1039 erg s-1 to cause this signal. Therefore, if a soft spectral component exists, it more likely originates in an optically thin gas cloud around the neutron star attenuated by much lower absorption. Given the relatively low outburst luminosity of SXP214, this is consistent with the conclusions about the origin of soft excesses in spectra of HMXBs drawn by Hickox et al (2004).
At the time of this XMM-Newton detection and other related observations, the source seems to be in an optical low state compared with the past decade. In addition, the three previous XMM-Newton observations of SXP214 have upper limits at least a factor of 10 below the flux level reported here (erg/s). So at first glance it seems strange that it was finally detected by XMM-Newton when the optical flux was at such a low point. However, placing SXP214 on the Corbet diagram would suggest a binary period of the order 100–200d. It is therefore very probable that the previous observations failed to catch the system with the neutron star at periastron and hence missed any Type I outbursts that may have occurred. The long-term RXTE monitoring (Figure 5) at a good collimator sensitivity clearly shows the lack of any more prolonged (1 month) Type II outbursts from this system.
Not only is the I band flux at a very low value for this system, but the H equivalent width also implies a very minimal circumstellar disk was present in late 2009. If Kuruscz model atmospheres (Kuruscz 1979) representing the proposed spectral class range (B1V - B3V) are normalised to the dereddened B band flux (using E(B-V)=0.09 from Schwering & Israel, 1991), it again becomes clear that there is very little evidence for any substantial IR excess arising from a circumstellar disk - see Figure 11. So anything from B1V with a small disk, to B3V with essentially no disk at all, offers a satisfactory fit to all the optical and IR data.

A more precise spectral classification may be determined from Figure 10. Following the method given in Evans et al (2004) an absence of HeI 4200, 4541 lines defines the class to be later than B0. The weak but approximately equal strength of Mg II (4481) and Si III(4553) narrows it down to B2.5, though it could be up to half a class on either side. In the context of the luminosity class, if we take the V band magnitude presented here and correct for the distance modulus (18.9) and the extinction to the SMC (E(B-V)=0.08) an absolute magnitude of -3.83 results. Comparing this to the data in Wegner (1994) predicts a luminosity class III for a B2 star. So the best spectral identification from the data presented here gives B2-B3 III, which adds further support to a minimal circumstellar disk in this system.
In contrast, the column density derived from the X-ray spectrum of cm-2 is relatively high for Be/X-ray binaries in the SMC (see Fig. 12 in Haberl et al. 2008) and largely exceeds the total SMC HI column density of cm-2 (Stanimirovic et al. 1999). This suggests a large amount of source-intrinsic absorption close to the neutron star or that the line of sight to the X-ray source during the XMM-Newton observation passed close to the Be star, implying a large system inclination. An even more extreme case is the Be/X-ray binary pulsar SXP1323 = RX J0103.67201 presented by Eger & Haberl (2008). During one of more than twenty XMM-Newton observations of RX J0103.67201 the absorption exceeded cm-2, completely suppressing the hard power-law component at energies below 2 keV and revealing a strong soft spectral component, likely caused by re-processing in optically thin gas. In the case of SXP214, this soft component is much weaker, consistent with the conclusion from above that only a minimal circumstellar disk was present during the XMM-Newton observation. It is worth noting that within our galaxy columns of up to cm-2 have been measured for some highly obscured HMXB systems.
5 Acknowledgements
R.S. acknowledges support from the BMWI/DLR grant FKZ 50 OR 0907. LJT is supported by a University of Southampton Mayflower Scholarship. As always, we are grateful to the support staff in SAAO for help in using the 1.9m and IRSF telescopes. The Faulkes Telescope Project is an educational and research arm of the Las Cumbres Observatory Global Telescope Network (LCOGTN). The OGLE project has received funding from the European Research Council under the European Community’s Seventh Framework Programme (FP7/2007-2013)/ERC grant agreement no. 246678 to AU. MDF thanks Australian Government AINSTO AMNRF for grant number 10/11-O-06.
References
- (1) Antoniou, V., Zezas, A., Hatzidimitriou, D. & Kalogera, V. 2010, ApJ, 716, L140.
- Arnaud (1996) Arnaud, K. A. 1996, in Astronomical Society of the Pacific Conference Series, Vol. 101, Astronomical Data Analysis Software and Systems V, ed. G. H. Jacoby & J. Barnes, 17.
- (3) Coe M.J. 2000 in “The Be Phenomenon in Early-Type Stars”, IAU Colloquium 175, ASP Conference Proceedings, Vol. 214, ed: M. A. Smith H. F. Henrichs. Astronomical Society of the Pacific, p.656.
- (4) Coe M.J., Edge W.R.T, Galache J.L., McBride V.A. 2005 MNRAS 356, 502
- (5) Coe M.J. et al. 2008 The Magellanic System: Stars, Gas, and Galaxies, Proceedings of the International Astronomical Union, IAU Symposium, Volume 256, p. 367-372.
- (6) Corbet, R. H. D., Coe, M. J., McGowan, K. E., Schurch, M. P. E., Townsend, L. J., Galache, J. L., Marshall, F. E. 2009 The Magellanic System: Stars, Gas, and Galaxies, Proceedings of the International Astronomical Union, IAU Symposium, Volume 256, p. 361-366.
- (7) Diago, P. D., Guti rrez-Soto, J., Fabregat, J., Martayan, C. 2008 A&A 480, 179.
- (8) Eger, P. & Haberl, F., 2008 A&A 491, 841.
- (9) Evans C.J., Howarth I.D., Irwin M.J., Burnley A.W. & Harroes T.J., 2004 MNRAS 353, 601.
- (10) Galache, J. L.; Corbet, R. H. D.; Coe, M. J.; Laycock, S.; Schurch, M. P. E.; Markwardt, C.; Marshall, F. E.; Lochner, J. 2008 ApJS 177, 189.
- Gregory & Loredo (1996) Gregory, P. C. & Loredo, T. J. 1996, ApJ, 473, 1059
- Haberl et al. (2008) Haberl, F., Eger, P., & Pietsch, W. 2008, A&A, 489, 327
- (13) Haberl, F. & Pietsch,W. 2008a, in X-rays From Nearby Galaxies, ed. S. Carpano, M. Ehle, & W. Pietsch, 32 37
- Hickox et al. (2004) Hickox, R. C., Narayan, R., & Kallman, T. R. 2004, ApJ, 614, 881
- (15) Kato D. et al., 2007 Publ. Astron. Soc. Japan, 59, 615.
- (16) Kurucz, R.L., 1979, ApJS, 40, 1
- (17) Liu, Q. Z.; van Paradijs, J.; van den Heuvel, E. P. J. 2005, A&A 442, 1135.
- (18) Liu, Q. Z.; van Paradijs, J.; van den Heuvel, E. P. J. 2006, A&A 455, 1165.
- (19) Massey 2002 ApJS 141, 81.
- (20) McBride V.A., Coe M.J., Negueruela I., Schurch M.P.E. and McGowan K.E. 2008 MNRAS 388, 1198.
- (21) McGregor, P.J., Hart, J., Conroy, P., Pfitzner, L., Bloxham, G., Jones, D., Downing, M., Dawson, M., Young, P., Jarnyk, M. & van Harmelen, J. 2003, Proc. SPIE, 4841, 1581.
- (22) Negueruela I 1998 A&A 338, 505.
- (23) Okazaki A.T. & Negueruela I., 2001, A&A 377, 161.
- (24) Russel S.C & Dopita M.A., 1992 ApJ 384, 508.
- (25) Schwering P.B.W. & Israel F.P., 1991, A&A, 246, 231.
- (26) Stanimirovic S., Stavely-Smith L., Dickey J.M., Sault R.J., Snowden S.L., 1999 MNRAS 302, 417.
- (27) Stella L., White N.E. & Rosner R. 1986 ApJ 308, 669.
- (28) Strüder, L., et al. 2001, A&A, 365, L18
- (29) Sturm R. et al., 2010 A&A (in press).
- (30) Turner, M. J. L., et al. 2001, A&A, 365, L27
- (31) Udalski A., Kubiak M. & Szymanski M. 1997 Acta Astron 47, 319.
- (32) Wegner 1994 MNRAS 270, 229.
- Wilms et al. (2000) Wilms, J., Allen, A., & McCray, R. 2000, ApJ, 542, 914
- Zaritsky et al. (2002) Zaritsky, D., Harris, J., Thompson, I. B., Grebel, E. K., & Massey, P. 2002, AJ, 123, 855