Dipartimento di Fisica, Università di Parma - Via G.P.Usberti 7/a, 43100 Parma, Italy
Spin Dynamics at the Mott Transition and in the Metallic State of the Cs3C60 Superconducting Phases
Abstract
We present here 13C and 133Cs NMR spin lattice relaxation data in the A15 and fcc-Cs3C60 phases for increasing hydrostatic pressure through the transition at from a Mott insulator to a superconductor. We evidence that for the data above display metallic like Korringa constant values which match quantitatively previous data taken on other C60 compounds. However below the pressure for which goes through a maximum, is markedly increased with respect to the Korringa values expected in a simple BCS scenario. This points out the importance of electronic correlations near the Mott transition. For singular dependences of are detected for . It will be shown that they can be ascribed to a large variation with temperature of the Mott transition pressure towards a liquid-gas like critical point, as found at high for usual Mott transitions.
pacs:
71.30.+hpacs:
74.70.Wzpacs:
74.25.njMetal-insulator transitions and other electronic transitions Carbon-based superconductors Nuclear magnetic resonance
1 Introduction
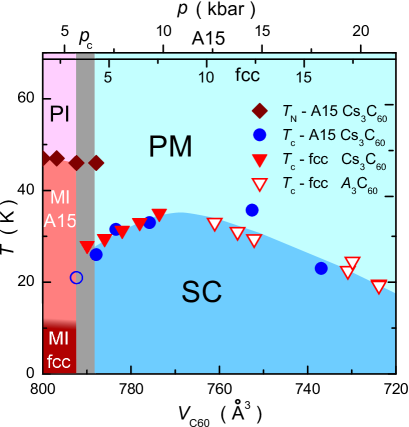
Among the various systems presenting a transition from a magnetic to a high superconducting (SC) state, the recently discovered fulleride A15-Cs3C60 phase [1] takes a very special place. Indeed, as in cuprates, the transition observed there is from a Mott insulating state to a SC state, contrary to Fe pnictides in which SC and metallic magnetism are contiguous. We have found [2] that the pressure controlled transition occurs at different pressures of 3.5(5) kbar and 6.5 (5) for the two isomeric structures of Cs3C60 (A15 and fcc respectively). Below the ground magnetic states of the insulating phases were found distinct for the two structures. The A15 is a Néel antiferromagnet (AF) while the fcc phase, which is not a bipartite structure, displays a more complicated magnetism. Otherwise the phase diagrams can be mapped into a unique one, recalled in Fig. 1, when plotted versus , the unit volume per C60 molecule (as confirmed independently in Ref. [3]). This established that the interball distance is the driving parameter for the electronic properties of both compounds. The phase diagram displays a SC dome, reminiscent of that found in cuprates, with a maximum near the first order phase boundary below which the insulating Mott state sets in.
But this analogy should be taken cautiously, as in the fullerides the transition occurs in a three-dimensional (3D) crystal structure with a fixed number of carriers, while in cuprates it appears in a two-dimensional (2D) lattice of Cu sites, with hole or electron doping [4], which is furthermore a source of dopant induced disorder of prime importance for the physical properties [5]. More importantly C60 have been so far considered as standard BCS(-type) phonon driven superconductors [6], with a clear singlet -wave pairing, distinct from the -wave pairing demonstrated in cuprates [7] or anticipated in 2D organics [8]
One should notice that such a phase diagram had been anticipated by Capone et al., from ground state calculations assuming an electron phonon mechanism for SC [9, 10, 11]. The electronic correlations are of course embedded in this theoretical treatment in which a low spin state is favoured by the on-ball Jahn-Teller effect for the three electrons transferred on the C60 balls. These authors predicted that pure BCS equations cannot apply and that the normal state near the Mott transition, where increases with pressure, is a non Fermi liquid exhibiting a moderate increase of the spin susceptibility or effective mass.
Here we report NMR data on the electronic properties of these compounds which can be compared to these predictions. We demonstrate that the nuclear spin lattice relaxation data on 13C and 133Cs taken near the Mott transition can by no way be described by a simple pressure induced modification of the density of states in a non correlated band. On the contrary magnetic fluctuations concentrate near the Mott transition and only progressively give place to those resembling a Fermi liquid through the pressure for which is maximum. We give here evidence for a step increase of at the critical pressure , a behaviour quite analogous to that seen in organic compounds displaying a Mott transition [12]. We find that increases with as expected from the lattice expansion. Furthermore apparently terminates at a critical point located near room temperature.
2 Experimental techniques
One only expects limited accuracy from 13C NMR shift measurements in fullerene compounds in view of the large anisotropy of hyperfine couplings for the 13C nucleus [13]. We could however evidence that way [2] the large paramagnetic response in the Mott state of the Cs3C60 phases. But, in fullerene compounds, data have been generally more useful [14, 15].
Let us recall that allows to probe the wave vector dependent dynamic spin susceptibilities of the electron spins through the general relation
| (1) |
Here the dependence of the hyperfine coupling constant of the probe nucleus is determined by its spatial location with respect to the magnetic sites.
We have therefore undertaken some 13C NMR measurements on both A15 and fcc phases, as this allows comparison with the available data for the other alkali C60 fullerides [13, 16], the hyperfine coupling being then local, i.e. independent of the lattice structure. We have selected here two samples described in Ref. [2] with respective C60 molecular concentration of A15, fcc and Cs4C60 phases of (A1: ) and (F1: ). This allows us avoiding contamination by Cs4C60 for the dominant fcc phase sample and by the fcc phase for the dominant A15 phase. We have also taken advantage of the selectivity permitted by the 133Cs NMR [2], with three resolved Cs sites (O, T, T’), to study the variations in a large range on sample F1. Furthermore, in this case the absence of quadrupole effects yields exponential recoveries of the nuclear magnetization.
The pressure experiments on the fcc phase were not performed using a classical clamp cell which might yield inaccurate pressure control as we are lacking temperature insensitive pressure sensors. Here we used an externally controlled system in which a pressure generator is connected to the pressure cell through a capillary tubing. The pressure is transmitted to the sample space via a pressure multiplier mounted in the pressure cell. We have used isopentane and Flourinert-77 (3M) as pressure mediaa for the first and second stage respectively. Within this media setup we were able to accurately adjust the pressure which is measured at room while cooling the cell, until the complete solidification of Flourinert. The pressure loss due to the multiplier has been calibrated and does not exceed kbar in the pressure range used in this study, so that the accuracy of the pressure in these experiments is better than kbar.
3 Spin dynamics in the metallic state
In weakly correlated elemental metals, is related to , the density of states at the Fermi level, and is independent for a purely local on-site hyperfine coupling. Equation (1) resumes in that case into the Korringa relation
| (2) |
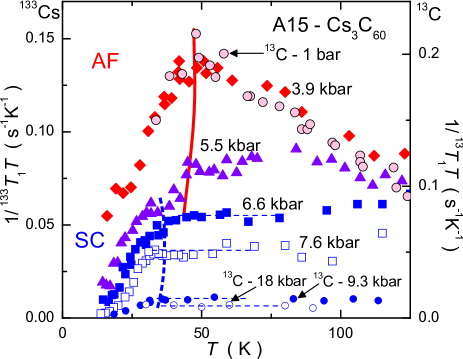
Such a variation is of course not observed in the Mott insulating paramagnetic state. Indeed there, as can be seen for instance in Fig. 2 for the A15 phase, increases markedly at low for both 13C and 133Cs nuclei and drops abruptly at the Néel transition at K. At the highest pressures, well into the metallic phase, the data display the constant expected metallic behaviour. But, when is decreased towards kbar, the metallic behaviour is seen only above up to about K and deviations begin to occur at higher , as will be much better seen on the fcc phase data.
Let us consider first here the 13C NMR data, for which these constant values taken well above the Mott transition pressure are plotted then versus in Fig. 3. There, one can see that for both the A15 and fcc-Cs3C60 phases the data merge with the smooth curve found on the other fcc-C60 compounds [16].
The corresponding variation of versus (or lattice constant) has been used at length in the past to indicate that a BCS formalism applies to the fcc-C60 compounds. In this framework, is given by
| (3) |
This has led to consider that the Debye frequency and the electron-phonon coupling depend solely on C60 molecular properties, so that a smooth variation of with drives both variations of and [6]. Here we observed by r.f. susceptibility measurements that goes through a maximum versus in both phases while steadily increases. This is indicative of a breakdown of Eq. (3), as one would expect a decrease of or of when goes through the optimum value.
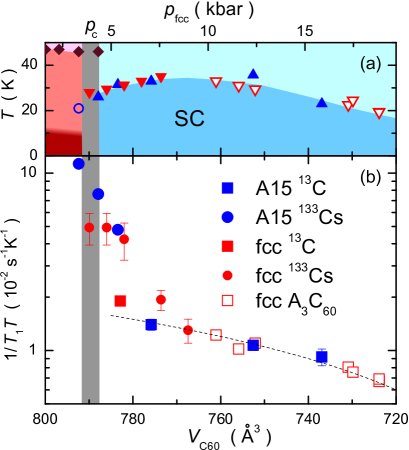
To better probe the evolution near the MIT, we considered as well 133Cs data, which appear qualitatively similar to those on 13C, as shown in Figs. 2 and 4. The raw data are found to display a large increase of with decreasing pressure from the top of the SC dome towards the Mott transition. This definitely points out an incidence of electronic correlations. 111When magnetic correlations between C60 sites enter into play near the MI transition or near the Mott transition, the non local 133Cs hyperfine coupling might yield differences between the variations of 133Cs data and of the 13C data, as the latter probe directly the on-site magnetic fluctuations. However, this may only yield a reduction of the contribution of the AF fluctuations to , so the actual increase of when approaching could only be larger. The 133Cs data for the A15 phase could be scaled with that of 13C, using the ratio obtained from the bar data in the paramagnetic state from Fig. 2. For the fcc phase the 133Cs T’ site data plotted in Fig. 3 have been scaled by fixing the kbar point of Fig. 4 on the dotted curve known for the smaller values. The scaled values in Fig. 3 display a large deviation near the Mott transition which confirms that Eqs. (2) and (3) do not apply.
4 Metal Insulator transition
Let us now consider our measurements versus for various pressures which we have performed mostly on 133Cs NMR in order to benefit from the phase selectivity allowed by the large difference of spectra between the two phases on these nuclei (see Ref. [2]). The data displayed in Fig. 2 and Fig. 4 are qualitatively similar for both phases. However in the following part of the paper we shall restrict to the fcc phase on which we could take reliable data in a large range of pressures and temperatures. There we have measured on the three Cs sites O, T, T’ but did find that at low the signals of the O and T sites become so close in frequency that they can hardly be resolved. This becomes even impossible below due to the loss of spin susceptibility associated with singlet pairing. So we restricted the data displayed in Fig. 4 to that above for the T’ site which is better separated from the T site and has a close to that of the T site, which ensures that nuclear-spin cross relaxation effects do not influence significantly the data.
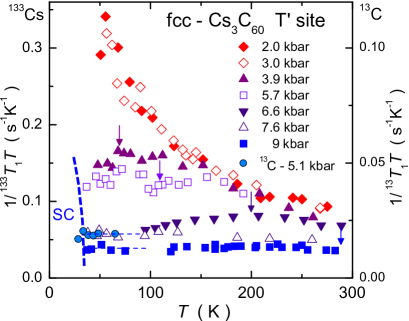
For , the data differ markedly at low from that in the Mott state, go through a maximum, and then decrease progressively at high temperature , as can be seen in Fig. 2. The regime of constant , which extends nearly to room in the higher pressure cases, reduces to smaller ranges when decreases towards . This maximum in might bear some analogy to that seen in underdoped cuprates, and could be hastily attributed to a pseudogap [17], or spin gap in the magnetic excitations [18]. This maximum occurs at a temperature which increases when (and ) increase on the superconducting dome. Then, this analogy does not hold as in cuprates decreases with increasing doping [17] towards the optimum .
More importantly, one can notice in Fig. 4 that the data for , after reaching their maximal values, evolve progressively at high towards the data measured below in the Mott insulating paramagnetic state. There the localized electron spins exhibit Curie-Weiss behaviour and for a dense local-moment paramagnet, one expects local fluctuation of the moments dominated by the exchange coupling with their neighbors, with a high temperature limit
| (4) |
This fits nicely the previous observations in A15 and fcc phases [2] for which scales at high with [19, 2]. Then, in the fcc phase for pressures between kbar and kbar, we see in Fig. 4 that at high the data seems to keep initially the same behaviour as that found in the Mott state. At lower the excitations are progressively suppressed and transform into the Korringa like behaviour discussed above in the metallic state. 222 This points again at a different situation from that found for the cuprate pseudogap. Indeed in that case the pseudogap is a depression at low of the DOS in a high metallic state, while here the depression occurs in a Curie paramagnetic state and results in a low metallic state.
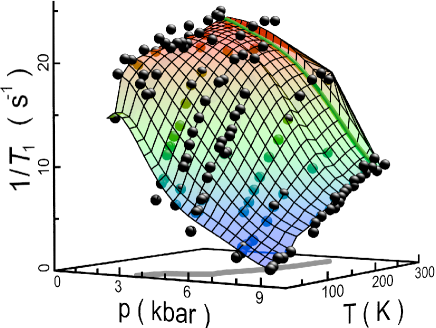
To monitor differently the evolution of the local moment contributions to with increasing pressure we have therefore plotted the data of Fig. 4 in a 3D plot of versus shown in Fig. 5. One can see as well that at high the data converges for all pressures below kbar towards the constant value found in the ambient pressure insulating state. Here one can see that the data below kbar are nearly constant at high . The decrease detected below K has been assigned [2] to the incidence of interactions between the local moments. This leads to a decrease in much weaker in the frustrated magnet fcc phase [2] than in the real gap opening Néel phase of the A15-Cs3C60. In this representation one is then led to view isothermal lines, in which the data, constant at low , in the insulating state drops with increasing towards the metallic behaviour. Indeed if we look at the surface which approximates all the data points in Fig. 5, the drop at from the low to the high behaviour at constant and from the high to the low behaviour at constant can be seen to occur at inflexion points of the fitting grid. Those correspond in the latter case to the maxima indicated by arrows in Fig. 4. We do not see here very sharp steps of as would be expected for a first order transition. This appears quite natural as no special care was taken to see hysteresis effects in these isopressure measurements when varying the temperature. The large set of data obtained here however allows us to locate the transition pressure at which such a step like decrease of is observed at fixed .
This reveals that the transition pressure indeed increases with increasing so that the line is not vertical in the plane, as shown in Fig. 6(a). One should however remind that these materials are quite compressible and have a high thermal expansion, the dilatation from 0 to K corresponding to a ‰ increase of . Therefore the data plotted in Fig. 5 correspond to variable inter-ball distance. If one takes into account the variation of the lattice constant with and from Ref. [3], one can as well plot the Mott transition temperature versus as done on Fig. 6(b). It is remarkable then to find out that this leads to a nearly vertical line, which indicates that the transition is indeed governed by interball distance, that is by the magnitude of the transfer integral or ratio.
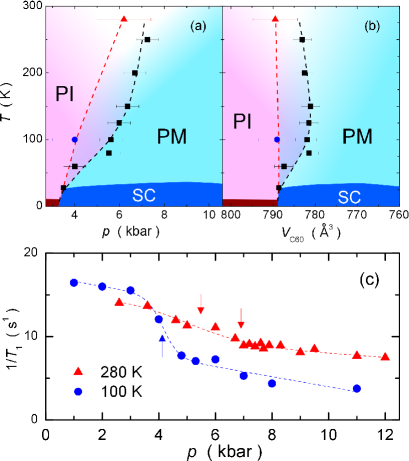
Let us point out that a decrease of step height with increasing could be guessed in the set of data of Fig. 4 and 5. However these data being only taken at that time for a limited set of pressure values we could not quantify the step height values accurately. To get better data on the evolution of at the transition we have then performed a more systematic study of its variation with first at a fixed K and then at K. Here we do find now as seen in Fig. 6(c) that at K the step of is quite visible and occurs at kbar near the kbar value obtained from the diamagnetic susceptibility data [2]. At K the variation of is rather smooth so that the transition is more difficult to locate. The lower arrow in Fig. 6(c), would correspond to a widened transition, while the second one would correspond to a crossover resuming in a kink at kbar. Both cases would indicate that one approaches a critical point at room , as in a liquid-gas transition 333The data of Fig. 6(c) has been taken six month later than Fig. 4 and 5. After curing such a long time at room in the pressure cell a slight decrease of values as compared to those of Fig. 5 has been observed together with a small shift of the transition towards lower pressures displayed in Fig. 6a. Such an evolution might be assigned to a small increase of sample metallicity, that is an increase of sample density at ambient pressure., in analogy to what has been seen in other Mott transitions i.e. in organic compounds [12].
Finally, as had been suggested for the metallic state of the dense C60 compounds [15], excitations from the to the Jahn Teller molecular state are expected at sufficiently high . Those should be seen already in the insulating state and should appear as a high increase of , as expected from Eq. (4) for . As seen in Fig. 5 we did not detect any such increase at bar for fcc-Cs3C60, so that these excitations would only be detectable above room . Capone et al. predicted that the energy distance between the two molecular states should decrease in the metallic state below the optimal , yielding a situation reminiscent to that of a pseudogap. So far, the variation with pressure of the transition line does not allow us here to probe these excitations, which apparently might only occur above room , even in the metallic states.
5 Discussion
Here we have performed 133Cs and 13C measurements under pressure which bring quite novel insight on SC near the Mott transition at in the fcc-C60 compounds, and on the Mott transition itself in the fcc phase of Cs3C60. We have shown that, just above in the metallic state, deviates in both phases near from the trend observed for the dense C60 compounds. The large observed increase of indicates that spin fluctuations in the metallic state become prominent before the system switches into the Mott state.
Capone et al. [10, 11] were suggesting a moderate increase of the spin susceptibility when approaching the MIT, which would lead to deviations from the smooth versus DOS BCS prediction. The significant increase of found here is similarly an evidence that the variation deviates then from pure BCS but it is also a signature of strong magnetic correlations near the transition. Calculations of the dynamic susceptibility within their theoretical scheme should help to decide then whether the large values in C60 compounds does indeed result from a fundamental cooperation between spin fluctuations and electron phonon interactions.
We have shown here that the variations of versus at fixed although analogous to those expected for a pseudogap, mainly monitor the shift of the transition pressure with temperature due to lattice expansion. The large dependence of the transition pressure found here is somewhat similar to that seen in 2D-organics. In the present experiments, the "liquid-gas like" critical point of the phase diagram is located near room . While in the 2D organics the Mott transition might be influenced by the pressure induced increase of interplane coupling, in the present 3D system we are probing a simple variation of through the reduction of lattice parameter. Therefore, in the range probed here the qualitative behaviour detected appears quite similar to those expected for a single orbital Mott transition [20], although the ground sate is orbitally degenerate.
To conclude, the local probe studies of Cs3C60 provided here reveal that it is certainly a unique system in which 3D multiorbital behaviour coexists with singlet wave fully gapped SC and spin fluctuations in the metallic state near the MIT. The fact that we could not evidence here the excitations between the low spin and high spin molecular states calls for ab initio determination of their energy difference. Measurements of other thermodynamic and spectral properties, possibly on larger ranges are required to complete the experimental insight on this Mott transition.
Acknowledgements.
We thank V. Brouet, M. Capone, M. Fabrizio, F. Rullier-Albenque and E. Tosatti for stimulating exchanges about these experimental results and careful reading of the manuscript. Y. I. acknowledges JSPS Postdoctral Fellowships for Research Abroad.References
- [1] \NameTakabayashi Y., Ganin A. Y., Jeglič P., Arčon D., Takano T., Iwasa Y., Ohishi Y., Takata M., Takeshita N., Prassides K. Rosseinsky M. J. \REVIEWScience 32320091585.
- [2] \NameIhara Y., Alloul H., Wzietek P., Pontiroli D., Mazzani M. Riccò M. \REVIEWPhys. Rev. Lett. 1042010256402.
- [3] \NameGanin A. Y., Takabayashi Y., Jeglič P., Arčon D., Potočnik A., Baker P. J., Ohishi Y., McDonald M. T., Tzirakis M. D., McLennan A., Darling G. R., Takata M., Rosseinsky M. J. Prassides K. \REVIEWNature 4662010221.
- [4] \NameLee P. A., Nagaosa N. Wen X.-G. \REVIEWRev. Mod. Phys. 78200617.
- [5] \NameAlloul H., Rullier-Albenque R., Vignolle B., Colson D. Forget A. \REVIEWEPL 91201037005.
- [6] \NameGunnarsson O. \REVIEWRev. Mod. Phys. 691997575.
- [7] \NameTsuei C. C., Kirtley J. R., Chi C. C., Yu-Jahnes L. S., Gupta A., Shaw T., Sun J. Z. Ketchen M. B. \REVIEWPhys. Rev. Lett. 731994593.
- [8] \NameLefebvre S., Wzietek P., Brown S., Bourbonnais C., Jérome D., Mézière C., Fourmigué M. Batail P. \REVIEWPhys. Rev. Lett. 8520005420.
- [9] \NameCapone M., Fabrizio M., Giannozzi P. Tosatti E. \REVIEWPhys. Rev. B 6220007619.
- [10] \NameCapone M., Fabrizio M., Castellani C. Tosatti E. \REVIEWScience 29620022364.
- [11] \NameCapone M., Fabrizio M., Castellani C. Tosatti E. \REVIEWRev. Mod. Phys. 812009943.
- [12] \NameKagawa F., Miyagawa K. Kanoda K. \REVIEWNature Physics 52009880.
- [13] \NamePennington C. H. Stenger V. A. \REVIEWRev. Mod. Phys. 681996855.
- [14] \NameBrouet V., Alloul H., Quéré F., Baumgartner G. Forró L. \REVIEWPhy. Rev. Lett. 8219992131.
- [15] \NameBrouet V., Alloul H., Garaj S. Ferró L. \REVIEWPhys. Rev. B 662002155122.
- [16] \NameManiwa Y., Saito T., Ohi A., Mizoguchi K., Kume K., Kikuchi K., Ikemoto I., Suzuki S., Achiba Y., Kosaka M., Tanigaki K. Ebbesen T. W. \REVIEWJ. Phys. Soc. Jpn. 6319941139.
- [17] \NameAlloul H., Ohno T. Mendels P. \REVIEWPhys. Rev. Lett. 6319891700.
- [18] \NameYoshimura K., Imai T., Shimizu T., Ueda Y., Kosuge K. Yasuoka H. \REVIEWJ. Phys. Soc. Jpn 5819893057.
- [19] \NameJeglič P., Arčon D., Potočnik A., Ganin A. Y., Takabayashi T., Rosseinsky M. J. Prassides K. \REVIEWPhys. Rev. B 802009195424.
- [20] \NameGeorges A., Kotliar G., Krauth W. Rozenberg M. J. \REVIEWRev. Mod. Phys. 68199613.