SOLAR ACTIVITY INDICES IN 21,22 AND 23 CYCLES
E.A.Bruevich a, G.V. Yakunina b
Sternberg Astronomical Institute, Moscow, Russia
E-mail:ared-field@yandex.ru,byakunina@sai.msu.ru
The monthly average values of the main solar activity indices such as Wolf numbers (W), 10,7 cm radio flux , 0,1-0,8 nm background, total solar irradiance and Mg II UV-index (280 nm core to wing ratio) were studied for 23 activity cycle. The correlation coefficients of linear regression for main solar activity indices versus were analyzed for every year of 23 activity cycle. All the correlation coefficients for 23 activity cycle have the minimum values in 2001. We also analyzed the connection between monthly average values of the most popular indices W and for 21, 22 and 23 solar activity cycles. The values of every year linear regression correlation coefficients for W versus show the cyclic variations with period closed to half path of so-called 11-year period of solar activity.
KEYWORDS: Sun, solar activity indices, monthly average values variations, correlation coefficients of linear regression for main solar activity indices
Introduction
We analyze the main solar activity indices variations at 11-year time scale. These indices are: Wolf numbers W, 10,7 cm radio flux , the X-ray 0,1-0,8 nm background, the UV Mg II 280 nm core to wing ratio and total solar irradiance. Most of the observational data we used in our issue were published in Solar-Geophysical Data bulletin. Solar-Geophysical Data was a monthly bulletin issued from 1955 to 2009 in one or two parts (published by NOAA National Geophysical Data Center) that provides the scientific community with a variety of solar-terrestrial data.
The Wolf numbers is a very popular solar activity index: the series of Wolf numbers observations continue more than two hundred years.
The solar radio microwave flux at wavelengths 10,7 cm has also the longest running series of observations (it’s nominally an absolute flux, measured in units Watt per square meter per Hertz) started in 1947 in Ottawa, Canada and maintained to this day at Pentiction site in British Columbia.
This emission comes from high part of the chromosphere and low part of the corona. It has two different sources: thermal bremsstrahlung (due to electrons radiating when changing direction by being deflected by other charged participles) and gyro-radiation (due to electrons radiating when changing direction by gyrating around magnetic fields lines) [1]. These mechanisms give rise to enhanced radiation when the temperature, density and magnetic fields are enhanced. So is a good measure of general solar activity.
The Mg II 280 nm is important solar activity indicator of radiation. It has been shown that the Mg II index derived from daily solar observations of the core-to-wing ratio of the Mg II doublet at 279,9 nm provides a good measure of the solar UV variability and can be used as a reliable proxy to model extreme UV variability during the solar cycle [2,3,4].
The Mg II observation data were obtained from several satellite (NOAA, ENVISAT) instruments. NOAA started in 1978 (during 21,22 and first part of 23 solar activity cycles), ENVISAT was launched on 2002 (last part of 23 solar activity cycle). Comparison of the NOAA and ENVISAT Mg II index observation data shows that both the Mg II indexes agree to within about 0,5%. The correlation coefficient is about 0,995 - very high. We used the ENVISAT Mg II index observation data for the last part of 23 solar activity cycle published in Solar Geophysical Data bulletin and NOAA Mg II index observation data for the first part of 23 solar activity cycle published in [2].
Data of GOES observations of the X-ray 0,1-0,8 nm background for 23 cycle were taken from Solar Geophysical Data bulletin. This permanent monitoring of solar disk in 0,1-0,8 nm is sufficient enough not only for flares observations and flares prediction but 0,1-0,8 nm background observational data is a good activity index of solar corona activity without flares.
Data of total solar irradiance SOHO observations for 23 cycle were taken from Solar Geophysical Data bulletin. Earlier from 1985 to 2000 total solar irradiance was observed by Earth Radiation Budget Satellite (EBRS). The values of total solar flux vary from 1364 to 1367 Watt per square meter for 21,22 and 23 cycles.

(monthly average values) in 21, 22 and 23 solar activity cycles
The 11-year fluxes variation are widely spread phenomenon for F, G and K stars (not only for Sun). The activity indices variations for solar-type stars were studied at Mount Wilson observational program during 45 years, from 1965 to present time [8].
These observations of the sensitive chromospheric activity indicators (radiative fluxes at the centers of the H and K emission lines of Ca II - and nm respectively) show that about 30 % of Mount Wilson project stars are characterized by the regular cyclic activity on the 11-year time scale [9].
Figure 1 demonstrates monthly average values of Wolf numbers and in 21, 22 and 23 solar activity cycles. The Wolf numbers and fluxes show the pronounced determined two maximum in all the activity cycles.
The most expressive two maximum form (at the first half of 2000 and at the end of 2001 years) we see in 23 solar cycle. Also we see here the local minimum in the middle of the 2001. The 23 solar activity cycle was the medium-sized cycle with respect to values of maximum amplitudes of main solar monthly average activity indexes variations [5,6].
It is probable that the two-maximum shape of 11-year cycling solar indices variations cased by quasi-biennial modulation of the 11-year time scale solar activity cycle. The quasi-biennial fluxes variation are widely spread phenomenon for star’s (not only for Sun) observations too. The periods of star’s fluxes variations on the quasi-biennial time scale vary from 2,2 to 3,5 years [7].
It has been shown that there exist the close connection between photospheric and coronal fluxes variations for solar-type stars of F, G, K and M spectral classes with active atmospheres [10].
1. Activity indices in 23 cycle
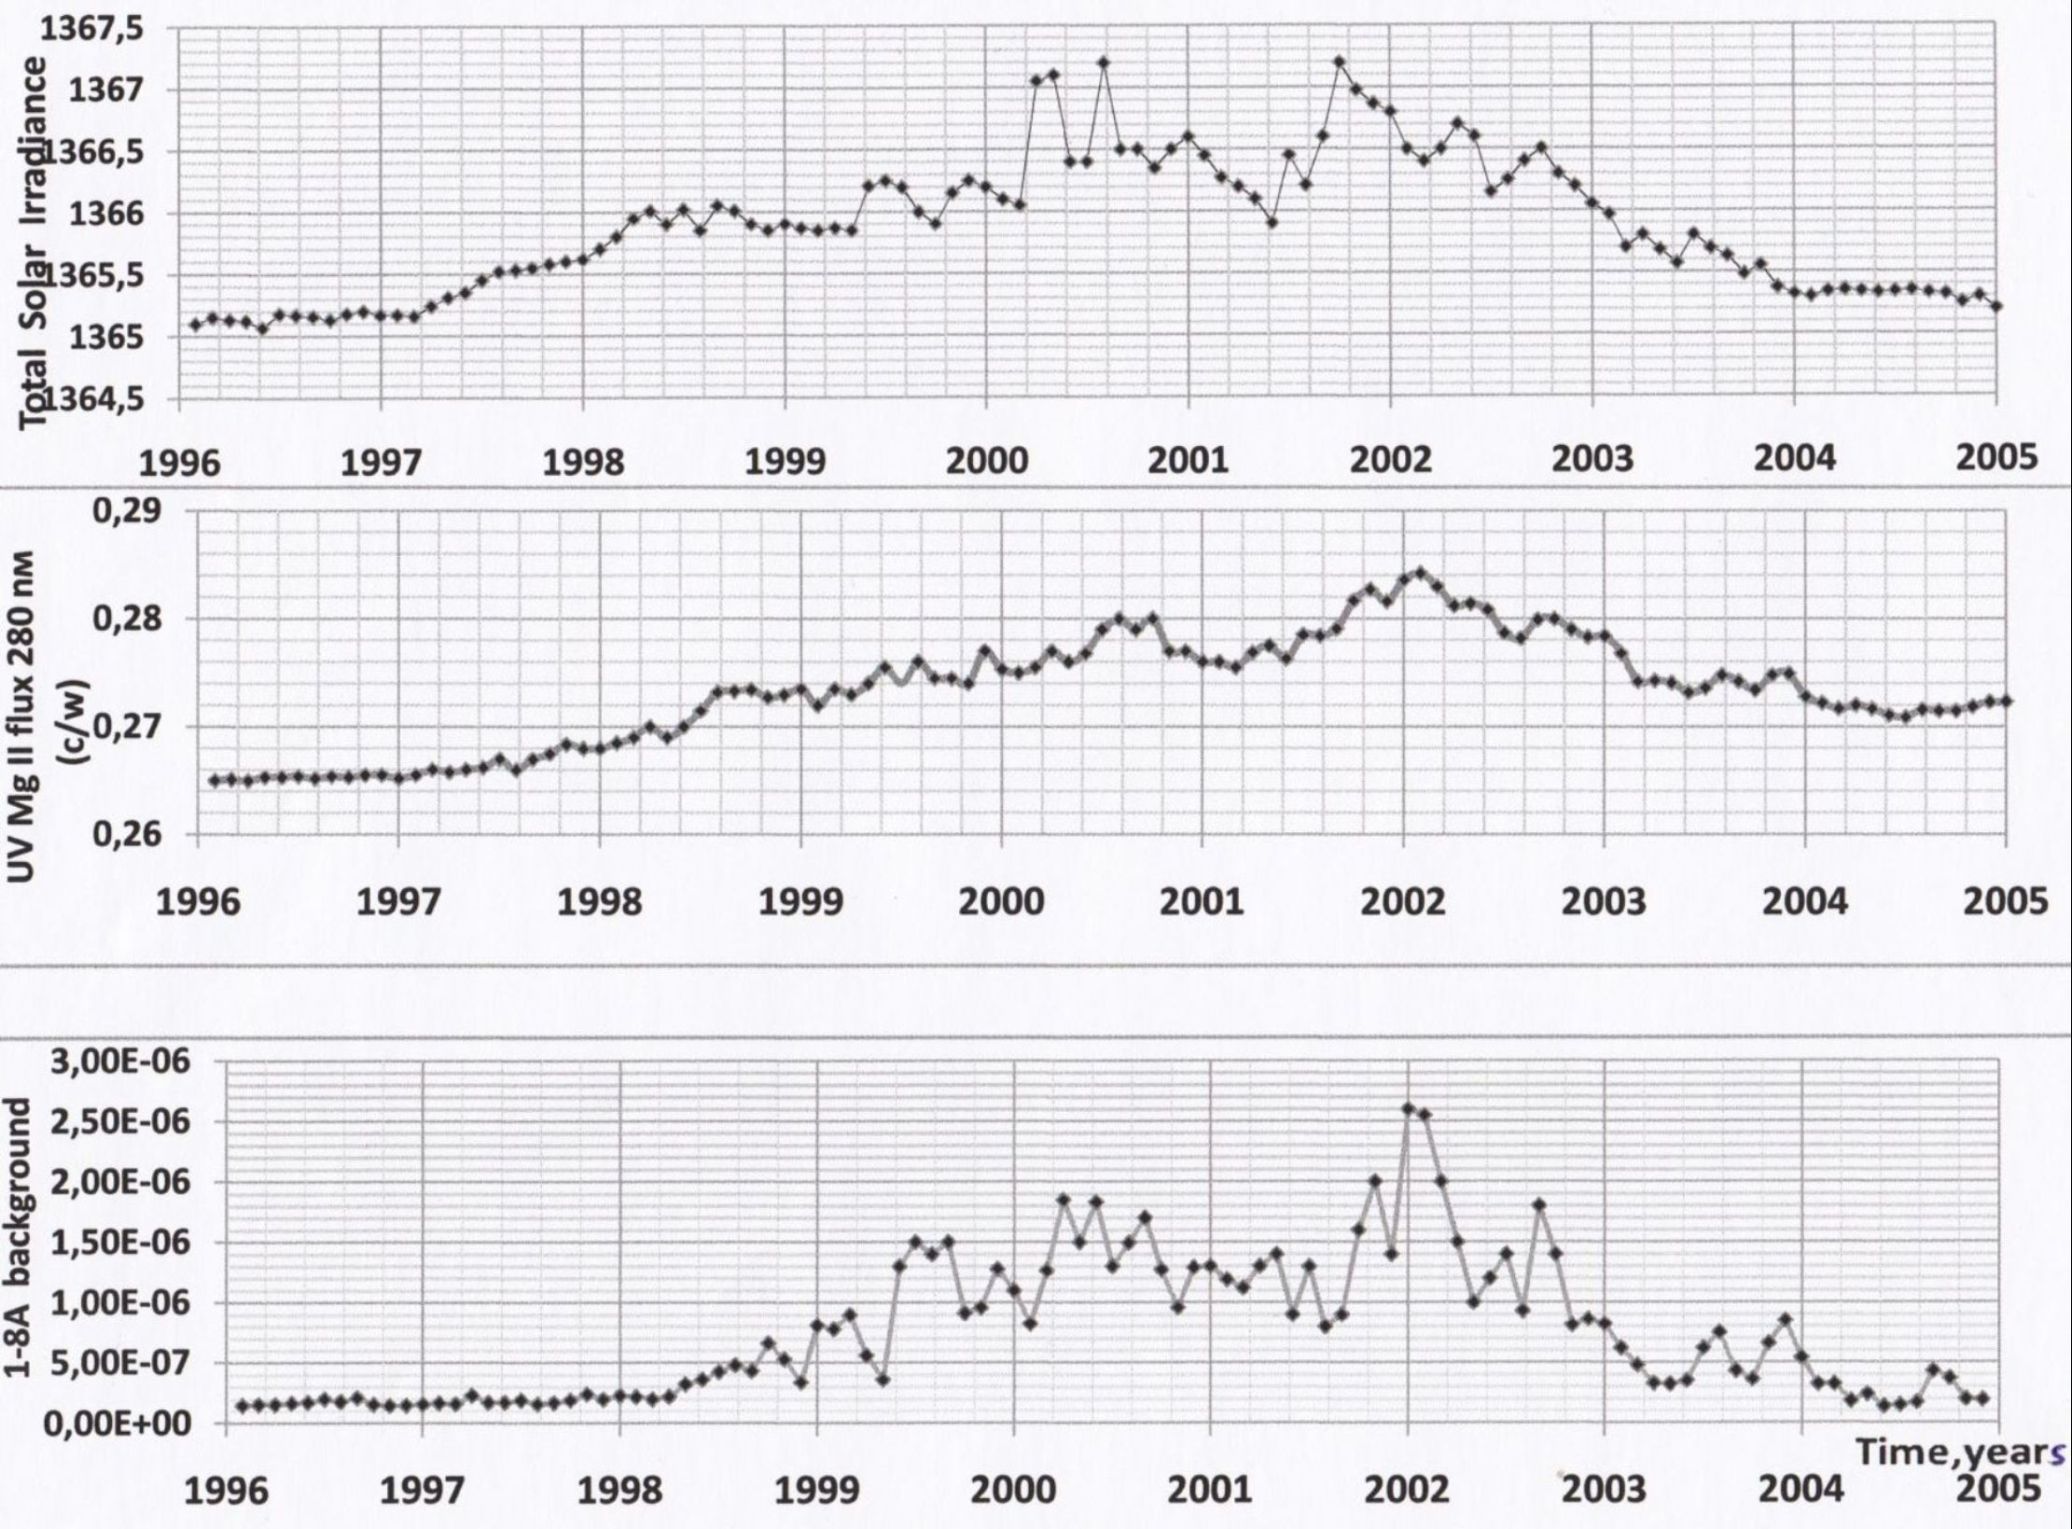
At Figure 2 we demonstrate monthly average values of the total solar irradiance, UV MgII 280 nm flux (c/w ratio) and 1-8A background in 23 solar activity cycle. We’ve made a comparison of maximum values occurrence time of these three indexes. We also see existence of two maximum shape of all activity indices in 23 cycle.
Table 1
| activity indices | 1 max time | 2 max time | variation amplitude | flux formation |
| Wolf numbers | Apr-May 2000 | Nov 2001 | from 1 to 175 | photosphere |
| Apr-May 2000 | Dec 2001 | from 70 to 240 | lower Corona | |
| MgII (280 nm c/w) | Jul-Sep 2000 | Jan 2002 | from 0,265 to 0,284 | chromosphere |
| Total Solar flux | Mar-July 2000 | Sep 2000 | from 1365 to 1367,3 | all atmosphere |
| 0,1-0,8 nm b/gr | Mar-Apr 2000 | Jan 2002 | - | corona |
Table 1 demonstrates 1-st and 2-nd time of maximum occurrence of W, , the total solar irradiance, UV MgII 280 nm flux (core to wing ratio) and 1-8A background in 23 solar activity cycle. A comparison of maximum values occurrence time of these five indexes shows that there are displacements in both maximum occurrence time.
Table 1 also demonstrates that these five indexes describe changes in physical conditions at all the levels of solar atmosphere for the different phases of 11-year activity cycle. It’s interesting to note that amplitudes of fluxes variations in activity cycle differ much for these indices. For total solar irradiance (generally characterized by the photosphere flux contribution) the maximum amplitude variations are some parts of percent. At the other hand the 0,1-0,8 nm background flux (characterized by the solar corona contribution) changed from cycle’s minimum to maximum more than a thousand times. Note than the Wolf numbers cycling variations don’t have the direct physical interpretation because of W values calculate only numbers of spots and spot groups. So the Wolf numbers are not the real solar fluxes from photosphere but anyway it’s the very important index of solar activity because of existence of long homogeneous series of Wolf numbers observations.
2. The connection between activity indices in 23 cycle
The most popular solar activity index correlates well with Wolf numbers (see Fig 1). We estimated here the linear connection between and other three indices: Mg II (280 nm), total solar irradiance and 0,1-0,8 nm background.
The study of the indices variations connection among themselves and particularly with indicates than there is a close linear relationships between these activity indices and . These relationships were confirmed by the high-correlation. Usually the correlation coefficients is more than 0,7. According to our calculations the highest values of correlation coefficient we see between W and but correlation coefficient between 0,1-0,8 nm background flux and is minimal of all correlations coefficients determined here.
Table 2
The correlation coefficients in 23 solar activity cycle
| activity indices | growth phase | decrease phase | cycle maximum | all the cycle |
|---|---|---|---|---|
| W - | 0.91951471 | 0.96151775 | 0.74290243 | 0.93983805 |
| Mg II- | 0.96305749 | 0.96482504 | 0.75747438 | 0.87903753 |
| Tot Sol Irr - | 0.87991344 | 0.94938041 | 0.7435922 | 0.92010067 |
| 0,1-0,8nm - | 0.8992561 | 0.81403471 | 0.7732229 | 0.81241226 |
When studied five activity indices in 23 solar activity cycle we separate out growth cycle phase (from Oct 1997 to Nov 1997), cycle maximum phase (from Nov 1997 to Jul 2002) and decrease cycle phase (from Jul 2002 to Jan 2006). Two maximum values of activity indices we can see at Figure 1 and Table 1. In [5] it has been noted that and total solar irradiance have the lowest values from 2007 to 2009 all over observation time.
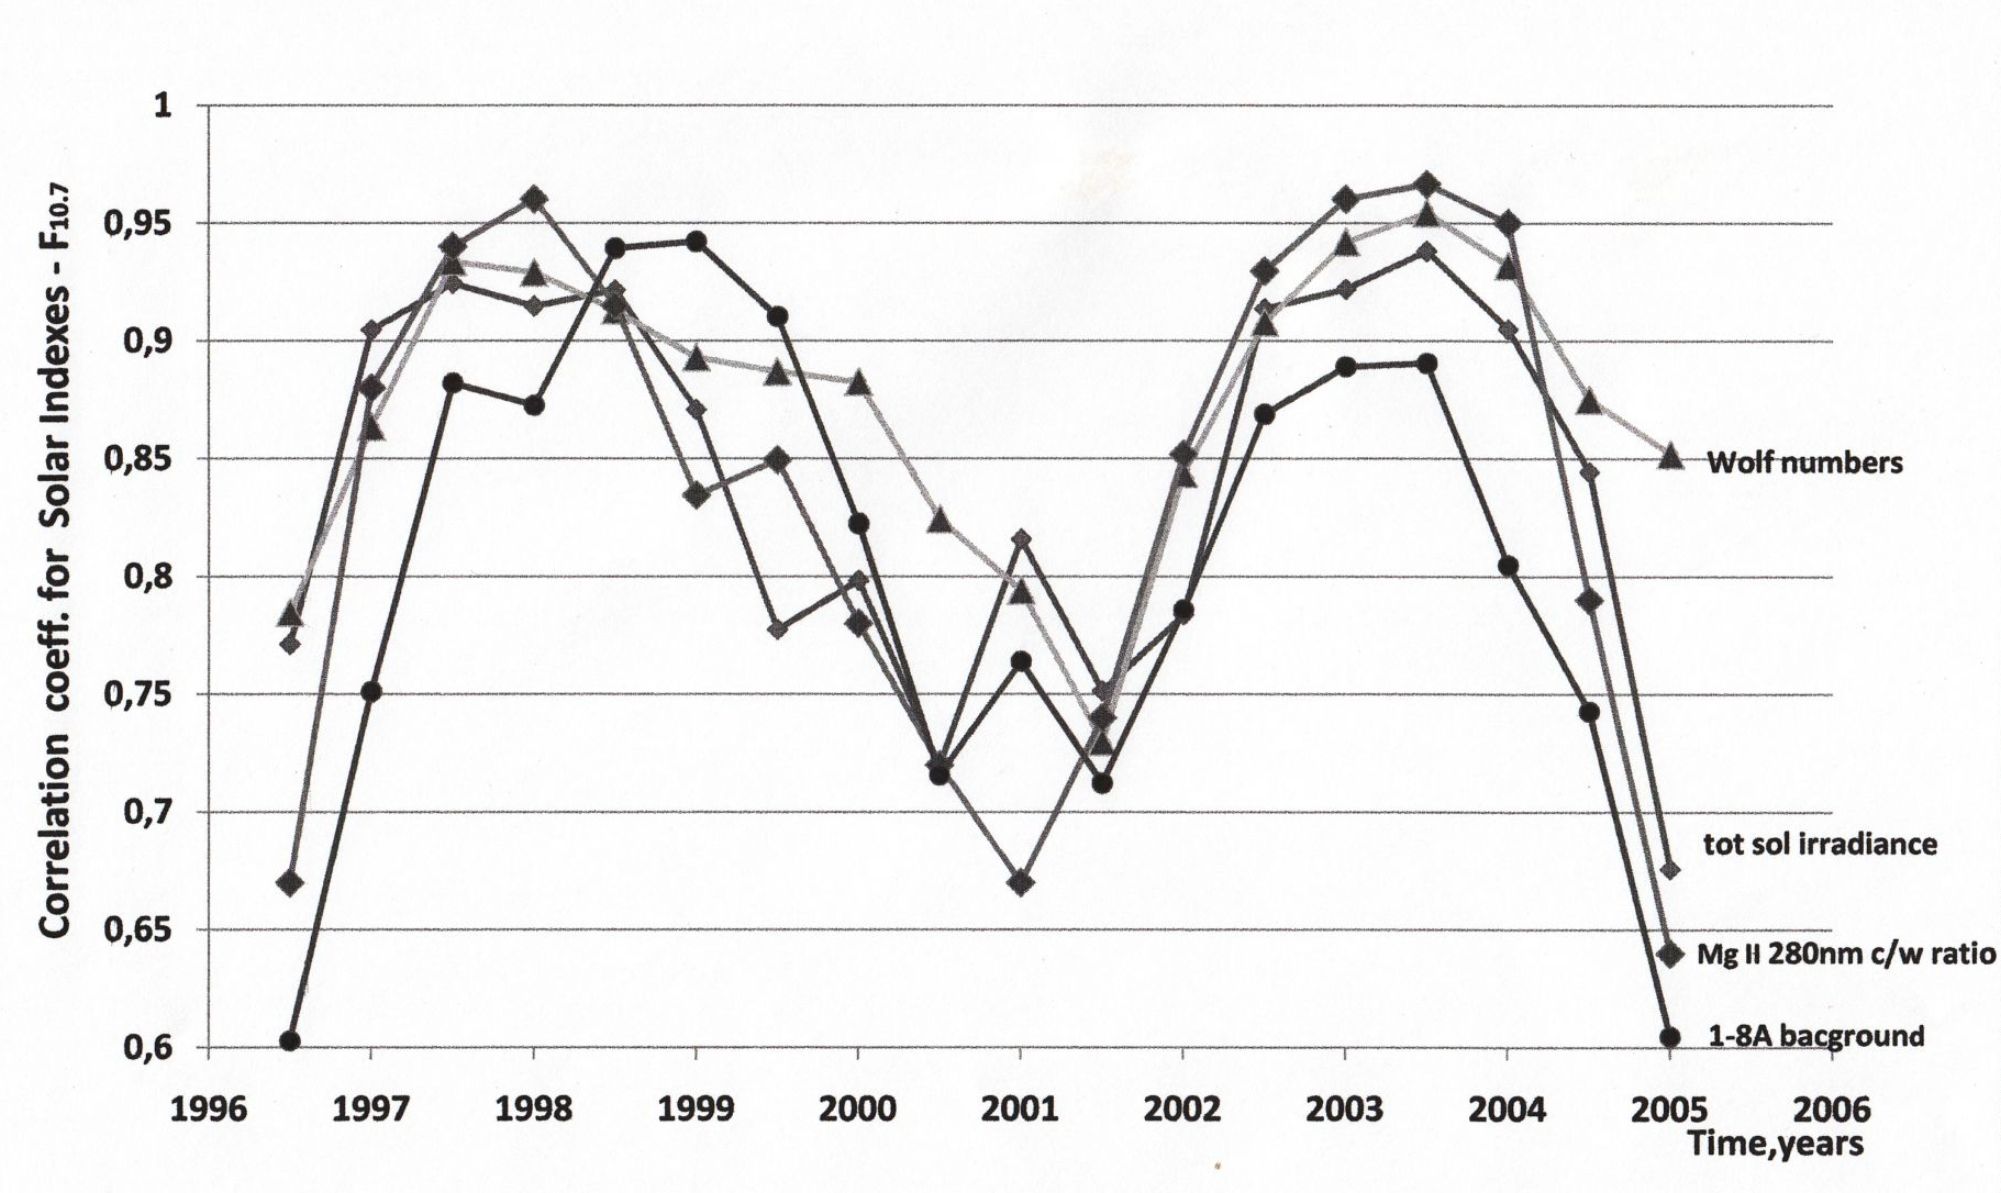
We’ve calculated yearly values of of linear dependence between 4 solar activity indices and for 23 solar activity cycles. Figure 3 demonstrates the yearly values of variations during 23 solar cycle. We see that all the values of linear dependence between 4 activity indices and have the maximum values at growth and at decrease cycle phases. Also we see that in 2001 for all the activity indices yearly values of has a minimum value.
3. The connection between W and in 21,22,23 solar activity cycles
As we note earlier Wolf numbers are very useful because of existence of long homogeneous observations series. The series of observations (data of Pentiction observatory in British Columbia) are homogeneous for the 21,21 and 23 solar activity cycles too. So we can study the linear dependence between W and in 21,22,23 solar activity cycles and calculated yearly values of this linear regression coefficients .
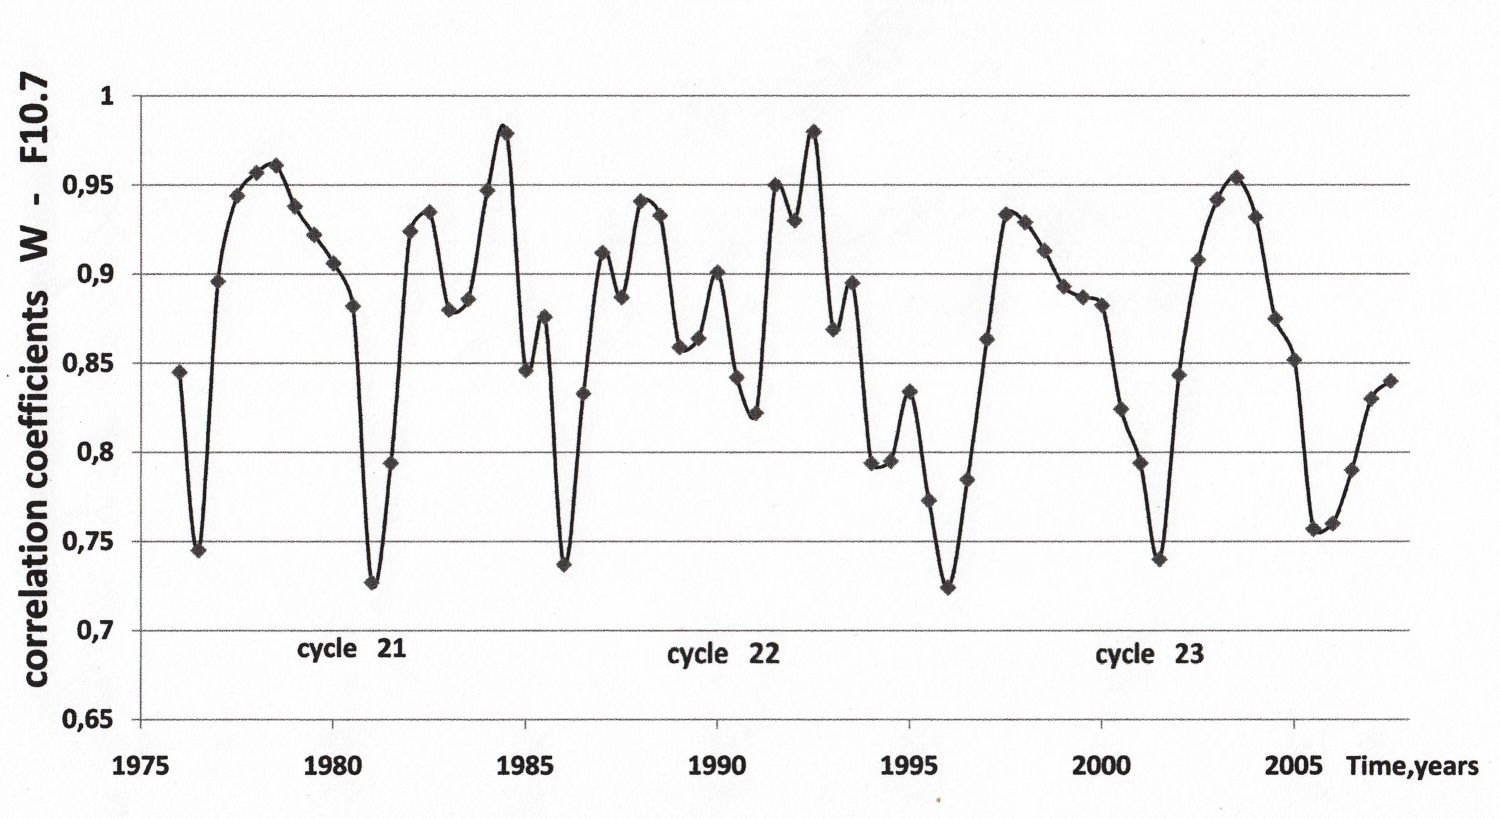
At Figure 4 we demonstrate yearly values of correlation coefficients of linear regression between W and in 21,22 and 23 solar activity cycles. We see the cyclic behavior yearly values of of linear regression between W and during 21,22 and 23 solar activity cycles. We can estimate the value of period of cyclic variations as 5,5 years approximately.
Conclusions
Close interconnection between solar activity indices is very important for prognoses of cyclic variations indices studied here and other important indices (for example 30,4 nm fluxes, that is very significant for determination of the Earth high thermosphere levels heating) [2,4].
We have found out the cyclic behavior of yearly values of correlation coefficients of linear regression between W and during 21,22 and 23 solar activity cycles (see Figure 4). We see that yearly values of have the maximum values at growth and decrease cycle’s phases so the linear connection between indices is more strong in these cases than at minimum and maximum cycle’s phases. It means that the prognoses of solar indices, based on observations, will be more successful at growth and decrease cycle’s phases.
The yearly values of cyclic variations are characterized by cyclic variations with the period T that is equal to half path of 11-year period (5,5 years about). Our study of linear regression between W and confirms the fact that at minimum and at maximum cycle’s phases the nonlinear state of interconnection between solar activity indices (characterized the different levels of solar atmosphere) increases.
Acknowledgements. The authors thank the RFBR grant 09-02-01010 for support of the work.
REFERENCES
1. L. Svalgaard, H. S. Hudson, Publication: SOHO-23: Understanding a Peculiar Solar Minimum ASP Conference Series Vol. 428, proceedings of a workshop held 21-25 September 2009 in Northeast Harbor, Maine, USA. Edited by Steven R. Cranmer, J. Todd Hoeksema, and John L. Kohl. San Francisco: Astronomical Society of the Pacific, P. 325 (2010).
2. J. Skupin, M. Weber, H. Bovensmann, and J.P. Burrows, Proc. of the 2004 Envisat and ERS Symposium (ESA SP-572), 6-10 September 2004, Salzburg, Austria. Edited by H. Lacoste (2005).
3. R.A. Viereck, L.C. Puga, D. McMullin, D. Judge, M. Weber, and W. Tobiska, Geophys. Res. Lett,28, P. 1343 (2001).
4. E.A. Bruevich, A.A. Nusinov, Geomagnetizm i Aeronomiia, 24, P. 581, In Russian, (1984).
5. V.N. Ishkov, Proc. symposium working meeting The activity cycles on the Sun and stars, Moscow, 18-10 December, Edited by EAAO, St-Petersburg, P. 57, In Russian, (2009).
6. R.U. Lukyanov, K. Mursula, Proc. symposium working meeting The activity cycles on the Sun and stars, Moscow, 18-10 December, Edited by EAAO, St-Petersburg, P. 153, In Russian, (2009).
7. E.A. Bruevich, E.V. Kononovich, Vestn. Mosk. Univ. Fiz. Astron., No. 1, P. 70 (2011) [Moscow University Physics Bulletin, 66, No. 1, P. 72 (2011)], arXiv:1102.3976v1 (2011).
8. S.L.Baliunas, R.A.Donahue, W.H.Soon, Astrophys.J. 438, P. 269 (1995).
9.E.A. Bruevich, M.M. Katsova, and D.D. Sokolov, Astron. zh. 78, P. 827 (2001).
10. E.A. Bruevich, I.Yu. Alekseev, Astrophysics, 50, No. 2, P. 187 (2007), arXiv:1012.5527v1 (2010).