The Type IIP SN 2007od in UGC 12846: from a bright maximum to dust formation in the nebular phase††thanks: Based on observations collected at the Italian 3.58m Telescopio Nazionale Galileo, the Liverpool Telescope and the North Optical Telescope (La Palma, Spain), the Calar Alto Observatory (Sierra de los Filabres, Spain), the orbital Telescope SWIFT and at the Italian Rapid Eye Movement Telescope (La Silla, Chile) and the Copernico and Galileo Galilei telescopes (Asiago, Italy).
Abstract
Ultraviolet (UV), optical, and near infrared (NIR) observations of the Type IIP supernova (SN) 2007od, covering from maximum light to late phases, allow detailed investigation of different physical phenomena in the expanding ejecta. These data turn this object into one of the most peculiar SNe IIP ever studied. The early light curve of SN 2007od is similar to that of a bright IIP, with a short plateau, a bright peak (M18 mag), but a very faint late–time optical light curve. However, with the inclusion of mid infrared (MIR) observations during the radioactive tail, we derive an ejected mass of 56Ni of M(56Ni) M⊙. By modeling the bolometric light curve, ejecta expansion velocities, and blackbody temperature, we estimate a total ejected mass of 5 – 7.5 M⊙ with a kinetic energy of at least 0.5 1051 erg. The early spectra reveal a boxy H profile and high velocity features of the Balmer series that suggest the possible interaction of the ejecta with a close circumstellar matter (CSM). The interaction with the CSM and the presence of dust formed inside the ejecta are evident in the late-time spectra. The episodes of mass loss shortly before explosion, the bright plateau, the relatively small amount of 56Ni, and the faint [O I] emission observed in the nebular spectra are consistent with a super-asymptotic giant branch (super-AGB) progenitor (M9.7 - 11 M⊙).
keywords:
supernovae: general – supernovae: individual: SN 2007od –galaxies: individual: UGC 12846 – supernovae: circumstellar matter1 Introduction
Type II supernovae (SNe II) are produced in explosions following the gravitational collapse of the cores of massive (ZAMS mass M⊙) stars that retain part of their H envelopes. SNe II of the subtype called ”plateau” (SNe IIP) show constant luminosity lasting from 30 days to 3-4 months. Other SNII, presenting a steep linear decline over the same period, are named ”linear” (SNe IIL, Barbon, Ciatti, & Rosino, 1979). SNe IIP were the subject of extensive analysis by Hamuy (2003) who pointed out a continuum in their properties and revealed several relations between physical parameters. An independent analysis, extending the sample to both low and high luminosities, was performed by Pastorello (2003) who confirmed the above results. These studies show that most sit in the region of M M⊙, regardless of the mass of radioactive 56Ni, and only for relatively large 56Ni masses ( M⊙) Mej increases with MNi. This suggests a possible bi-modal distribution of Mej versus other observables. Thanks to the direct identification of a few SN precursors in deep pre-explosion images, recent studies indicate that most SNe IIP originate from the explosion of stars with M 15 M⊙(Smartt et al., 2009).
Although SNe IIP are possibly the best studied core collapse explosions, there are several issues that remain unclear, e.g. the nucleosynthesis yields, the nature and rate of the mass loss in the latest stages of evolution of the precursor (this can affect the optical and radio display once the wind material is overcome by the ejecta, see Moriya et al. (2010) and Smith et al. (2011)), the influence of the metallicity on the progenitor evolution (see Kasen & Woosley, 2009) and the location and amount of dust formation and its impact on the observables (see Maguire et al., 2010).
SN 2007od is an ideal test case to address such issues. It was discovered on 2007 November 2.85 UT in the nearby galaxy UGC 12846 (Mikuz & Maticic, 2007). Blondin & Calkins (2007) classified it as a normal SN IIP about two weeks after explosion, and reported some similarity with the spectrum of type II SN 1999em 10 days after explosion. On November 6, the SN was detected by Swift with UVOT, although not with XRT (3 upper limit 1.410-13 erg cm-2 s-1, Immler & Brown, 2007).
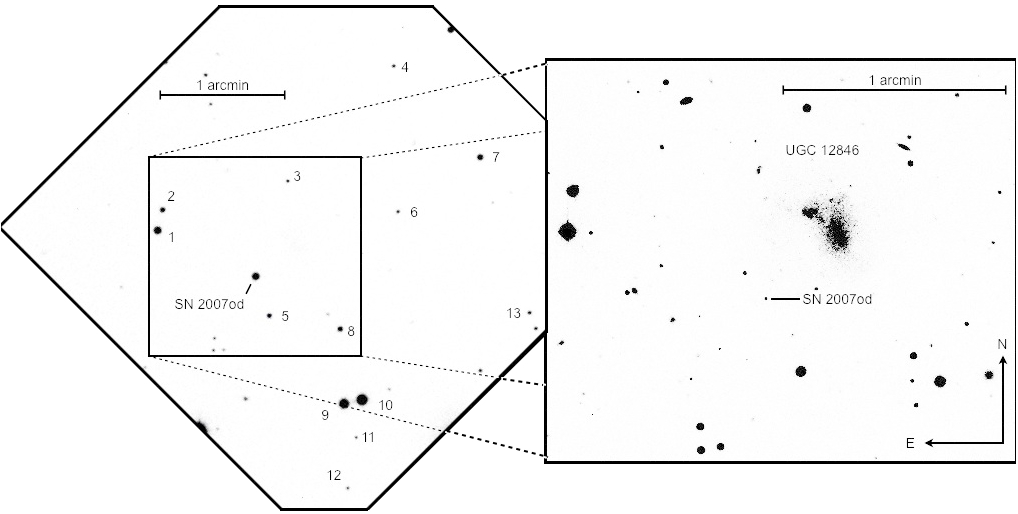
The coordinates of SN 2007od have been measured on our astrometrically calibrated images at two different epochs: = 23h55m48s.68 0.1s and = +18o24’54”.8 0.1” (J2000). The SN is located in a peripheral region of UGC 12846, 38” East and 31” South of the core of the galaxy (Fig. 1). This position, slightly revised with respect to previous determinations (Mikuz & Maticic, 2007), corresponds to a linear distance of 6 kpc from the nucleus (assuming a distance to UGC 12846 of 26 Mpc; cfr. Sec. 2.5). A prior work based on late-time observations of SN 2007od has been done by Andrews et al. (2010).
In this paper we present optical and near-infrared observations of SN 2007od spanning from November 2007 to September 2008. In Sect. 2 we describe photometric observations and reduction, we estimate the interstellar reddening toward the SN site, and describe the photometric evolution. In Sect. 3 we analyze the spectroscopic data. In Sect 4 we provide evidence for dust formation in SN 2007od. Discussion and conclusions follow in Sect. 5 and 6, respectively.
2 Photometry
The optical and NIR photometric follow up of SN 2007od began on November 6, 2007, four days after the discovery, and lasted until late February 2008. Observations were resumed in June 2008 after the seasonal gap.
2.1 Optical ground-based data
Optical (UBVRI) photometry was obtained using a number of ground-based telescopes (Tab. 1). Note that the -band filter used at the 2.56-m Nordic Optical Telescope (NOT) on January 13, 2008 is an interference filter with central wavelength (7970Å), slightly different from the classical Gunn or Cousins I and more similar to Sloan . In our analysis, however, it was calibrated as Cousins I.
Optical data were reduced following standard prescriptions in IRAF111Image Reduction and Analysis Facility, distributed by the National Optical Astronomy Observatories, which are operated by the Association of Universities for Research in Astronomy, Inc, under contract to the National Science Foundation. environment. Instrumental magnitudes were measured on the images obtained after removal of the detector signature (overscan, bias and flat field corrections, and trimming).
Photometric zero-points and colour terms were computed for all nights through observations of Landolt standard fields (Landolt, 1992). Eleven out of twenty-eight nights turned out to be photometric. Using these nights we calibrated the average magnitudes of the local sequence stars shown in Fig. 1. Magnitudes are reported in Tab. 2 along with their r.m.s. (in brackets). For stars in common with Andrews et al. (2010), the magnitudes differ on average by B , V , R , I . These differences are probably related to the uncertainties in the transformation to the Johnson-Cousins system adopted in Andrews et al. (2010). Eventually, the local sequence stars were used to calibrate the photometric zero-points obtained in the non-photometric nights.
Calibrated optical magnitudes of the SN are reported in Tab. 3 along with early magnitudes from Mikuz & Maticic (2007). There is no evidence of the SN in images obtained on September 17, 2008 and the values reported are the limiting magnitudes computed by placing artificial stars near the position of the SN.
| Telescope | Primary mirror | Camera | Array | CCD | pixel scale | field of view | filters |
|---|---|---|---|---|---|---|---|
| m | arcsec/pix | arcmin | |||||
| Copernico | 1.82 | AFOSC | 1024 x 1024 | TK1024AB | 0.46 | 8.1 | Bessell B V R, Gunn i |
| TNG | 3.58 | DOLORES∗ | 2048 x 2048 | EEV 42-40 | 0.25 | 8.6 | Johnson U B V, Cousins R I |
| NICS | 1024 x 1024 | HgCdTe Hawaii | 0.25 | 4.2 | J H K | ||
| REM | 0.60 | ROSS | 1024 x 1024 | Apogee Alta | 0.575 | 10 | Johnson V, Cousins R I |
| REMIR | 512 x 512 | Hawaii I | 1.2 | 10 | J H K | ||
| LT | 2.0 | RATcam | 2048 x 2048 | EEV 42-40 | 0.13 | 4.6 | Sloan u, Bessell B V |
| NOT | 2.5 | ALFOSC | 2048 x 2048 | EEV 42-40 | 0.19 | 6.4 | Johnson U B V R, interference i |
| CAHA | 2.2 | CAFOS | 2048 x 2048 | SITe | 0.53 | 16 | Johnson B V R I |
| SWIFT | 0.3 | UVOT | 2048 x 2048 | microchannel | 0.48 | 17 | uvw2,uvm2,uvw1,u,b,v |
| intensified CCD |
Copernico = Copernico Telescope (Mt. Ekar, Asiago, Italy); TNG = Telescopio Nazionale Galileo (La Palma, Spain); REM = Rapid Eye Mount Telescope (La Silla, Chile); LT = Liverpool Telescope (La Palma, Spain); NOT = Nordic Optical Telescope (La Palma, Spain); CAHA = Calar Alto Observatory (Sierra de los Filabres, Andalucia, Spain); SWIFT by NASA.
∗ Observations from 1st November to 31st December 2007 were performed with an engineering CCD with the same general characteristics.
SN magnitudes were measured by means of the point spread function (PSF) fitting technique. The adoption of the PSF technique is justified by the occurrence of the SN in the outskirts of the parent galaxy, in a region with a smooth background. The uncertainties reported in Tab. 3 were estimated by combining in quadrature the errors of the photometric calibration and the errors of the PSF fitting through artificial stars.
Optical observations with the 0.6-m Rapid Eye Mount (REM) telescope plus ROSS were affected by random deformations of the PSF. For this reason the SN magnitudes were always determined with aperture photometry with respect to a few local sequence stars close to SN. REM observations at airmasses were rejected, because the star shapes on the frames were elliptical and neither this approach nor PSF fitting produced consistent measurements.
| ID | U | B | V | R | I |
|---|---|---|---|---|---|
| 1 | 15.254 (.025) | 15.206 (.026) | 14.436 (.020) | 13.994 (.019) | 13.697 (.017) |
| 2 | 17.933 (.008) | 17.035 (.011) | 15.947 (.021) | 15.335 (.017) | 14.859 (.021) |
| 3 | 18.831 (.018) | 18.238 (.010) | 17.264 (.026) | 16.798 (.033) | 16.291 (.023) |
| 4 | 17.833 ( - ) | 17.002 (.034) | 16.542 (.044) | 15.942 (.014) | |
| 5 | 18.576 (.041) | 17.540 (.022) | 16.426 (.018) | 15.764 (.021) | 15.228 (.022) |
| 6 | 18.338 (.046) | 18.264 (.029) | 17.102 (.025) | 16.803 (.021) | 16.295 (.027) |
| 7 | 15.612 ( - ) | 15.770 (.055) | 15.106 (.023) | 14.819 (.029) | 14.373 (.020) |
| 8 | 18.351 (.009) | 17.324 (.018) | 16.122 (.024) | 15.438 (.020) | 14.760 (.021) |
| 9 | 15.501 (.020) | 14.583 (.003) | 13.452 (.020) | 12.834 (.017) | 12.192 (.016) |
| 10 | 14.584 (.027) | 13.845 (.006) | 12.858 (.017) | 12.304 (.019) | 11.743 (.018) |
| 11 | 18.522 (.011) | 18.271 (.031) | 17.463 (.026) | 17.090 (.029) | 16.608 (.014) |
| 12 | 17.748 ( - ) | 17.955 (.030) | 17.309 (.042) | 17.058 (.031) | 16.644 (.022) |
| 13 | 17.926 ( - ) | 16.777 (.040) | 16.079 (.013) | 16.005 (.002) |
| Date | JD | U | B | V | R | I | Inst. |
|---|---|---|---|---|---|---|---|
| dd/mm/yy | (+2400000) | ||||||
| 02/11/07 | 54407.35 | 14.4 ( - ) | 7 | ||||
| 03/11/07 | 54408.30 | 14.5 ( - ) | 13.9 ( - ) | 7 | |||
| 06/11/07 | 54411.57 | 14.144 (.025) | 13.945 (.022) | 13.821 (.024) | 2 | ||
| 08/11/07 | 54413.21 | 14.464 (.028) | 14.263 (.026) | 13.991 (.021) | 13.873 (.023) | 1 | |
| 09/11/07 | 54413.62 | 14.350 (.027) | 14.095 (.025) | 13.893 (.028) | 2 | ||
| 12/11/07 | 54416.64 | 14.392 (.032) | 14.148 (.028) | 13.846 (.024) | 2 | ||
| 12/11/07 | 54417.42 | 14.655 (.029) | 14.329 (.025) | 14.084 (.021) | 14.009 (.022) | 1 | |
| 16/11/07 | 54421.43 | 14.353 (.033) | 14.902 (.027) | 14.486 (.031) | 14.069 (.028) | 13.913 (.023) | 3 |
| 16/11/07 | 54421.54 | 14.415 (.027) | 14.107 (.025) | 13.606 (.024) | 2 | ||
| 21/11/07 | 54425.53 | 14.474 (.050) | 14.132 (.042) | 13.886 (.031) | 2 | ||
| 24/11/07 | 54428.58 | 14.535 (.046) | 14.135 (.050) | 13.930 (.055) | 2 | ||
| 27/11/07 | 54432.54 | 14.558 (.028) | 14.186 (.027) | 13.971 (.025) | 2 | ||
| 01/12/07 | 54435.56 | 14.533 (.028) | 14.194 (.026) | 13.960 (.025) | 2 | ||
| 05/12/07 | 54439.34 | 15.503 (.034) | 14.707 (.025) | 14.198 (.023) | 13.980 (.022) | 1 | |
| 06/12/07 | 54441.35 | 15.868 (.036) | 15.570 (.030) | 14.780 (.025) | 4 | ||
| 07/12/07 | 54441.55 | 14.709 (.034) | 14.249 (.029) | 13.967 (.025) | 2 | ||
| 11/12/07 | 54445.55 | 14.764 (.034) | 14.288 (.028) | 14.108 (.025) | 2 | ||
| 15/12/07 | 54450.34 | 16.308 (.038) | 15.784 (.028) | 14.803 (.025) | 4 | ||
| 15/12/07 | 54450.45 | 16.198 (.038) | 15.805 (.026) | 14.756 (.025) | 14.367 (.021) | 14.228 (.025) | 3 |
| 21/12/07 | 54455.55 | 14.870 (.085) | 14.452 (.021) | 14.440 (.029) | 2 | ||
| 25/12/07 | 54459.53 | 14.975 (.127) | 14.522 (.028) | 14.217 (.029) | 2 | ||
| 25/12/07 | 54460.33 | 16.833 (.038) | 16.022 (.028) | 15.006 (.028) | 4 | ||
| 28/12/07 | 54462.20 | 16.228 (.028) | 15.096 (.027) | 14.574 (.023) | 14.366 (.022) | 1 | |
| 29/12/07 | 54463.53 | 15.023 (.062) | 14.454 (.028) | 14.234 (.024) | 2 | ||
| 13/01/08 | 54479.36 | 17.509 (.044) | 16.622 (.027) | 15.350 (.025) | 14.688 (.022) | 14.589 (.021) | 6 |
| 28/01/08 | 54494.26 | 17.184 (.029) | 15.724 (.028) | 14.871 (.023) | 15.011 (.023) | 1 | |
| 17/02/08 | 54514.25 | 16.926 (.032) | 16.197 (.025) | 15.983 (.028) | 1 | ||
| 05/07/08 | 54653.62 | 22.392 (.197) | 21.714 (.164) | 20.748 (.058) | 20.882 (.264) | 5 | |
| 16/07/08 | 54664.62 | 21.987 (.101) | 21.057 (.064) | 5 | |||
| 04/09/08 | 54714.59 | 22.330 (.057) | 21.564 (.028) | 21.314 (.032) | 3 | ||
| 17/09/08 | 54727.42 | 22.0 | 21.2 | 21.2 | 5 |
1 = Copernico, 2 = REM, 3 = TNG, 4 = LT, 5 = CAHA, 6 = NOT, 7 = CBET 1116. Telescope abbreviations are the same as in Tab. 1. Unfiltered photometry from CBET 1116 is considered most similar to the R-band Johnson-Bessell system.
2.2 Near Infrared data
Near-infrared (NIR) photometry (JHK) was obtained with NICS mounted at the 3.5-m Telescopio Nazionale Galileo (TNG) and with REMIR at REM (cfr. Tab. 1). The reduction of NIR images included the subtraction of sky images obtained by combining several dithered exposures. Then NIR images of the SN field for each band were obtained by combining several sky-subtracted, dithered exposures. Photometric calibration was achieved relative to 2MASS photometry of the same local sequence stars used for the calibration of the optical photometry. The NIR magnitudes of SN 2007od are listed in Tab. 4. The values reported for the K band of NICS were obtained with the K’ filter, instead.
| Date | JD | J | H | K | Inst. |
|---|---|---|---|---|---|
| dd/mm/yy | (+2400000) | ||||
| 06/11/07 | 54410.57 | 13.712 (.045) | 13.602 (.070) | 2 | |
| 09/11/07 | 54413.62 | 13.628 (.044) | 13.804 (.089) | 2 | |
| 12/11/07 | 54416.64 | 13.748 (.036) | 13.625 (.048) | 2 | |
| 16/11/07 | 54421.54 | 13.725 (.046) | 13.649 (.041) | 13.592 (.122) | 2 |
| 21/11/07 | 54425.53 | 13.820 (.024) | 13.641 (.023) | 13.697 (.083) | 2 |
| 24/11/07 | 54428.58 | 13.642 (.041) | 13.612 (.062) | 2 | |
| 27/11/07 | 54432.54 | 13.792 (.019) | 13.641 (.025) | 13.653 (.048) | 2 |
| 01/12/07 | 54435.56 | 13.841 (.018) | 13.571 (.046) | 13.559 (.054) | 2 |
| 07/12/07 | 54441.55 | 13.798 (.042) | 2 | ||
| 11/12/07 | 54445.55 | 13.851 (.029) | 13.628 (.021) | 13.598 (.069) | 2 |
| 21/12/07 | 54455.55 | 13.836 (.035) | 13.613 (.031) | 13.584 (.062) | 2 |
| 25/12/07 | 54459.53 | 13.789 (.045) | 13.694 (.044) | 13.942 (.130) | 2 |
| 29/12/07 | 54463.53 | 13.941 (.019) | 13.765 (.039) | 13.773 (.067) | 2 |
| 12/01/08 | 54478.31 | 14.333 (.037) | 14.233 (.039) | 13.901 (.029) | 3 |
| 11/06/08 | 54629.73 | 19.612 (.029) | 19.300 (.047) | 3 |
2 = REM, 3 = TNG (K’ filter). The abbreviations and the numbers are the same as in Tab. 1.
2.3 SWIFT data
For SN 2007od a number of optical and ultraviolet observations, obtained by UVOT on board the SWIFT satellite, are available. UVOT data were obtained in uvw2, uvm2, uvw1, u, b, v filters (Poole et al., 2008) with spatial resolution of about (FWHM).
Twelve epochs of observations, spread over a period of about 60 days, are available along with two late time observations at about 300 days when the SN was below the detection threshold. We reduced these data using HEASARC222NASA’s High Energy Astrophysics Science Archive Research Center software. All images for each epoch were first co-added, then reduced following the guidelines of Poole et al. (2008). Aperture magnitudes were transformed from the Swift system to Johnson magnitudes through the colour transformations of Li et al. (2006). By comparing the space and the ground-based SN magnitudes at corresponding epochs we found an average difference (ground–space) , , . These corrections have been applied to all UVOT magnitudes and the resulting magnitude values are reported in Tab. 5.
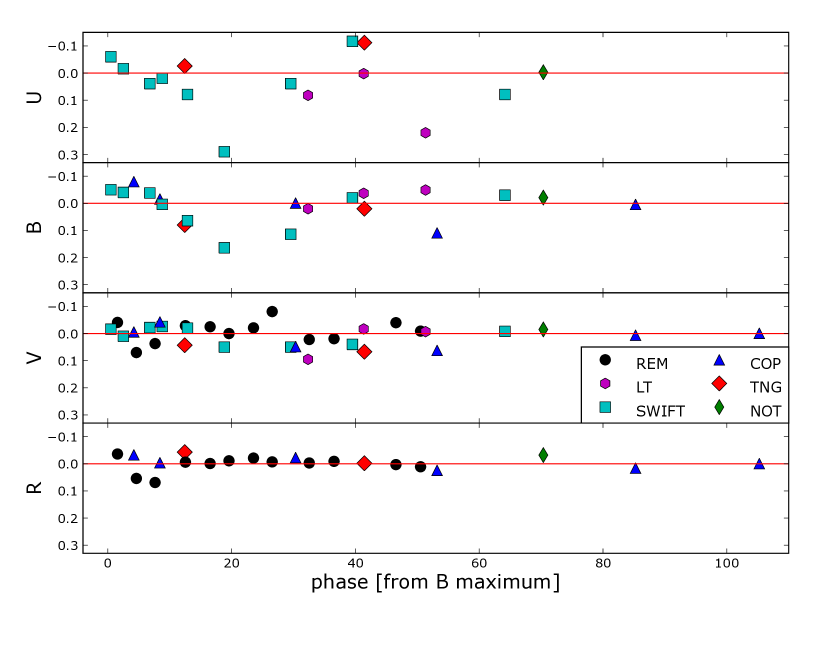
To check for possible biases due to the peculiar pass bands of UVOT (and other instruments), in Fig 3 we show the residuals with respect to a low order polynomial fit of all the available values. The agreement of the ground-based data is overall good with few measurements deviating by more than 0.05 mag. SWIFT data deviate more. The largest differences are for the U band in which the specific detector responses and the variable transmission at atmospheric cut-off can generate quite different passbands.
| Date | JD | uvw2 | uvm2 | uvw1 | U | B | V |
|---|---|---|---|---|---|---|---|
| dd/mm/yy | (+2400000) | ||||||
| 04/11/07 | 54409.50 | 14.68 (.05) | 14.52 (.06) | 14.15 (.06) | 13.49 (.04) | 14.34 (.06) | 14.19 (.04) |
| 07/11/07 | 54411.52 | 14.90 (.05) | 14.74 (.06) | 14.36 (.05) | 13.66 (.05) | 14.41 (.05) | 14.22 (.04) |
| 09/11/07 | 54413.78 | 15.32 (.06) | 15.20 (.06) | ||||
| 11/11/07 | 54415.79 | 15.70 (.05) | 15.54 (.06) | 15.03 (.06) | 14.11 (.05) | 14.60 (.05) | 14.35 (.04) |
| 13/11/07 | 54417.80 | 16.13 (.06) | 16.00 (.06) | 15.37 (.06) | 14.30 (.05) | 14.68 (.05) | 14.36 (.04) |
| 17/11/07 | 54421.88 | 15.97 (.03) | 16.74 (.07) | 15.97 (.07) | 14.90 (05) | 14.90 (.05) | 14.41 (.04) |
| 23/11/07 | 54427.83 | 17.63 (.07) | 17.63 (.08) | 16.69 (.07) | 15.40 (.05) | 15.24 (.05) | 14.59 (.04) |
| 04/12/07 | 54438.55 | 18.31 (.08) | 18.25 (.11) | 17.28 (.08) | 15.78 (.05) | 15.56 (.05) | 14.71 (.04) |
| 14/12/07 | 54448.52 | 18.76 (.11) | 18.92 (.13) | 17.69 (.08) | 16.20 (.06) | 15.74 (.05) | 14.84 (04) |
| 07/01/08 | 54473.16 | 19.58 (.13) | 19.69 (.22) | 18.33 (.10) | 17.33 (.07) | 16.38 (.05) | 15.25 (.04) |
| 04/08/08 | 54683.02 | 20.9 | 20.9 | 21.2 | 20.2 | ||
| 23/08/08 | 54701.96 | 20.4 | 19.6 | 21.3 | 21.0 | 21.0 | 20.2 |
2.4 Photometric evolution
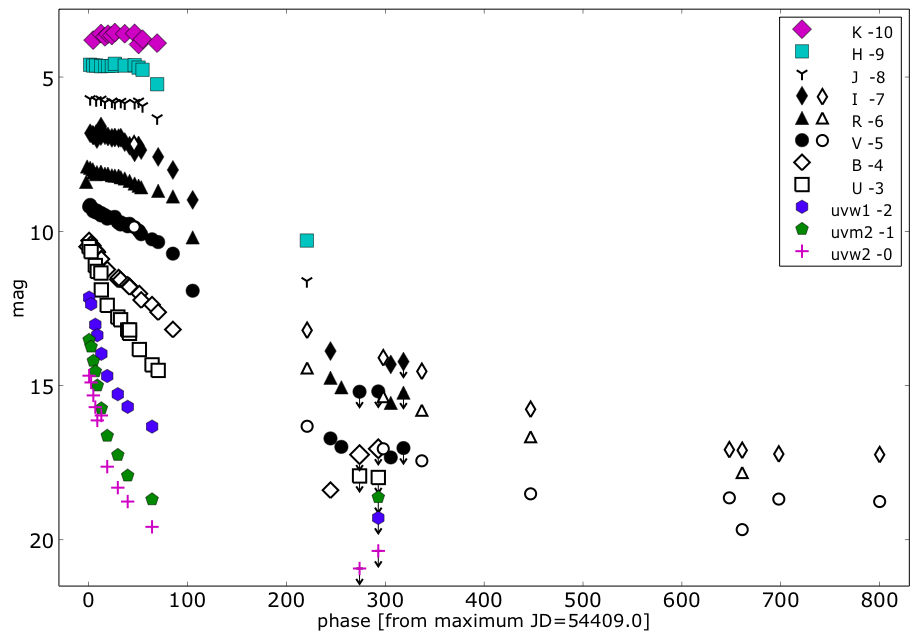
uvw2, uvm2, uvw1, U, B, V, R, I, J, H, and K light curves of SN 2007od are plotted in Fig. 2. This figure includes also photometric data from Andrews et al. (2010). As stressed by these authors, the F606W and the Gemini filters (transformed respectively to the V and R) include the H line, and care should be used when comparing these data with standard photometry of other SNe. Both in the photospheric and in the nebular phases the data of Andrews et al. (2010) are in good agreement with our data (cfr. Sect. 2.1).
The R-band light curve shows a fast rise to the peak, estimated to occur around JD 2454409.02.0. In fact, early unfiltered observations from Mikuz & Maticic (2007) showed that the SN was still rising to the R-band maximum at discovery (Nov 2.85 UT). This is also consistent with the phases derived for the first spectra of SN 2007od through a cross-correlation with a library of supernova spectra performed with the ”GELATO” code (Harutyunyan et al., 2008). Therefore, hereafter we will adopt JD 24544045 (October 30.5 UT) as an estimate for the epoch of shock breakout.
In Fig. 2 and Fig. 4 an early (short) post-peak decline is visible mainly in the BVR bands, while the U band shows a monotonic decline. A short, flat plateau is visible at longer wavelengths with (; cfr. Sec. 2.5) between about day 15 and day 45. The plateau of SN 2007od is, therefore, relatively luminous when compared with that of more typical SNe IIP (Patat et al., 1994; Richardson et al., 2002) and similar to those of SNe 1992H (Clocchiatti et al., 1996) and 2004et (Maguire et al., 2010; Kotak et al., 2009).
The SN was recovered about 240 days after maximum light. Unfortunately, our observations do not cover the plateau-tail transition which would allow interesting diagnostics for the explosion parameters (Elmhamdi, Chugai, & Danziger, 2003). It is remarkable that from the plateau to the first point of the radioactive tail there is a drop of 6 mag in about 200 days, which is much larger than that seen in normal SNe IIP. Afterwards, the late time decline rates in the different bands (cfr. Tab. 10), computed including also data from Andrews et al. (2010), are rather similar to those of most normal SNe IIP (Turatto et al., 1990; Patat et al., 1994). The V band decline rate is 0.94 mag (100d)-1, close to the 0.98 mag (100d)-1 (e-folding time 111.26 days) expected if the luminosity is powered by the decay of 56Co to 56Fe.

In Fig. 5 we show the time evolution of B–V, V–I and J–H color curves of SN 2007od, together with those of SNe 1987A, 2005cs, 2004et, 1999em, dereddened according to the values of Tab. 6. All these SNe IIP show quite similar colour evolutions with a rapid increase of the B–V colour as the supernova envelope expands and cools down. After about 40 days the colour varies more slowly as the rate of cooling decreases. SN 2007od follows this behavior. The only exception to this smooth trend is SN 2005cs which shows a red spike at about 120d (when data of SN 2007od are missing). Such a red spike seems to mark low-luminosity SNe IIP in correspondence to the steep post-plateau decline (Pastorello et al., 2004). The V–I colour increases in a linear fashion for all SNe IIP during the plateau phase, and remains roughly constant during the nebular phase (Fig. 5). The colour evolution of SN 2007od is similar to that of other type IIP SNe, although it is possibly redder at early phases. In the nebular phase, the colour curves SN 2007od seem to become bluer, especially the B–V curve, similarly to SN 2004et. Note, however, that such claim is based on a single point affected by large uncertainty. The similarity with 2004et in the nebular phase is supported by the V–I colour evolution. Only sparse data are available for type IIP SNe in the NIR, especially during the nebular phase. For this reason in this domain we compared only a few well-studied, recent events such as SNe 2005cs and 2004et, plus the reference type II SN 1987A. Their J–H colour curves (Fig. 5) remain constant at J–H mag until the phase of 120 days. For the later nebular phase, the single epoch J–H measurement of SN 2007od was found consistent with a similar measurement for SN 2005cs.
| SN | E(B–V) | Parent Galaxy | References | |
|---|---|---|---|---|
| 1979C | 31.16 | 0.009 | NGC4321 | 1 |
| 1987A | 18.49 | 0.195 | LMC | 2 |
| 1992H | 32.28 | 0.027 | NGC 5377 | 3 |
| 1999em | 29.47 | 0.1 | NGC 1637 | 4,5 |
| 2004et | 28.85 | 0.41 | NGC 6946 | 6 |
| 2005cs | 29.62 | 0.05 | M 51 | 7 |
2.5 Reddening and absolute magnitude
The Galactic reddening to UGC 12846 was estimated as Eg(B-V)=0.038 (A=0.155, Schlegel, Finkbeiner, & Davis, 1998). In our best resolution optical spectra (cfr. Sect. 3), the absorption features due to interstellar NaID (5890,5896) lines of the Galaxy are present with average EWg(NaID) 0.42 Å. According to Turatto, Benetti, & Cappellaro (2003), this corresponds to a galactic reddening Eg(B-V)0.07 mag (which can be transformed through the standard reddening law of Cardelli, Clayton, & Mathis (1989) to Ag(B)0.28). Interstellar NaID lines at the redshift of UGC 12846 are not detected even in our best signal-to-noise NTT spectrum of November 27 (EWi(NaID) 0.10 Å) suggesting that the extinction in the host galaxy is negligible. This is not surprising, considering the position of the SN well outside the main body of the galaxy, and the absence of foreground/background structure at its location even in our late, deep images. Throughout this paper, therefore, for SN 2007od we will assume a total reddening of Eg(B-V)=0.038 mag.
NED provides a heliocentric radial velocity of vhel(UGC12846) 3 km s-1. Correcting for the Virgo infall (km s-1, Mould et al., 2000) and adopting H0=72 km s-1Mpc-1, we obtain a distance modulus =32.050.15 which will be used throughout this paper. This is in agreement with the distance modulus =31.91 (H0=75 km s-1Mpc-1) provided by Tully (1988). NED provides also the recession velocities corrected for the Virgo Cluster, the Great Attractor, and the Shapley Supercluster velocity fields (Virgo+GA and Virgo+GA+Shapley). Both are marginally lower and their use would produce distance moduli smaller (and absolute magnitudes fainter) by about 0.1 mag.
Assuming the above distance and extinction values, we find , , , and , where the reported errors include the uncertainties of our photometry, the adopted distance modulus, and the interstellar reddening.
2.6 Bolometric light curve and 56Ni mass
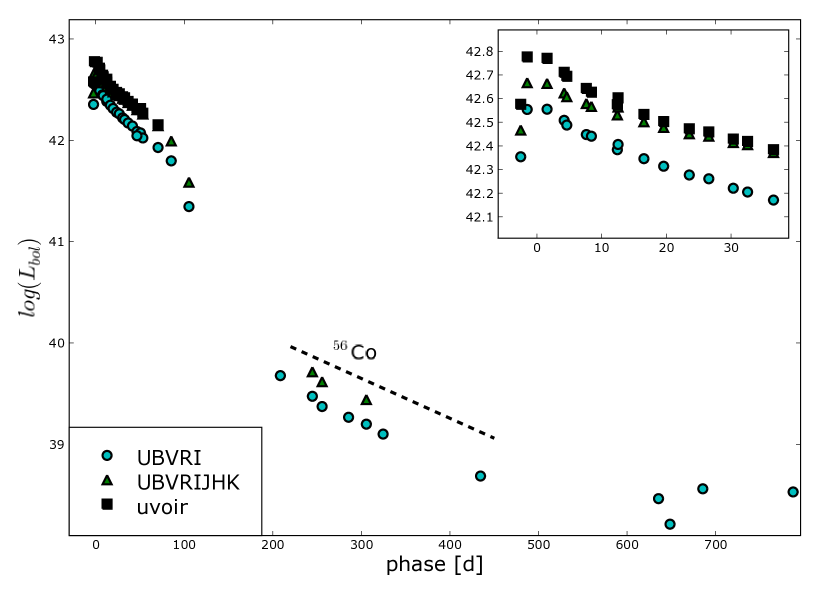
The (uvoir) bolometric light curve of SN 2007od (Fig. 6) was obtained by converting the observed broad band magnitudes (uvw2,uvm2,uvw1,U,B,V,R,I,J,H,K) into fluxes at the effective wavelength, then correcting for the adopted extinction (cfr. Sect. 2.5), and finally integrating the resulting Spectral Energy Distribution (SED) over wavelength, assuming zero flux at the integration limits. Flux was then converted to luminosity by using the distance adopted in Sec. 2.5. The emitted flux was computed at the phases in which R observations were available. When observations in a bandpass were unavailable in a given night, the magnitudes were obtained by interpolating the light curves using low-order polynomials, or were extrapolated using constant colours. The pre-maximum bolometric is based mainly on R band observations and should be regarded as uncertain. The peak of the uvoir bolometric light curve is reached very close in time to the R maximum, on JD = 2454410.0 2.0, and at a luminosity Lbol = 6.0 x 1042 erg s-1. In Fig. 6, together with the uvoir light curve, we also plot the light curves obtained by integrating UBVRI and UBVRIJHK contributions only.
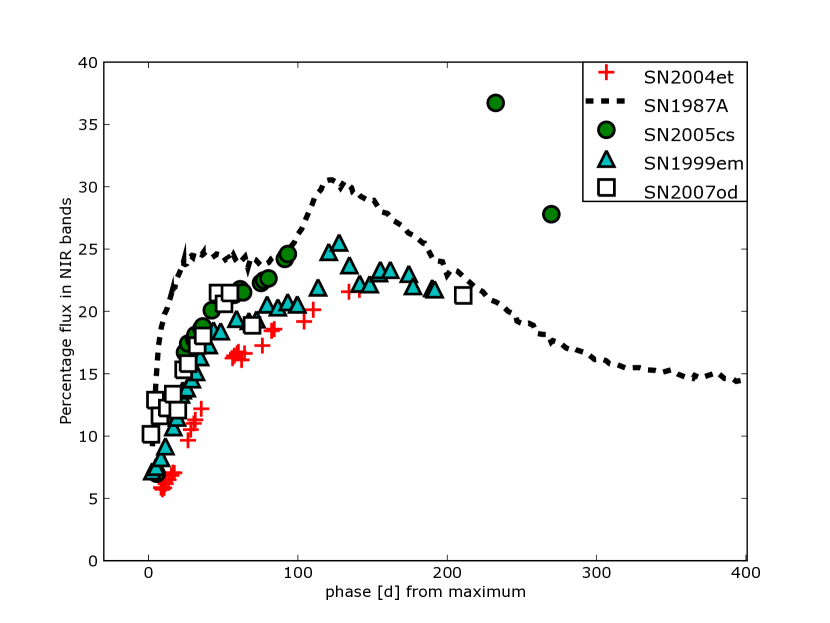
The light curve (from U to K) of SN 2007od shows a significant NIR (JHK) contribution, as displayed in Fig. 7. The progressive rise of the NIR flux in the photospheric phase is similar to that of other SNe IIP while the contribution in the nebular phase is constant at least until 220d (Fig. 7). This result is similar to that found by Maguire et al. (2010) for SN 2004et.
.
As for individual bands, the nebular tail of the bolometric light curve closely matches the slope expected from the decay of 56Co to 56Fe, suggesting complete -ray trapping. The measured slope is mag , close to the canonical value of mag of 56Co decay. After day 500, the curve, based only on data by Andrews et al. (2010), flattens.
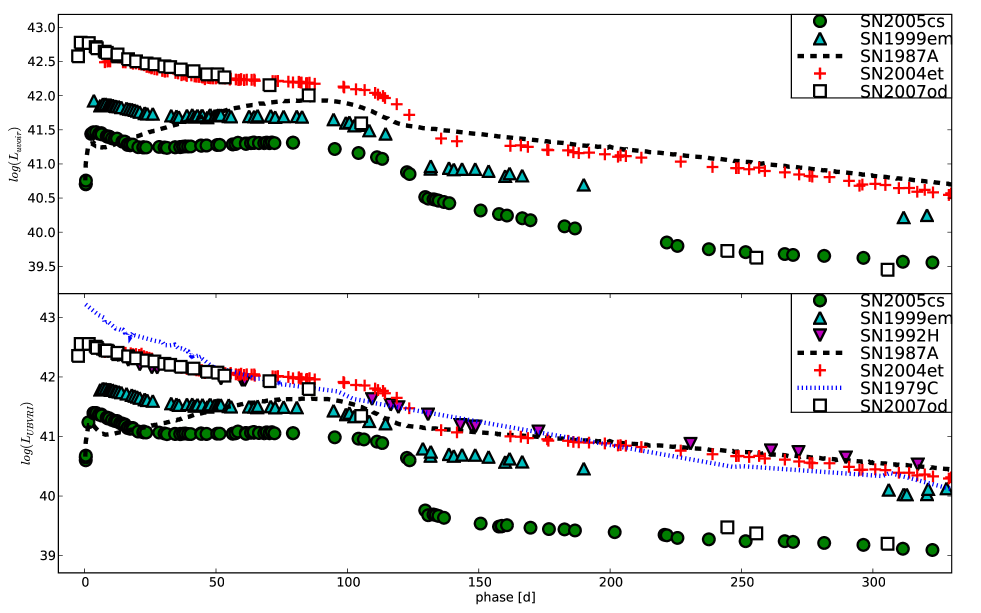
In Fig. 8 we compare the bolometric light curve of SN 2007od with those of other SNe. The comparison points out the large drop in magnitude ( 6 mag) from the plateau to the radioactive tail and the small amount of 56Ni (cfr. Sec. 4). The SNe chosen for the comparison are those reported in Tab. 6. Unfortunately, not many of them have spectral coverage from the optical to the NIR, and therefore the comparison was done either for UBVRIJHK (top panel) or UBVRI (bottom panel) bolometric curves. The early luminosity of SN 2007od is comparable to those of the luminous SN 1992H and SN 2004et. The behavior of the light curve is certainly more similar to that of Type IIP SNe with respect to the Linear SN II 1979C proposed for comparison (the average decline rate by Patat et al. (1994) is mag (100d)-1, typical of SN IIP). The similarity to SN 1992H is noticeable in the photospheric phase where both SNe present the same early decline and short plateau, a possible evidence of a low-mass H envelope. On the other hand, the radioactive tail of SN 2007od is more yhan 1 dex fainter than that of SN 1992H.
The 56Ni mass ejected in the nebular phase by SN 2007od can be derived by comparing the bolometric light curve (Fig. 8 Top) to that of SN 1987A assuming a similar -ray deposition fraction
| (1) |
where M(56Ni)87A = 0.075 0.005 M⊙ is the mass of 56Ni ejected by SN 1987A (Arnett, 1996), and L87A is the bolometric luminosity at comparable epoch. The comparison gives M(56Ni)07od 0.003 M⊙. Making the reasonable assumption that -rays from 56Co decay are fully thermalized at this epoch, we crosschecked this result with the formula
| (2) |
from Hamuy (2003), where t0 is the explosion epoch, 6.1d is the half-life of 56Ni and 111.26d is the e-folding time of the 56Co decay, which releases 1.71 MeV and 3.57 MeV respectively as -rays (Cappellaro et al., 1997; Woosley, Hartmann, & Pinto, 1989). This method provides M(56Ni) 0.003 M⊙, fully consistent with the previous estimate. Indeed Fig. 8 also shows that L07od is similar to that of SN 2005cs, which ejected M⊙ 56Ni (Pastorello et al., 2009), and to other under-luminous type II events (Pastorello et al., 2004).
The luminous plateau of SN 2007od, comparable with that of the brightest SNe IIP, coupled to an under-luminous tail is very unusual (Pastorello, 2003). In Sect. 3.2 we will show that on day 310 (but also in the spectra on day 226 by Andrews et al., 2010) there is evidence of dust formation. Thus the low luminosity in the nebular phase may be due not only to a low 56Ni production. The value determined above should be considered as a lower limit. Indeed, the late-time MIR (mid infrared) data published from Andrews et al. (2010) allows us to study the SED up to the M band. The IR bands show clear evidence of strong blackbody emission due to the re-emission of radiation absorbed at shorter wavelengths. Adding this contribution to the bolometric flux, Eq. 2 provides M(56Ni) M⊙ at the first two epochs of MIR observations. The estimate on a third epoch is less reliable because based only on 3.6 and 4.5 observations. We address the issue of dust formation in Sec. 5.
3 Spectroscopy
The spectroscopic monitoring of SN 2007od was carried out with several telescopes over a period of eleven months. The journal of spectroscopic observations is reported in Tab. 7.
3.1 Spectra reduction
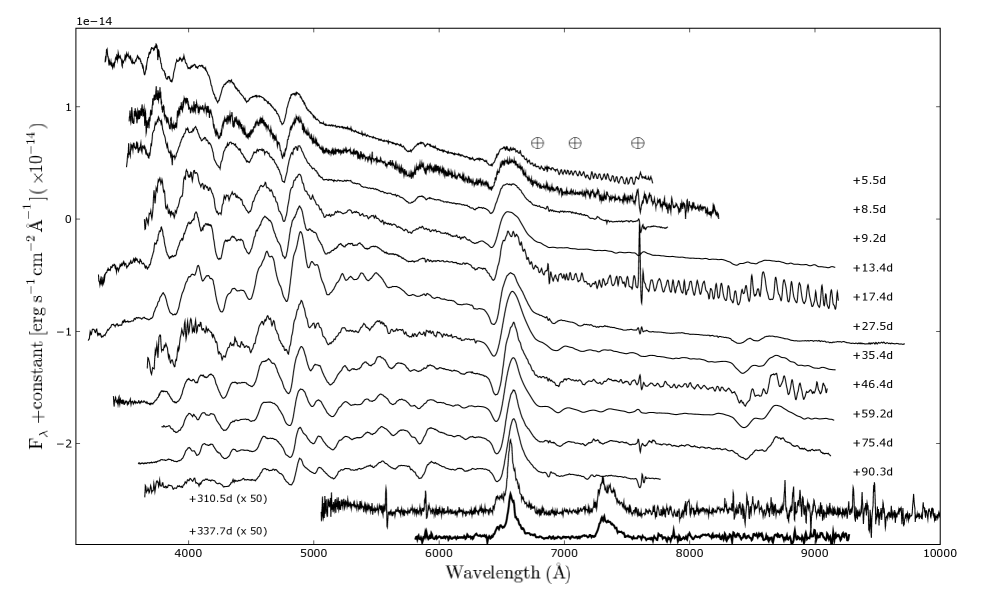
Spectra were reduced (trim, overscan, bias and flat–field corrected) using standard routines of IRAF. Optimal extraction of the spectra was implemented to improve the signal to noise (S/N) ratio. Wavelength calibration was performed through spectra of comparison lamps obtained with the same configuration as the science observations. Atmospheric extinction correction was based on tabulated extinction coefficients for each telescope site. Flux calibration was performed using spectrophotometric standard stars observed in the same night with the same set-up of the SN. Absolute flux calibration was then checked through comparison with the photometry. This analysis was done by integrating the spectral flux transmitted by standard BVRI filters. When necessary, a small multiplicative factor was applied. The resulting calibration error is 0.1 mag. The spectral resolutions reported in Tab. 7 were estimated from the full width at half maxima (FWHM) of the night sky lines. We finally used the spectra of the standard stars to remove (or reduce) the telluric features in the SN spectra. The regions of the strongest atmospheric absorptions are marked in Fig. 9. Spectra of similar quality obtained in the same night with the same telescope were combined to increase the S/N ratio.
The spectrum of November 8 (9.2d) revealed some problems in the flux calibration of the blue side. The spectral continuum was forced to follow the SED derived with a fourth order polynomial fit to the photometry obtained in the same night. This spectrum will not be used to estimate the continuum temperature in Sec 3.4.
| Date | JD | Phase∗ | Instrumental | Range | Resolution† |
|---|---|---|---|---|---|
| +2400000 | (days) | setup⋄ | (Å) | (Å) | |
| 04/11/07 | 54409.5 | 5.5 | TNG+DOLORES+LRB‡ | 3330-7700 | 14 |
| 07/11/07 | 54412.5 | 8.5 | Pennar+B&C+300tr/mm | 3520-8230 | 10 |
| 08/11/07 | 54413.2 | 9.2 | Copernico+AFOSC+gm4 | 3500-7820 | 24 |
| 12/11/07 | 54417.4 | 13.4 | Copernico +AFOSC+gm4,gm2 | 3640-9150 | 39 |
| 16/11/07 | 54421.4 | 17.4 | TNG+DOLORES+LRB,LRR‡ | 3280-9190 | 14 |
| 27/11/07 | 54431.5 | 27.5 | NTT+EMMI+gm2,gr5 | 3200-9710 | 11 |
| 05/12/07 | 54439.4 | 35.4 | Copernico +AFOSC+gm4,gm2 | 3660-9160 | 25 |
| 15/12/07 | 54450.4 | 46.4 | TNG+DOLORES+LRB,LRR‡ | 3400-9100 | 14 |
| 28/12/07 | 54463.2 | 59.2 | Copernico +AFOSC+gm4,gm2 | 3780-9150 | 23 |
| 13/01/08 | 54479.4 | 75.4 | NOT+ALFOSC+gm4 | 3600-9120 | 13 |
| 28/01/08 | 54494.3 | 90.3 | Copernico +AFOSC+gm4 | 3640-7760 | 23 |
| 05/09/08 | 54714.5 | 311 | TNG+DOLORES+LRR | 5050-10250 | 16 |
| 02/10/08 | 54741.7 | 338 | PALOMAR+DBSP+red | 5800-9270 | 17 |
∗ with respect to the explosion epoch (JD 2454404)
⋄ the abbreviations are the same as in Tab. 1 with, in addition, Pennar = 1.22m Galileo Galilei telescope (Pennar, Asiago, Italy)
and PALOMAR = 5.1m Hale Telescope (San Diego County, California, U.S.A.)
as measured from the full-width at half maximum (FWHM) of the night sky lines
engineering CCD
3.2 Spectra analysis
Fig. 9 shows the entire evolution of SN 2007od from the first spectrum (near the R-band maximum) to about 1 year later. The evolution is very well sampled in the photospheric phase. As for the photometry, the transition from photospheric to nebular stages was not observed because the SN was behind the Sun. Line identification relies on qualitative arguments based on the presence of lines of the same ions at consistent velocity and by comparison with template spectra of other SNe IIP, e.g., 2005cs (Pastorello et al., 2006), 2004et (Maguire et al., 2010) and 1999em (Baron et al., 2000; Elmhamdi et al., 2003; Pastorello, 2003). For most of them detailed line identification was carried out also with spectral modeling.
The first spectra (5-13 days) are characterized by a blue continuum, yet cooler than those of SNe 1999em and 2005cs (cfr. Fig. 11). The most prominent features (Fig. 10, top) are the H Balmer lines and He I 5876, all with a normal P-Cygni profile except H which shows a weak absorption component and a boxy emission. This profile, which resembles a detached atmosphere profile (Jeffery & Branch, 1990), might be the signature of a weak interaction with a low density CSM (e.g. SN 1999em Pooley et al., 2002).
Two absorption features are worth mentioning: one is prominent on the blue side of H at about 4440Å (marked as high velocity, HV, H in Fig. 10 Top), the other, much fainter, on the blue side of H, at about 6250Å in the first spectrum (marked as Si II in Fig. 10 top). These lines were noted before in the spectra of SNe IIP. In the case of SN 2005cs (Pastorello et al., 2006) the feature near 4440Å was identified as N II 4623, supported by the presence of another N II line at about 5580Å. The latter line is not seen in the spectra of SN 2007od at the expected position. Baron et al. (2000) discussed such lines in an early spectrum of SN 1999em. While the parametrized SYNOW code suggested that the 4400Å feature was consistent with N II, the non-LTE code PHOENIX rejected this identification because of the absence of the feature around 5580Å. Instead, the positions of both features were consistent with being Balmer lines produced in a high–velocity (HV) layer. Such combined identification does not seem plausible in the case of SN 2007od because the expansion velocity of the HV H line is much faster than that of the putative HV H (25000 vs. 15000 km s-1).
In our first set of spectra (5d - 13d), another absorption line is visible around 3980Å, between H and the H&K doublet of Ca II. This feature (marked as HV H in Fig. 10 top) has the same velocity of the mentioned HV H ( km s-1) and might therefore be produced in the same layer. Up to phase 13d the trend of these lines is the same. From day 17 the HV H disappears, likely hidden by the increasing strength of metal lines such as Fe II and Ti II. We suggest that these are indeed HV Balmer lines and that the HV H component is missing because H level is mostly populated collisionally, similarly to what is seen in SN IIL (Branch et al., 1981). This difference among the Balmer lines can be noted also in the early spectra of SN 1993J, which showed a more pronounced P-Cygni absorption for H and H than for H. We also mention the possibility that a contribution to the 4440 Å and the 3980 Å features is given by HeI 4471 and H, respectively. However, an extensive study with SYNOW and PHOENIX on the early spectra of SN 2007od (Inserra, Baron et al., in preparation) seems to favour the identification of the two features with HV components of H and H.
In the early spectra of SN 2007od, H&K of Ca II and a combination of Fe I, Ti II and Sc I around 4000Å are also identified. The line at about 6250Å is probably Si II 6355 as suggested by the expansion velocity, consistent with that of the other metal ions. The presence of Si II is fully blown at early times in type Ia, but also proposed in several Type II SNe such as 2005cs (Pastorello et al., 2006), 1992H (Clocchiatti et al., 1996), 1999em (Dessart & Hillier, 2005) and 1990E (Schmidt et al., 1993).
In the spectrum of November 12 (phase = 13.4 days) a faint feature appears at about 6200Å and is probably due to Sc II (6300) or Fe II (6305). In this spectrum there is also evidence of a feature at about 6375 Å, close to the blue edge of the H absorption, possibly due to Fe II 6456. The 13.4d spectrum, the first extending to 1 micron, shows the presence of the Ca II IR triplet ( 8498, 8542, 8662).
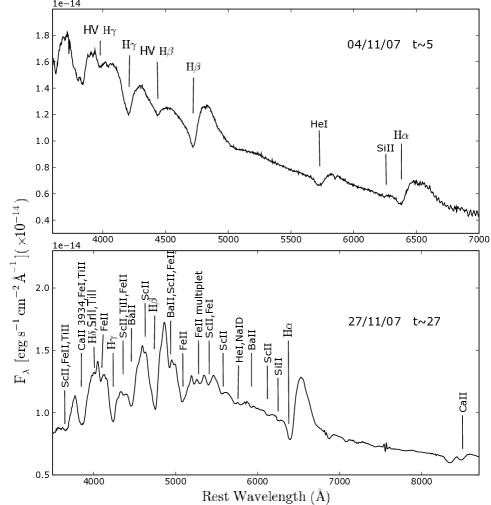
In the subsequent set of spectra (phase 17-90 days) a number of well developed features with P-Cygni profiles appear, in addition to the persistent Balmer lines of H (Fig. 10, bottom). In the region between H and H, a group of lines identified as Sc II, Ti II and Fe II around 4420Å, Ba II at 4450 and Sc II 4670 (on the blue side of H) become more prominent than in earlier spectra. At this phase several other metal lines appear. The Fe II multiplet 42 lines ( 4924, 5018, 5169) are visible to the red side of H along with Fe I and Sc II in the region between 5200Å and 5500 Å and, starting from day 17, Sc II 5658. Other features are identified as a blend of Ba II 4997 and Sc II 5031 on the red side of H and Sc II 6245. On day 27 the He I 5876 line is weak and blended with Na ID which becomes progressively stronger and replaces He I in subsequent spectra.
The presence of C I lines in spectra of type IIP SNe was claimed in some objects, e.g., in SNe 1995V (Fassia et al., 1998) and 1999em (Pastorello, 2003). In spectra of SN 2007od at 75 days a faint absorption on the red wing of Ca II IR triplet could be attributed to C I 9061 but no other C I lines are visible to support this finding.
Two spectra are available in the nebular phase (310-338 days). In both spectra the peaks of the H emission are blue-shifted by the same amount (1500 km s-1). The line shows a multi–component structure that will be discussed in Sec. 4. These spectra show also forbidden emission lines of [Ca II] 7291, 7324, and weak evidence of [O I] 6300, 6364 and [Fe II] 7155, which are common features in SNe IIP.
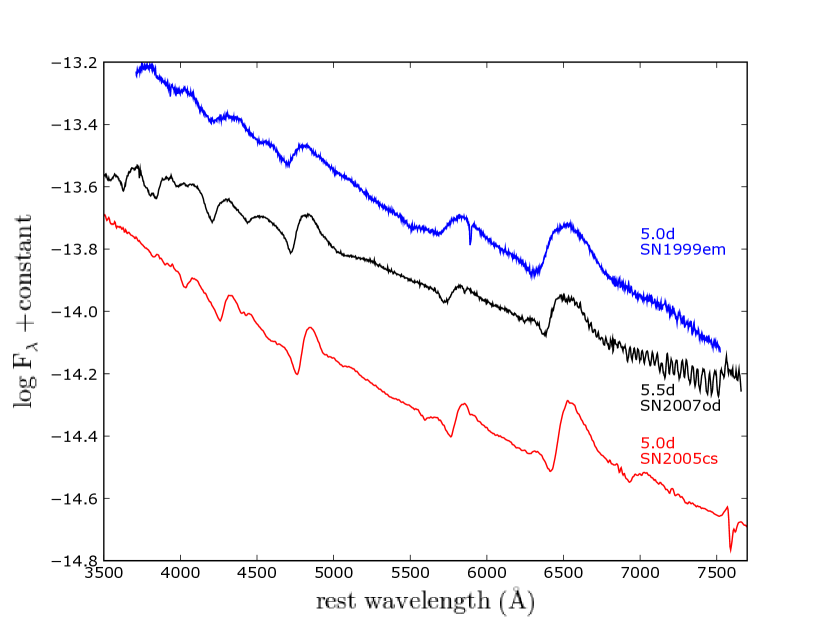
3.3 Comparison with other SNe
In Fig. 11 we compare the spectrum of SN 2007od at 5 days with two other young SNe IIP: SN 1999em (Elmhamdi et al., 2003) and SN 2005cs (Pastorello et al., 2006). The similarity with SN 1999em was prompted by the GELATO spectral comparison tool (Harutyunyan et al., 2008), while the comparison with the faint SN 2005cs is made because of the characteristic features on the blue side of H and Si II lines. All spectra show relatively blue continua and display H Balmer lines and He I 5786Å. The spectrum of SN 2007od shows a boxy profile of H which suggests an ejecta-CSM interaction scenario, but no radio or X-ray observations at early phases are available to confirm such a hypothesis.
The feature at about 4440Å, discussed in Sec. 3.2, is possibly detected in SN 2005cs, but not in SN 1999em. A weak line around 5600Å, observed only in SN 2005cs (cfr. Pastorello et al., 2006) and (possibly) in SN 1999em, and tentatively identified as N II, is not visible in SN 2007od.
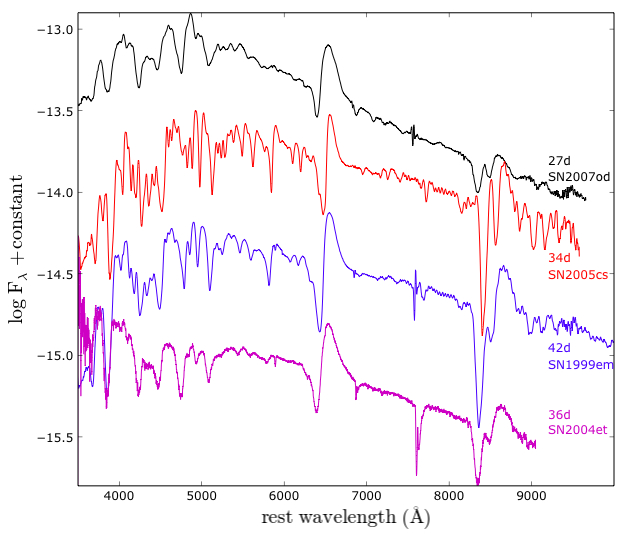
In Fig. 12 a few spectra of type IIP SNe during the plateau phase are compared. SN 2004et (Maguire et al., 2010) was added here because of the similarity in the bolometric light curve at early times (Fig. 8). The spectrum of SN 2007od seems to have shallower absorption components than other SNe at the same phase, probably because of temperature difference. Alternatively this effect may be due to circumstellar interaction throught SN 1999em toplighting effect (Branch et al., 2000). In such scenario the fast ejecta catches and sweeps up the much slower circumstellar matter from the wind of the SN progenitor (or its binary companion) and produces a continuum emission above the photosphere. The global effect is to increase the total luminosity decreasing the contrast of spectral lines. It is also possible that the reverse shock decelerate the gas and produces low photospheric velocities. The lines close to the blue edge of H at about 6300Å are visible also in the spectrum of SN 2005cs and in SN 1999em but not in SN 2004et (Maguire et al., 2010).
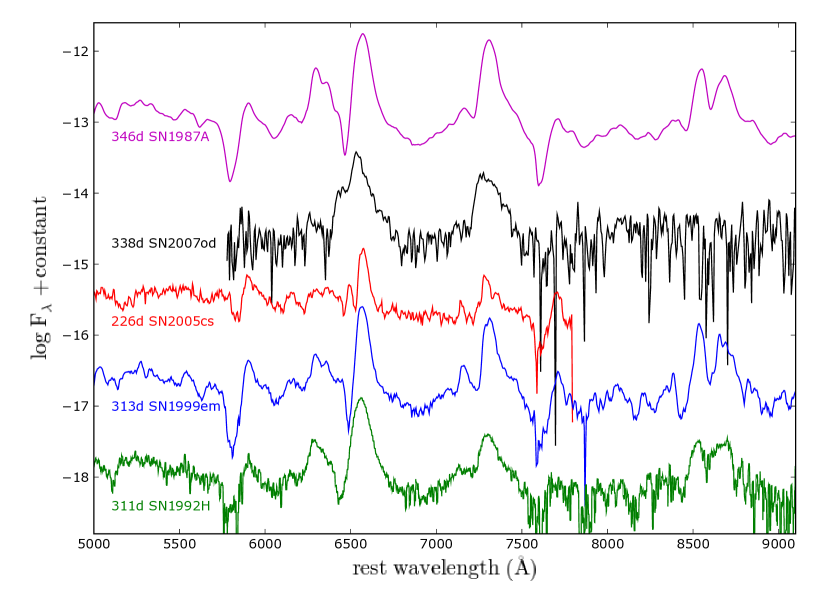
The last comparison (Fig. 13) is made for the nebular phase with SN 1987A (Suntzeff & Bouchet, 1990), SN 2005cs (Pastorello et al., 2009), SN 1999em (Elmhamdi et al., 2003) and the luminous SN 1992H (Clocchiatti et al., 1996). The H profile of SN 2007od differs from those of the other SNe. The central peak is blue-shifted and there is a boxy shoulder on the blue side (see Sec. 4). Also [CaII] is blue-shifted and shows an asymmetric profile. Instead, [OI] 6300, 6363 doublet, [FeII] at 7000Å and NaID are barely detectable preventing a detailed analysis of the line profiles.
3.4 Expansion velocity and temperatures
The expansion velocities of H, H, He I 5876Å, Fe II 5169Å and Sc II 6246Å, derived from fits to the absorption minima, are reported in Tab. 8 and plotted in Fig. 14 (Top panel). Error estimates are derived from the scatter of several independent measurements. The velocities of H are comparable with those of H during the first 20 days, and progressively higher afterwards. During the 20 days in which the He I line remains visible the velocity is about 1000 km s-1 smaller than that of H. Fe II velocity, which is a good indicator for the photospheric velocity because of the small optical depth, is lower than that of H and He I, and decreases below 3000 km s-1 at about three months. Sc II is also a good indicator of the photospheric velocity and its velocity is very close to that of Fe II, supporting the identifications of both ions.
| JD | Phase∗ | T | v() | v() | v(He I) | v(Fe II) | v(Sc II) |
|---|---|---|---|---|---|---|---|
| +2400000 | (days) | (K) | (km s-1) | (km s-1) | (km s-1) | (km s-1) | (km s-1) |
| 54409.5 | 5.5 | 11830 350 | 8822 104 | 8764 164 | 7658 122 | ||
| 54412.5 | 8.5 | 9591 350 | 8639 62 | 8455 140 | 7454 150 | ||
| 54413.2 | 9.2 | 10429 350 | 8626 60 | 8270 140 | 7301 100 | ||
| 54417.4 | 13.4 | 9620 350 | 8457 82 | 8023 150 | 7199 105 | 5745 132 | 5400 200 |
| 54421.4 | 17.4 | 8305 350 | 7794 66 | 7610 114 | 6382 137 | 5270 280 | 5100 200 |
| 54431.5 | 27.5 | 8328 350 | 7771 75 | 6912 130 | 4869 200 | 4770 110 | |
| 54439.4 | 35.4 | 7123 350 | 7565 75 | 6425 400 | 4515 110 | 4161 250 | |
| 54450.4 | 46.4 | 5755 350 | 6857 75 | 5863 133 | 3946 120 | 3880 200 | |
| 54463.2 | 59.2 | 5470 350 | 6788 75 | 5493 128 | 3250 116 | 3450 300 | |
| 54479.4 | 75.4 | 5450 350 | 6468 95 | 5024 100 | 3001 120 | 3130 200 | |
| 54494.3 | 90.3 | 4429 350 | 6308 101 | 4777 102 | 2736 110 | 2670 100 |
∗ with respect to the explosion epoch (JD 2454404)
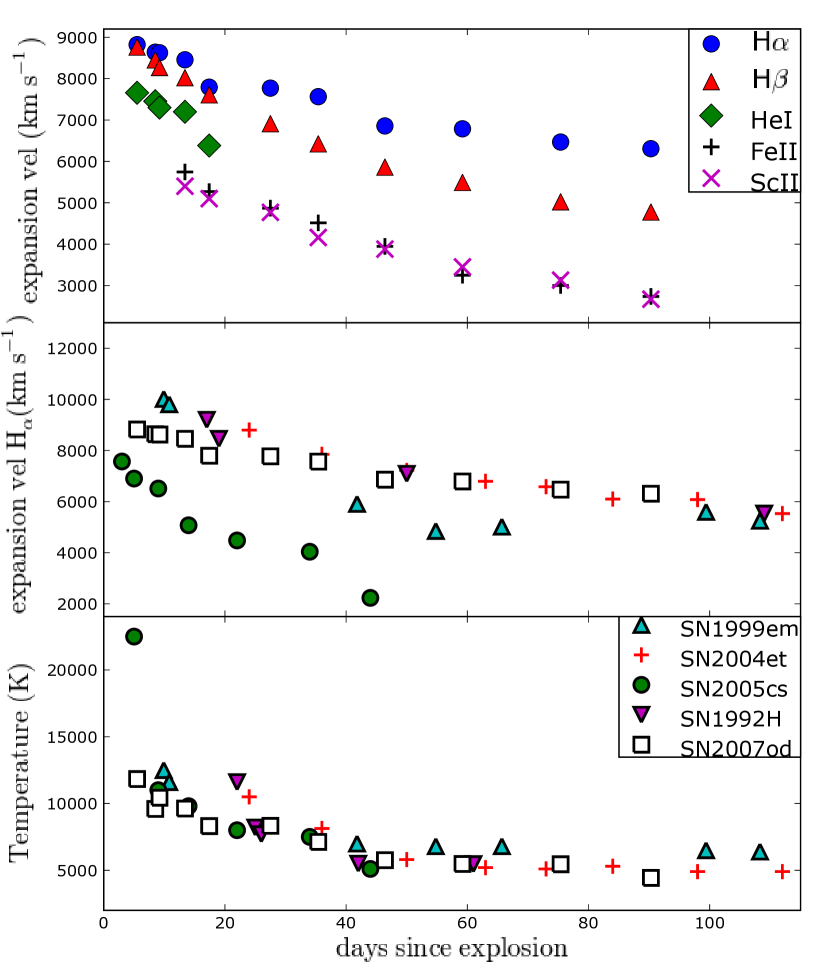
In Fig. 14 (middle) we compare the H velocity evolution of SN 2007od with those of our comparison sample of Type IIP. In the first months, the H velocity of SN 2007od is comparable to those of SN 1999em, SN 2004et, SN 1992H, and higher than that of SN 2005cs, which is known to have slow photospheric expansion. As a major difference from other objects the velocity decrement is always rather constant, even in early phases. The early velocity of SN 2007od, lower than those of the other SNe of our sample, might be attributed to early-phase interaction with a low density, thin CSM (cfr. Sect. 3.3).
The early spectra of SN 2007od are fairly blue, suggesting moderately hot black-body temperatures (T K). In Fig. 14 (bottom) the evolution of the temperature derived from the blackbody fits to the spectral continuum is shown and compared with those of the reference sample. The temperature evolution of SN 2007od is rather normal, although its temperature during the very first days past explosion never reached 12000 K. About 40 days after explosion the temperature becomes constant, in analogy to what observed in SNe 2004et, 1999em and 1992H. This phase corresponds to the beginning of the H envelope recombination.
4 Dust formation and CSM interaction
Already 40 years ago it was suggested that SNe could be an important source of dust in the interstellar medium (ISM) (Cernuschi, Marsicano, & Codina, 1967; Hoyle & Wickramasinghe, 1970). Recent studies on the origin of dust (Todini & Ferrara, 2001; Nozawa et al., 2003; Dwek, Galliano, & Jones, 2007) have supported this view, calling for core-collapse SNe as significant sources of dust in the Universe. In fact, a number of objects have shown clear evidence of dust formation, e.g., type IIn SNe 1998S (Pozzo et al., 2004; Gerardy et al., 2000), 1995N (Gerardy et al., 2002), and 2005ip (Fox et al., 2009), type IIP SNe 1999em (Elmhamdi et al., 2003), 2004et (Maguire et al., 2010; Kotak et al., 2009), 2004dj (Kotak et al., 2005; Szalai et al., 2011; Meikle et al., 2011) and 2007it (Andrews et al., 2011), type IIb SN 1993J (Gerardy et al., 2002), and the peculiar SN 1987A (Arnett, 1996; Lucy et al., 1991), SN 2006jc (Mattila et al., 2008) and SN 2008S (Botticella et al., 2009). Though these data support the scenario of CC-SNe being important dust producers, the amount of dust (0.1–1.0 M⊙, Dwek, Galliano, & Jones, 2007; Meikle et al., 2007) required to explain the dust at high redshift is a few orders of magnitude larger than that measured in individual local core-collapse SNe.
| Phase∗ | Velocity⋄ (km s-1) | Flux† | ||||
|---|---|---|---|---|---|---|
| (days) | ————————————————————— | |||||
| Blue | Central Peak | Red | ||||
| edge | position | FWHM | HWHM‡ | Edge | ||
| 60 | -301 | |||||
| 75 | -319 | |||||
| 90 | -240 | |||||
| 226∗∗ | -8270 | -1325 | 4110 | 2100 | 7770 | 51.20 |
| 303∗∗ | -8000 | -1500 | 2790 | 2010 | 7860 | 22.50 |
| 310 | -8100 | -1508 | 2815 | 2230 | 7700 | 22.21 |
| 337 | -8090 | -1568 | 2623 | 2280 | 7680 | 12.43 |
| 342∗∗ | -8180 | -1508 | 2615 | 2200 | 7900 | 14.30 |
| 452∗∗ | -8100 | -1100 | 2970 | 2600 | 7850 | 5.28 |
| 666/692∗∗ | -7400 | |||||
∗ with respect to the explosion epoch (JD 2454404).
⋄ with respect to the H rest frame wavelength.
† 10-16 erg s-1 cm-2
‡ HWHM of the blue, unabsorbed wing computed with respect to the rest frame wavelength.
∗∗ spectra from Andrews et al. (2010), flux calibrated with broad band photometry.
There are manifold observational signatures of the formation of dust in SN ejecta. Examples are the dimming of the red wings of line profiles due to the attenuation of the emission originating in the receding layers, and the steepening of the optical light curves. These effects were observed in SN 1987A (Arnett, 1996; Lucy et al., 1991) , SN 1998S (Pozzo et al., 2004), SN 1999em (Elmhamdi et al., 2003) and SN 2004et (Maguire et al., 2010). Additional evidence is a strong IR excess observed in a few objects at late times, e.g. SNe 1998S and 2004et, but also, though very rarely, at early times, as in SN 2006jc. We stress that for the comprehension of the physical processes occurring in the aftermath of the explosions it is important to distinguish between IR thermal emission from newly formed dust within the SN ejecta and IR echoes of the maximum-light emission by pre-existing, circumstellar material (CSM).
A distinguishing precursor of dust formation is the detection of rotation-vibration molecular lines of CO, which are powerful coolants. Indeed CO was observed in several SNe, e.g., SNe 1995ad (Spyromilio & Leibundgut, 1996), 1998dl and 1999em (Spyromilio, Leibundgut, & Gilmozzi, 2001), 2002hh (Pozzo et al., 2006), 2004dj (Kotak et al., 2005) and 2004et (Maguire et al., 2010; Kotak et al., 2009), in which also dust formation in the ejecta was detected. The presence of CO molecular lines seems, therefore, a necessary condition for dust condensation in the ejecta, as reported by Pozzo et al. (2004).
Another important issue is the site of dust formation in SNe. Indeed dust in core-collapse SNe has been detected: a) deep within the ejecta, e.g., in SNe 1999em and 1987A, or b) in a cool dense shell (CDS) created by the SN ejecta/CSM interaction, e.g. in SNe 1998S, 2004dj and 2004et. The scenarios are not exclusive and evidence of both phenomena was found, as shown in Kotak et al. (2009). Unfortunately, the paucity of MIR late time observations makes the determination of the site of dust formation very difficult.
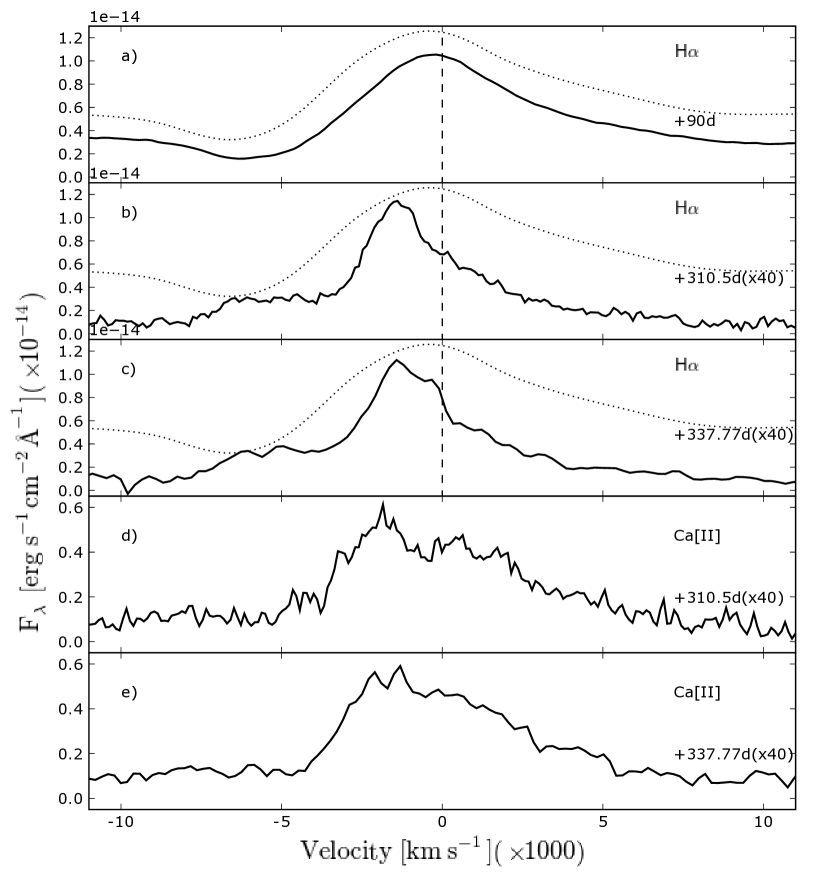
The signature of dust formation in SN 2007od is provided by the blue-shift ( 1500 km s-1) of the peak of H and by the corresponding attenuation of the red wing, which is seen in late time spectra (see the panels of Fig. 15). On the other hand, the decay rates of the optical light curve between 208d and 434d (including also data by Andrews et al. (2010), cfr. Tab. 10) are in close agreement with the decay of 56Co, suggesting that the dust formed during the period of un-observability (February to May 2008), i.e. before the late-time SN recovery (cfr. Sect. 2.4). Indeed Andrews et al. (2010) show that the optical and IR SED of SN 2007od at about 300d can be fitted by the sum of a black-body originating in the SN ejecta plus a cooler black-body emission at 580 K due to dust.
In addition to the H skewed central peak, the line profile (Fig. 15) shows also the presence of structures. A boxy blue shoulder extends to about –8000 km s-1(cfr. Tab 9), then drops rapidly to zero. This is reminiscent of the boxy profiles of late-time interacting SNe II SNe 1979C, 1980K (Fesen et al., 1999, and references therein), 1986E (Cappellaro, Danziger, & Turatto, 1995) which have been interpreted as evidence of interaction of the SN ejecta with a spherical shell of CSM (Chevalier, 1982; Chevalier & Fransson, 1994). We note that, unlike other SNe, in SN 2007od a red, flat shoulder is not visible, possibly because it is attenuated by dust intervening along the line of sight.
A hint of a narrow, unresolved emission at the H rest wavelength, more evident in the Gemini spectra by Andrews et al. (2010), is visible also in our latest spectrum. The peak of the [Ca II] 7292, 7324 emission is also blue-skewed with attenuation of the red wing in analogy to H (panels d and e of Fig. 15). Instead, [Ca II] does not show the blue shoulder indicating that the interaction does not affect the metal-enriched ejecta, as noted in Andrews et al. (2010).
Andrews et al. (2010) noticed analogies between the H profiles of SN 2007od and SN 1998S, and tried to explain the H profile between 8 and 20 months as the combination of different phenomena: the interaction of the ejecta with a CSM torus and a blob of CSM out of the plane of the torus, plus the possible presence of a light echo. Each process corresponds to specific components of the line profile (cfr. their Fig. 4): two components at about km s-1, that arise in the radiative forward shock of the ejecta interacting with the torus which should be highly inclined to produce the low observed projected velocities; a slightly broader component at about km s-1 due to the ejecta–blob interaction with a larger velocity component along the line of sight; a residual ejecta component similar to that observed on day 50, required to explain the broad red wing of the line; and a light echo that became dominant about 2 yr after explosion. The blue-shifted component at km s-1 appears stronger than that at km s-1. This asymmetry was attributed to strong extinction suffered by the receding component due to dust formed in the CDS. The weakness of this scenario is in the geometry of the torus. As mentioned above, the torus is required to have an inclination of the order of (for H expansion velocity of the order of 10000 km s-1) to explain the small projected velocities. Even for a thick torus, it is difficult to reconcile the required high inclination with the strong extinction suffered by the red component. For the same ejecta velocity the inclination of the blob along the line of sight is about , i.e. it is not orthogonal to the torus.
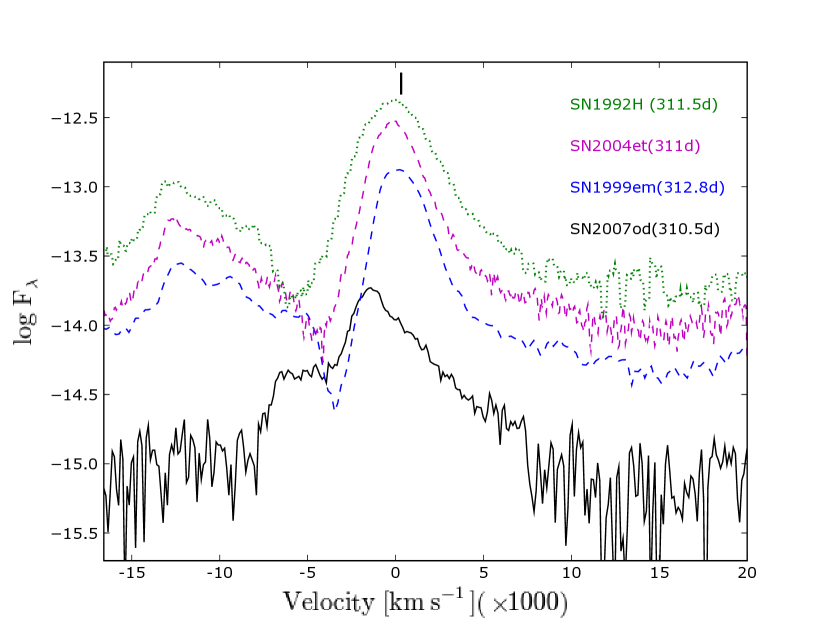
Useful information on the phenomena taking place in SN 2007od at late times come from the comparison of the late H profile with those of other SNe IIP. In Fig. 16 all spectra were corrected for absorption and rescaled to the distance of SN 2007od. The line flux of SN 2007od is significantly smaller than those of other SNe. The blue, (likely) unabsorbed wing of the central/core H emission of SN 2007od roughly coincides in wavelength with the corresponding blue wings of other non-interacting SNe II at similar phases (we stress that SN 1999em at this epoch does not show sign of interaction). In particular, the HWHM(H) km s-1 (Tab. 9) of the blue side is compatible with the FWHM(H)4000 km s-1 of the emission of SN 1992H at 311 days after explosion, a SN that has a similar kinematics to SN 2007od (cfr. Fig. 14). Also the terminal velocities of H seem very similar, since the edge of the blue shoulder of SN 2007od extends out to 8000 km s-1, a velocity comparable to the bluest wing of the residual P-Cyg absorption of SN 1992H. The flux of the blue wing of the central emission (at about 6500Å), likely less absorbed, coincides with those of other SNe II, e.g. SN 1999em. On the contrary, the flux at the rest wavelength is significantly depressed, and even more is the red wing, indicating the presence of dust within the ejecta. The resulting profile is skewed. The comparison, therefore, seems to point towards a common origin of the line cores extending between 6450 and 6650Å as arising from the spherical expanding ejecta.
Evidence of dust in the ejecta was also seen in SN 1987A and SN 1999em. In the case of SN 1987A the dust formed in an inner core at v1800 km s-1 with optical depth at a much later epoch t526d (Lucy et al., 1989) than in SN 2007od. Also in SN 1999em the dust formed late (t500d) when no sign of interaction was present. Here the dust location, within an inner region at v800 km s-1 with , was derived from a careful analysis of the profile of the [O I] 6300-6363 doublet (Elmhamdi et al., 2003). As already mentioned, the [O I] doublet is barely visible in the late spectra of SN 2007od and the analysis relies on the line profile of H which arises mainly from the outer ejecta.
As for the CSM/ejecta geometry proposed by Andrews et al. (2010) to explain the H profile, the formation of dust deep within the ejecta of SN 2007od is also not devoid of problems. In fact, at the early epoch of occurrence (td) the SN ejecta are expected to be too warm for dust condensation (Kozasa, Hasegawa, & Nomoto, 1991), while the presence of interaction at this phase justifies the dust formation in an outer CDS. It is possible that SN 2007od was intrinsically less energetic than average CC-SNe, similar to low–luminosity SNe like 1997D and 2005cs and that the temperature at about 200 days was already low enough to allow dust condensation in some regions of the SN ejecta.
Observations show first evidence of interaction already on day 226. At this epoch the ejecta reached the material expelled by the progenitor in mass loss episodes at short times before explosion. The interaction produces forward and reverse shocks (Chevalier, 1982). In general, between the two shocks the gas undergoes thermal instability and cooling, thus creating a cool dense shell (CDS) in which subsequently dust can form. The formation of a CDS can take place behind the forward shock primarily in the CSM, as invoked in the case of SN 2006jc by Mattila et al. (2008), or behind the reverse shock as in SN 1998S (Pozzo et al., 2004). With a standard mass loss rate, the CDS forms behind the reverse shock, i.e. in the ejecta that are denser and chemically richer, hence more prone to dust formation (Pozzo et al., 2004). The presence of dense clumps in the CSM, which eventually are overcome by the fast SN ejecta, may allow the formation of a CDS (and dust) also in regions that eventually are deeply embedded in the ejecta.
We believe that the observed late-time line profiles at about 300 days can be explained schematically with: 1) a relatively broad skewed emission from SN ejecta (FWHM2800 km s-1) typical of SNe II at corresponding epochs, significantly absorbed by dust formed within the ejecta, possibly in clumps; 2) a distorted boxy profile with high velocity (up to 8000 km s-1), evidence of the interaction of the H-rich ejecta with a spherical outer CSM, with the red shoulder depressed due to dust absorption. The presence of late time interaction is supported by the re-brightening of optical light curves by day 653, as shown by Andrews et al. (2010); 3) an unresolved emission which forms in the un-shocked CSM (cfr. Andrews et al., 2010).
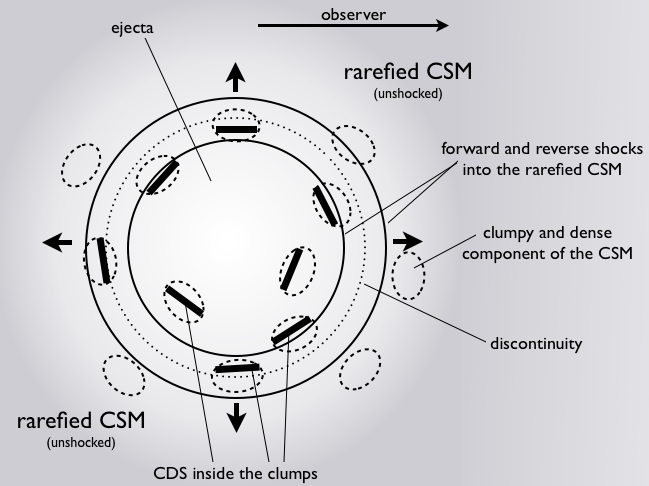
A plausible scenario to explain the observed structure of H could be similar to that proposed for SN 1988Z (Chugai & Danziger, 1994). The ejecta collides with a two-component wind: a spherically symmetric substrate composed of a relatively rarefied gas, and very dense clumps (cfr. Fig. 17). Such structure allows the formation of the boxy profile due to the interaction between the fast expanding ejecta and the CSM and, at the same time, the early formation of dust deep in the ejecta in the CDS of the inner clumps. The dust inside the ejecta progressively screens the radiation arising from the receding layers and skews both the central profile from the unperturbed ejecta and the boxy profile from the interaction. Indeed the profile of H suggests the presence of dust also in the inner ejecta since dust formation in the outer CDS dims both the blue and red wings in the same way, and the red shoulder would appear boxy and not tilted (Fig. 15).
The analysis of the IR SED performed by Andrews et al. (2010) shows a strong IR excess attributable to warm dust, consistent with an amorphous-carbon dominated model with 75 amorphous-carbon and 25% silicate. The radiative transfer models used by Andrews et al. (2010) suggest up to 4.2 x 10⁻⁴ M⊙ dust, mainly composed of amorphous-carbon grains formed in a CDS.
The flat blue shoulder of H is barely visible in the spectrum taken on day 226 but is very well formed on day 337 when the emission extends out to 8200 km s-1, and remains well defined until day 680 (Andrews et al., 2010). Assuming that the CSM is due to the mass loss of material traveling at 10 km s-1, this indicates the presence of CSM in a range of distances of about 1300–1950 AU and that the progenitor experienced enhanced mass loss 500–1000 yr before the explosion.
5 Discussion
In the previous sections we presented new data of the type II SN 2007od in UGC 12846, including for the first time photometric and spectroscopic observations of the early epochs after the explosion.
Analysis of the multicolor and bolometric light curves indicates that at early times SN 2007od was a luminous SN IIP like SNe 1992H and 1992am. The absolute magnitude at maximum, M, the bolometric luminosity L erg s-1 (see Tab. 10), and the relatively short plateaus in V and R suggest an envelope mass smaller than that of standard plateau events.
| position (2000.0) | 23h55m48s.68 | +18o24m54s.8 |
|---|---|---|
| parent galaxy | UGC 12846, Sm: | |
| offset wrt nucleus | 38E | 31S |
| adopted distance modulus | ||
| SN heliocentric velocity | km s-1 | |
| adopted reddening | Eg(B-V) | Etot(B-V) |
| peak time | peak observed | peak absolute | |
|---|---|---|---|
| (JD 2454000+) | magnitude | magnitude | |
| U | |||
| B | |||
| V | |||
| R | |||
| I | |||
| uvoir | L erg s-1 | ||
| rise to R max | days | ||
| explosion day | Oct. 2007 | ||
| late time decline | interval | |
|---|---|---|
| mag(100d)-1 | days | |
| V | 0.94 | 208–434 |
| R | 1.00 | 208–434 |
| I | 1.08 | 208–434 |
| uvoir | 1.053 | 208–434 |
| UBVRI | 1.065 | 208-434 |
| M(Ni) | 0.02 M⊙ |
|---|---|
| M(ejecta) | 5-7.5 M⊙ |
| explosion energy | 0.5 ergs |
SN 2007od shows several interesting properties. At early epochs (td), Tbb and vexp are lower than in other bright SNe II, e.g. SN 1992H and SN 2004et. In the same period the H emission component is squared, and there is evidence for HV features in H and H. These properties, together with bright luminosity and shallow absorption features, point towards early interaction of the ejecta with a low density CSM (cfr. Moriya et al., 2010). The absence of X-ray or radio detection is not against this scenario, because the distance to SN 2007od is 26 Mpc, much larger than that of SN 1999em (7.5-7.8 Mpc). If for SN 2007od we assume the same radio and X-ray luminosity of SN 1999em, the observed flux should be below the treshold of the observation. Indeed the X-ray flux of SN 1999em was close to the limit (about 10-14 ergs cm-2 s-1) as well as the radio flux reported in Pooley et al. (2002). If SN 2007d had the same emission of SN 1999em, the expected X-ray flux would be about 10-15 ergs cm-2 s-1, much lower than the 3 upper limit by Immler & Brown (2007). Moreover, HV features in optical spectra were proposed by Chugai, Chevalier, & Utrobin (2007), as clues of interaction and detected in SN 1999em and SN 2004dj. We claim that this is the case also for SN 2007od. A rough estimate of the CSM mass in close proximity to the progenitor can be derived starting by SYNOW parametrization of the early spectra. Through the optical depth of high-velocity lines (=0.8) we can gain the H density in the transition. Thanks to the Saha equation in LTE approximation it is possible to obtain the ratio between HI (nHI=1.710-30 – 1.410-31 based on different assumptions) and the total H density. This ratio is roughly related to the mass of the CSM. In our case we estimated a CSM mass of the order of 10-3 – 10-4 M⊙. This value is in agreement with the velocities of the HV lines reported in Sec. 3.2, in fact a greater amount of CSM would not allow reaching such velocities.
The light curves show a drop of 6 mag from the plateau to the tail. The tail is therefore relatively faint, corresponding to a 56Ni mass M(56Ni) 3x10⁻³ M⊙, unusually small for SNe IIP that are luminous at maximum and are comparable to those estimated in faint SNe IIP such as SN 2005cs. In Sect. 4 we show spectroscopic evidence of dust formation at late times and therefore that the derived amount of 56Ni should be considered as a lower limit. A more solid estimate, based on the bolometric flux including the MIR late time emission by Andrews et al. (2010), is M(56Ni) 2x10⁻² M⊙, thus indicating that about 90% of the optical+NIR emission is reprocessed by dust.
Dust formation occurs within day 226 after the explosion, quite early in comparison to other core-collapse SNe, e.g. SN 1987A, SN 1999em and SN 2004et. To our knowledge, SN 2007od is the type IIP SN showing the earliest dust formation. Late-time optical spectroscopy shows also clear signs of strong ejecta–CSM interaction. Indeed, the complex H profile can be interpreted as the combination of a typical ejecta emission, ejecta–CSM interaction, and the presence of dust in clumps. However, the combined effect of interaction and dust does not affect the decline rate that is similar to that of 56Co decay from 208 to 434 days past explosion (Fig. 6). CSM-ejecta interaction makes a minor contribution to the bolometric luminosity and only affects line profiles. A flattening of the light curve might be present after day 600 as shown in Andrews et al. (2010), either because of increased interaction or a light echo, but the data are too inhomogeneous for a strong statement in this sense.
Because of the location in the outskirts of the parent galaxy, the metallicity at the position of SN 2007od could not be determined from our spectra nor were we able to find spectra of the host galaxy in the main public archives. UGC 12846 is classified as Magellanic Spiral (Sm:) of low surface brightness (LSB), as confirmed by our Fig. 1 (left) in which the host galaxy is barely visible. LSB galaxies are objects with peak surface brightness 22.5-23 mag arcsec-2 having generally low metallicity (ZZ⊙ McGaugh (1994); 0.1Z(LSB)/Z⊙0.5, with no radial dependence de Blok & van der Hulst (1998)). Smoker, Axon, & Davies (1999) and Smoker et al. (2000) for UGC 12846 report a central surface brightness 22.65 decreasing to mag arcsec-2 at position of the SN. Using (Smoker, Axon, & Davies, 1999) and the diagram shown in McGaugh (1994) we can consider UGC 12846 as a LSB with average oxygen abundance. Therefore, the environment of SN 2007od is likely metal poor with log(O/H) . In general, we expect that low metallicity stars suffer little mass loss and have big He cores and massive H envelopes when they die (Heger et al., 2003). The significant presence of CSM both at early and late times, a clear evidence of mass loss, seems in disagreement with this scenario, although recently Chevalier (2008) suggested that there are mass loss mechanisms that do not decline at lower metallicities. Alternatively, the presence of companions can explain strong mass loss by metal poor stars.
In nebular spectra of core-collapse SNe the flux ratio is almost constant with time (Fransson & Chevalier, 1987, 1989). This ratio, only marginally affected by differential reddening, is a useful diagnostic for the mass of the core and consequently for estimating the progenitor mass, with small ratios corresponding to higher main sequence masses. In SN 1987A it was 3 (Elmhamdi, Chugai, & Danziger, 2003), for the faint SN 2005cs it was 4.20.6 (Pastorello et al., 2009), while for SNe 1992H and 1999em we computed the values 1.61 and R4.7, respectively. In comparison, the measured ratio 325 of SN 2007od is very high, suggesting that the progenitor mass is quite small.
A super-asymptotic giant branch (hereafter SAGB) progenitor with a strongly degenerate Ne-O core might explain these observables. As shown by Pumo et al. (2009), the most massive SAGB stars (M Mmas 10 – 11 M⊙) can indeed suffer strong episodes of mass loss while still preserving significant H envelopes ( 5-9 M⊙) at the end of their evolution. In fact, the outcome of SNe from a super-AGB progenitor can differ according to the configuration of the super-AGB star at the moment of the explosion, and may range from a type II SN (either IIP or IIL depending on the mass of the envelope) with relatively low degree of CSM interaction, to a type IIb SN having stronger interaction with the CSM, up to a stripped-envelope SN. The high value of R could be explained also with Fe core collapse SN II in the low limit of the mass range (M11-12); these stars might produce oxygen-poor SN II. But these stars hardly explain the episodes of mass loss at metallicities lower than solar (Woosley, Heger, & Weaver, 2002). Binary companions could easily explain the episodes of mass loss, regardless of the progenitor star. We cannot exclude a priori the binary system solution.
The formation of dust plays a key role in shaping the display of SNe II. In SN 1998S, Pozzo et al. (2004) calculated a value of 10-3 M⊙ of dust in a CDS. Elmhamdi et al. (2003) obtained a lower limit of 10-4M⊙ in the ejecta of SN 1999em from the analysis of the [O I] 6300 Å evolution. For SN 1987A Ercolano, Barlow, & Sugerman (2007) reported a dust mass of 7.510-4 M⊙. For SN 2004et Kotak et al. (2009) estimated a dust mass of M10-4 M⊙ in the CDS, and through hydrodynamical considerations suggested that the mass of new dust produced either in the ejecta or in a CDS never exceeded 10-3 M⊙. The formation of 1.7 to M⊙ of dust (Andrews et al., 2010), contributes to the unusual drop of mag (from plateau to tail) in SN 2007od.
The dust mass estimate can change by an order of magnitude if we consider silicates or carbon grains and if we take into account the possibility of very opaque clouds (Pozzo et al., 2004; Elmhamdi et al., 2003). Indeed, when forming in clumps most of the dust could be undetectable due to the clump opacities, and be in much higher amounts than necessary to produce the observed blackbody emission. We note that the environment of this SN is different from other dust forming SNe that normally explode in spiral galaxies or in regions with solar metallicity. Indeed, the environment metallicity of SN 2007od is between solar and that of galaxies at z6. Thus, one may speculate that larger amounts of dust are formed at high redshift because of low metallicities.
5.1 Explosion and progenitor parameters
We estimated the physical properties of the SN progenitor (namely the ejected mass, the progenitor radius, the explosion energy) by performing a simultaneous fit of the main observables (i.e., bolometric light curve, evolution of line velocities, and continuum temperature at the photosphere) against model calculations, in analogy to the procedure adopted for other SNe (e.g., SNe 1997D, 1999br, 2005cs, Zampieri et al., 2003; Zampieri, 2007).
Two codes were used to produce models: a semi-analytic code (described in detail in Zampieri et al., 2003) which solves the energy balance equation for a spherically symmetric, homologously expanding envelope of constant density, and a new, relativistic, radiation-hydrodynamics code (described in detail in Pumo, Zampieri, & Turatto 2010 and Pumo & Zampieri, submitted). The latter is able to compute the parameters of the ejecta and the emitted luminosity up to the nebular stage by solving the equations of relativistic radiation hydrodynamics in spherically symmetry for a self-gravitating fluid which interacts with radiation, taking into account the heating due to decays of radioactive isotopes synthesized in the SN explosion.
The semi-analytic code was used to perform a preparatory study in order to constrain the parameter space and, consequently, to guide the more realistic but time-consuming simulations performed with the relativistic radiation-hydrodynamics code. We note that modelling with these two codes is appropriate if the emission from the supernova is dominated by the expanding ejecta. For SN 2007od the contamination from interaction and the formation of dust may in part affect the observed properties of the supernova during the first days and from the end of the plateau afterwards. However, there is no evidence that either interaction or dust formation are important during most of the photospheric phase ( days) and hence our hydrodynamic modeling can be safely applied to SN 2007od during this time frame. This is more than sufficient for providing a reliable estimate of the main physical parameters of the ejecta, with the exception of the Ni mass that, as already mentioned, is inferred from late time optical and NIR observations.
The shock breakout epoch (JD ) and distance modulus () adopted in this paper (cfr. Sect. 2.5) are used to fix the explosion epoch and to compute the bolometric luminosity of SN 2007od for comparison with model calculations. Assuming a 56Ni mass of 0.02 M⊙ (see Sect. 2.6), the best fits of the semi-analytic and numerical models are in fair agreement and return values of total (kinetic plus thermal) energy of foe, initial radius of cm, and envelope mass of M⊙ (Fig. 18).
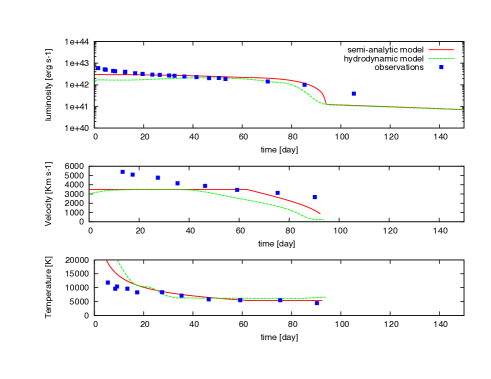
The best-fit models show some difficulty in reproducing the early part of the light curve ( 25 days) and the very end of the apparent plateau (at 106 day). The excess at early epochs may be caused in part by the ejecta-CSM interaction (see discussion in Sect. 5). As for the point at 106 days, the excess may be related to the final interaction stage with the H-rich CSM that occurs at the end of the recombination phase.
In Fig. 18 we show also the evolution of the photospheric velocity and temperature. The agreement between our modeling and the observational data is good apart from, once again, the early phase. The reason for this difference may be due to both interaction and the approximate initial density profile used in our simulations, which may not reproduce correctly the radial profile in the outermost high-velocity shells of the ejecta formed after shock breakout (e.g., Utrobin, 2004, Pumo & Zampieri, in prep.). For this reason, we did not include the first 3 measurements of the line velocity in the fit.
The values of the modeling reported above are consistent with the explosion and mass loss of a SAGB star with an initial (ZAMS) mass Mmas (M to 11.0 M⊙ for the environment metallicity limits of Pumo et al., 2009, cfr. Sect. 5, see also Pumo et al. (2009) for details). The moderate ejecta mass and amount of 56Ni, the relatively low explosion energy, the very large Ca/O ratio, and the presence of C rich dust fit reasonably well within this framework.
Some of these constraints may appear consistent with a fallback supernova from a massive star. In this scenario the mass-cut is located sufficiently far out to trap part of the 56Ni and intermediate mass elements (e.g. O) that fall back onto the compact object. Also the relatively low explosion energy may be related to this mechanism (Fryer, 1999; Zampieri, 2002). However, significant mass loss prior to explosion is not easy to reconcile with a high mass progenitor in a low metallicity environment (see Sect. 5). Problematic are also the moderate amount of 56Ni estimated including MIR data, the relatively high expansion velocity and low ejecta mass, and the C-rich dust (Andrews et al., 2010), since usually these stars produce silicate-rich dust (Kotak et al., 2009, and reference therein).
6 Conclusions
In this paper we present new early– and late–time observations of SN 2007od. The SN is among the brightest type IIP SNe known to date (peak magnitudes M and M) and shows evidence of interaction with CSM both at early and late times. These observations, along with dust formation at late epochs, make this object different from common IIP events.
The light curve of SN 2007od reaches a bright, short plateau lasting 25d at M after a short post-peak decline in which the luminosity decreases by 0.3 mag in a few days. The early hiigh brightness is coupled with a low luminosity tail comparable to that of the faint SNe, e.g. SN 2005cs. The magnitude drop from the plateau to the first available point of the tail is 6 mag, unusually large for a SN IIP. The bolometric light curve tail roughly follows the slope expected for 56Co decay into 56Fe. The 56Ni mass derived from the late-time (UV to K) luminosity is M(Ni)3x10⁻³ M⊙. Late-time (200 to 700d) optical spectroscopy and MIR photometry (after 300d, Andrews et al., 2010) show clear evidence of dust formation. The Ni mass derived including the MIR black-body emission due to dust indicates a much larger M(Ni) M⊙.
The early spectra show the presence of Si II, a boxy H profile, and extreme ( km s-1) HV features of the Balmer lines. The material ejected at high velocity is compatible with a CSM mass of the order of – M⊙ located close to the exploding star. The interaction of the ejecta with a thin, moderately dense CSM might increase the luminosity of the light curves and reduce the duration of the plateau (part of the H envelope of the star is lost and the H mass that recombines is smaller). Finally, the expansion velocity and black-body temperature are comparable to those of type II such as SN 1992H and SN 2004et until the tail.
Late spectra show weaker [O I] than other SNe II, evidence of
ejecta-CSM interaction, and early dust formation. The boxy line
profile of H was interpreted as the interaction of
spherically symmetric SN ejecta expanding in a medium of low average
density, but with dense clumps. A similar configuration was invoked
for SN 1988Z (Chugai & Danziger, 1994), and allows for the early formation of dust
in a CDS inside clumps that eventually become incorporated within the
SN ejecta. Radiative transfer models (Andrews et al., 2010) have provided
estimates of the total dust mass up to M⊙, which
may represent only a lower limit due to its clumpy distribution.
Only at epochs later than 500d, when the light curve flattens, the
interaction might dominate over other sources of energy.
SN 2007od exploded in a LSB galaxy, presumably in a low metallicity environment with log(O/H) . In general, low metallicity stars suffer less mass loss than higher metallicity counterparts, so that it appears likely that the significant mass loss probed by the interactions occurred because the progenitor was a super-AGB star that still preserved H before the final explosion (Pumo et al., 2009). This is compatible with the results of our modeling of the SN observables.
SN 2007od shares many properties with both type IIn and typical type IIP objects. Our analysis has provided indications that: 1) HV features are present also in CC-SNe; 2) early ejecta-CSM interaction can be significant also for SNe IIP; 3) dust formation can occur very early in the SN evolution and affect both the photometric and the spectroscopic behavior significantly; and 4) extended sampling of the SED is essential to describe all phenomena characterizing the CC-SN evolution. The properties of the ”beasts” of the CC-SN zoo do not cease to be amazing.
Acknowledgments
C.I. is grateful to prof. Lucio Paternò for useful advice and suggestions in the earliest stages of his PhD course. C.I. is also grateful to Eddie Baron and David Branch for countless discussions and suggestions, and for hospitality at the University of Oklahoma. The authors thank J. Andrews for providing the late time digital spectra of SN 2007od. The author thank also J. Vinko for the useful suggestions. S.B., F.B., E.C., M.D.V., and M.T. are partially supported by the PRIN-INAF 2009 ”Supernovae Variety and Nucleosynthesis Yields” and by the grant ASI-INAF I/009/10/0. M.L.P. acknowledges the financial support by the Bonino-Pulejo Foundation. The TriGrid VL project, the “consorzio COMETA” and the INAF - Padua Astronomical Observatory are also acknowledged for computer facilities. We thank the support astronomers at the Telescopio Nazionale Galileo, the Copernico Telescope at Cima Ekar, the 2.2m Telescope at Calar Alto, the Nordic Optical Telescope, the New Tecnology Telescope, the Galileo Galilei Telescope on Cima Pennar and the Hale Telescope on Palomar Observatory for performing the follow-up observations of SN 2007od. This research has made use of the NASA/IPAC Extragalactic Database (NED) which is operated by the Jet Propulsion Laboratory, California Institute of Technology, under contract with the National Aeronautics and Space Administration. This research has made use of data obtained from the High Energy Astrophysics Science Archive Research Center (HEASARC), provided by NASA s Goddard Space Flight Center.
References
- Andrews et al. (2010) Andrews J. E., et al., 2010, ApJ, 715, 541
- Andrews et al. (2011) Andrews J. E., et al., 2011, ApJ, 731, 47
- Arnett et al. (1989) Arnett W. D., Bahcall J. N., Kirshner R. P., Woosley S. E., 1989, ARA&A, 27, 629
- Arnett (1996) Arnett W. D., 1996, Supernovae and Nucleosynthesis, Princeton University Press, Princeton
- Balinskaia, Bychkov, & Neizvestnyi (1980) Balinskaia I. S., Bychkov K. V., Neizvestnyi S. I., 1980, A&A, 85, L19
- Barbon, Ciatti, & Rosino (1979) Barbon R., Ciatti F., Rosino L., 1979, A&A, 72, 287
- Baron et al. (2000) Baron E., et al., 2000, ApJ, 545, 444
- Botticella et al. (2009) Botticella M. T., et al., 2009, MNRAS, 398, 1041
- Blondin & Calkins (2007) Blondin S., Calkins M., 2007, CBET, 1119, 1
- Branch et al. (1981) Branch D., Falk S. W., Uomoto A. K., Wills B. J., McCall M. L., Rybski P., 1981, ApJ, 244, 780
- Branch et al. (2000) Branch D., Jeffery D. J., Blaylock M., Hatano K., 2000, PASP, 112, 217
- Cappellaro, Danziger, & Turatto (1995) Cappellaro E., Danziger I. J., Turatto M., 1995, MNRAS, 277, 10
- Cappellaro et al. (1997) Cappellaro E., Mazzali P. A., Benetti S., Danziger I. J., Turatto M., della Valle M., Patat F., 1997, A&A, 328, 203
- Cardelli, Clayton, & Mathis (1989) Cardelli J. A., Clayton G. C., Mathis J. S., 1989, ApJ, 345, 245
- Cernuschi, Marsicano, & Codina (1967) Cernuschi F., Marsicano F., Codina S., 1967, AnAp, 30, 1039
- Clocchiatti et al. (1996) Clocchiatti A., et al., 1996, AJ, 111, 1286
- Chevalier (1982) Chevalier R. A., 1982, ApJ, 258, 790
- Chevalier & Fransson (1994) Chevalier R. A., Fransson C., 1994, ApJ, 420, 268
- Chevalier (2008) Chevalier R. A., 2008, IAUS, 255, 175
- Chugai & Danziger (1994) Chugai N. N., Danziger I. J., 1994, MNRAS, 268, 173
- Chugai, Chevalier, & Utrobin (2007) Chugai N. N., Chevalier R. A., Utrobin V. P., 2007, ApJ, 662, 1136
- Crockett et al. (2008) Crockett, R. M. et al., 2008, ApJ, 672, L99
- de Blok & van der Hulst (1998) de Blok W. J. G., van der Hulst J. M., 1998, A&A, 335, 421
- Dessart & Hillier (2005) Dessart L., Hillier D. J., 2005, A&A, 437, 667
- Dwek, Galliano, & Jones (2007) Dwek E., Galliano F., Jones A. P., 2007, ApJ, 662, 927
- Elmhamdi et al. (2003) Elmhamdi A., et al., 2003, MNRAS, 338, 939
- Elmhamdi, Chugai, & Danziger (2003) Elmhamdi A., Chugai N. N., Danziger I. J., 2003, A&A, 404, 1077
- Ercolano, Barlow, & Sugerman (2007) Ercolano B., Barlow M. J., Sugerman B. E. K., 2007, MNRAS, 375, 753
- Fassia et al. (1998) Fassia A., Meikle W. P. S., Geballe T. R., Walton N. A., Pollacco D. L., Rutten R. G. M., Tinney C., 1998, MNRAS, 299, 150
- Fesen et al. (1999) Fesen R. A., et al., 1999, AJ, 117, 725
- Fox et al. (2009) Fox O., et al., 2009, ApJ, 691, 650
- Fransson & Chevalier (1987) Fransson C., Chevalier R. A., 1987, ApJ, 322, L15
- Fransson & Chevalier (1989) Fransson C., Chevalier R. A., 1989, ApJ, 343, 323
- Fryer (1999) Fryer C. L., 1999, ApJ, 522, 41
- Gerardy et al. (2000) Gerardy C. L., Fesen R. A., Höflich P., Wheeler J. C., 2000, AJ, 119, 2968
- Gerardy et al. (2002) Gerardy C. L., et al., 2002, ApJ, 575, 1007
- Hamuy (2003) Hamuy M., 2003, ApJ, 582, 905
- Harutyunyan et al. (2008) Harutyunyan A. H., et al., 2008, A&A, 488, 383
- Heger et al. (2003) Heger A., Fryer C. L., Woosley S. E., Langer N., Hartmann D. H., 2003, ApJ, 591, 288
- Hoyle & Wickramasinghe (1970) Hoyle F., Wickramasinghe N. C., 1970, Natur, 226, 62
- Immler & Brown (2007) Immler S., Brown P. J., 2007, ATel, 1259, 1
- Inserra, Baron et al. (in preparation) Inserra C., Baron E., et al, in preparation
- Jeffery & Branch (1990) Jeffery D. J., Branch D., 1990, sjws.conf, 149
- Kasen & Woosley (2009) Kasen D., Woosley S. E., 2009, ApJ, 703, 2205
- Kotak et al. (2005) Kotak R., Meikle P., van Dyk S. D., Höflich P. A., Mattila S., 2005, ApJ, 628, L123
- Kotak et al. (2009) Kotak R., et al., 2009, ApJ, 704, 306
- Kozasa, Hasegawa, & Nomoto (1991) Kozasa T., Hasegawa H., Nomoto K., 1991, A&A, 249, 474
- Landolt (1992) Landolt A. U., 1992, AJ, 104, 340
- Li et al. (2006) Li W., Jha S., Filippenko A. V., Bloom J. S., Pooley D., Foley R. J., Perley D. A., 2006, PASP, 118, 37
- Lucy et al. (1989) Lucy L. B., Danziger I. J., Gouiffes C., Bouchet P., 1989, LNP, 350, 164
- Lucy et al. (1991) Lucy E. et al.,1991, in Supernovae, ed. S.E. Woosley, Springer-Verlag, New York, p.82
- Maguire et al. (2010) Maguire K., et al., 2010, MNRAS, 284
- Mattila et al. (2008) Mattila S., et al., 2008, MNRAS, 389,141
- McGaugh (1994) McGaugh S. S., 1994, ApJ, 426,135
- Meikle et al. (2007) Meikle W. P. S., et al., 2007, ApJ, 665, 608
- Meikle et al. (2011) Meikle P., et al., 2011, arXiv, arXiv:1103.2885
- Mikuz & Maticic (2007) Mikuz H., Maticic S., 2007, CBET, 1116, 1
- Mould et al. (2000) Mould J. R., et al., 2000, ApJ, 529, 786
- Moriya et al. (2010) Moriya T., Tominaga N., Blinnikov S. I., Baklanov P. V., Sorokina E. I., 2010, arXiv, arXiv:1009.5799
- Nozawa et al. (2003) Nozawa T., Kozasa T., Umeda H., Maeda K., Nomoto K., 2003, ApJ, 598, 785
- Pastorello (2003) Pastorello A., 2003, PhD. thesis, Univ.Padova
- Pastorello et al. (2004) Pastorello A., et al., 2004, MNRAS, 347, 74
- Pastorello et al. (2006) Pastorello A., et al., 2006, MNRAS, 370, 1752
- Pastorello et al. (2009) Pastorello A., et al., 2009, MNRAS, 394, 2266
- Patat et al. (1994) Patat F., Barbon R., Cappellaro E., Turatto M., 1994, A&A, 282, 731
- Poole et al. (2008) Poole T. S., et al., 2008, MNRAS, 383, 627
- Pooley et al. (2002) Pooley D., et al., 2002, ApJ, 572, 932
- Pozzo et al. (2004) Pozzo M., Meikle W. P. S., Fassia A., Geballe T., Lundqvist P., Chugai N. N., Sollerman J., 2004, MNRAS, 352, 457
- Pozzo et al. (2006) Pozzo M., et al., 2006, MNRAS, 368, 1169
- Richardson et al. (2002) Richardson D., Branch D., Casebeer D., Millard J., Thomas R. C., Baron E., 2002, AJ, 123, 745
- Pumo et al. (2009) Pumo M. L., et al., 2009, ApJ, 705, L138
- Pumo, Zampieri, & Turatto (2010) Pumo M. L., Zampieri L., Turatto M., 2010, MSAIS, 14, 123
- Schmidt et al. (1993) Schmidt B. P., et al., 1993, AJ, 105, 2236
- Schlegel (1990) Schlegel E. M., 1990, MNRAS, 244, 269
- Schlegel, Finkbeiner, & Davis (1998) Schlegel D. J., Finkbeiner D. P., Davis M., 1998, ApJ, 500, 525
- Smartt et al. (2009) Smartt S. J., Eldridge J. J., Crockett R. M., Maund J. R., 2009, MNRAS, 395, 1409
- Smith et al. (2011) Smith N., Li W., Filippenko A. V., Chornock R., 2011, MNRAS, 412, 1522
- Smoker, Axon, & Davies (1999) Smoker J. V., Axon D. J., Davies R. D., 1999, A&A, 341, 725
- Smoker et al. (2000) Smoker J. V., Davies R. D., Axon D. J., Hummel E., 2000, A&A, 361, 19
- Spyromilio & Leibundgut (1996) Spyromilio J., Leibundgut B., 1996, MNRAS, 283, 89
- Spyromilio, Leibundgut, & Gilmozzi (2001) Spyromilio J., Leibundgut B., Gilmozzi R., 2001, A&A, 376, 188
- Suntzeff & Bouchet (1990) Suntzeff N. B., Bouchet P., 1990, AJ, 99, 650
- Szalai et al. (2011) Szalai T., Vinkó J., Balog Z., Gáspár A., Block M., Kiss L. L., 2011, A&A, 527, A61
- Todini & Ferrara (2001) Todini P., Ferrara A., 2001, MNRAS, 325, 726
- Turatto et al. (1990) Turatto M., Cappellaro E., Barbon R., della Valle M., Ortolani S., Rosino L., 1990, AJ, 100, 771
- Turatto, Benetti, & Cappellaro (2003) Turatto M., Benetti S., Cappellaro E., 2003, fthp.conf, 200
- Tully (1988) Tully R. B., 1988, Nearby Galaxies Catalogue, Cambridge University Press, Cambridge and New York, p.221
- Zampieri (2002) Zampieri, L. 2002, Recent developments in general relativity. 14th SIGRAV Conference on General Relativity and Gravitational Physics, edited by R. Cianci, R. Collina, M. Francaviglia, P. Frè. Milano: Springer.
- Zampieri et al. (2003) Zampieri L., Pastorello A., Turatto M., Cappellaro E., Benetti S., Altavilla G., Mazzali P., Hamuy M., 2003, MNRAS, 338, 711
- Zampieri (2007) Zampieri L., 2007, AIPC, 924, 358
- Utrobin (2004) Utrobin V. P., 2004, AstL, 30, 293
- Welch et al. (2007) Welch, D. L., Clayton, G. C., Campbell, A., Barlow, M. J., Sugerman, B. E. K., Meixner, M., & Bank, S. H. R. 2007, ApJ, 669, 525
- Woosley, Hartmann, & Pinto (1989) Woosley S. E., Hartmann D., Pinto P. A., 1989, ApJ, 346, 395
- Woosley, Heger, & Weaver (2002) Woosley S. E., Heger A., Weaver T. A., 2002, RvMP, 74, 1015