Candidate X-ray-Emitting OB Stars in the Carina Nebula Identified Via Infrared Spectral Energy Distributions
Abstract
We report the results of a new survey of massive, OB stars throughout the Carina Nebula using the X-ray point source catalog provided by the Chandra Carina Complex Project (CCCP) in conjunction with infrared (IR) photometry from the Two Micron All-Sky Survey and the Spitzer Space Telescope Vela–Carina survey. Mid-IR photometry is relatively unaffected by extinction, hence it provides strong constraints on the luminosities of OB stars, assuming that their association with the Carina Nebula, and hence their distance, is confirmed. We fit model stellar atmospheres to the optical () and IR spectral energy distributions (SEDs) of 182 OB stars with known spectral types and measure the bolometric luminosity and extinction for each star. We find that the extinction law measured toward the OB stars has two components: –1.5 mag produced by foreground dust with a ratio of total-to-selective absorption plus a contribution from local dust with in the Carina molecular clouds that increases as increases. Using X-ray emission as a strong indicator of association with Carina, we identify 94 candidate OB stars with L☉ by fitting their IR SEDs. If the candidate OB stars are eventually confirmed by follow-up spectroscopic observations, the number of cataloged OB stars in the Carina Nebula will increase by . Correcting for incompleteness due to OB stars falling below the cutoff or the CCCP detection limit, these results potentially double the size of the young massive stellar population.
Subject headings:
infrared: stars — ISM: individual (NGC 3372) — methods: data analysis — stars: early-type — X-rays: stars1. Introduction
The Great Nebula in Carina (NGC 3372) hosts 200 known OB stars (Smith, 2006a; Gagné et al., 2011, hereafter G11), the largest collection of young massive stars within 3 kpc of the Sun. This population includes some of the most massive stars ever discovered, including the famous Luminous Blue Variable Carinae (Davidson & Humphreys, 1997). The 2.3 kpc distance to the Carina Nebula has been measured accurately from the expansion of the Homunculus Nebula produced by Car (Allen & Hillier, 1993; Smith, 2006b), and the principal ionizing star clusters, Trumpler (Tr) 16 and Tr 14, suffer relatively low dust extinction ( mag; DeGioia-Eastwood et al., 2001; Ascenso et al., 2007; Preibisch et al., 2011). Carina therefore offers unique observational advantages for multiwavelength studies of a well-resolved population of massive stars, providing a large sample of young OB stars in a single giant molecular cloud complex.
There is reason to suspect that significant numbers of massive stars have yet to be cataloged in Carina. The Carina Nebula extends across the sky, hence spatially unbiased observations of the entire complex are challenging. While there are relatively few bright infrared (IR) sources consistent with embedded massive stars (Rathborne et al., 2004; Smith & Brooks, 2007), OB stars that have shed their natal envelopes could be hiding in regions of higher extinction: behind molecular cloud fragments (Yonekura et al., 2005), in the dark, V-shaped dust lane south of Tr 16 seen in visible-light images (Smith & Brooks, 2007), or intermingled with embedded YSOs in regions of active star formation such as the South Pillars (Megeath et al., 1996; Rathborne et al., 2004; Smith et al., 2010; Povich et al., 2011, hereafter P11). New surveys from the Chandra X-ray Observatory and the Spitzer Space Telescope offer wide-field views encompassing the bulk of the young stellar population in Carina. Compared to the optical studies historically used to catalog OB stars in Carina, X-ray and IR observations are much less affected by extinction. These surveys provide an opportunity to carry out a comprehensive search for OB stars.
In this paper, we present the results of a survey of candidate OB stars throughout the Carina Nebula. In the process, we further develop the spectral energy distribution (SED) fitting method pioneered by Watson et al. (2008) to identify candidate massive stars and constrain their properties. In §2 we briefly summarize the observations and basic data analysis. We describe our SED fitting methodology and apply it to a “validation sample” of Carina OB stars with known spectral types in §3. In §4 we extend the SED fitting method to identify a sample of candidate X-ray-emitting OB stars. We discuss and summarize our results in §5.
2. Observations and Basic Data Analysis
We used data products from the Chandra Carina Complex Project (CCCP; Townsley et al., 2011a), Two-Micron All Sky Survey (2MASS; Skrutskie et al., 2006), and the Spitzer Vela–Carina Survey (PI S. R. Majewski), as described in P11. P11 constructed a catalog of young stellar objects (YSOs) identified on the basis of IR excess emission in the Vela–Carina Point Source Catalog; as a first step, SED fitting was used to filter out 50,586 of 54,155 sources in the CCCP survey area, those that were consistent with stellar photospheres reddened by interstellar dust alone (no IR excess emission from circumstellar dust). This large sample of stars without IR excess, discarded from the analysis of P11, forms the basis of our current study. We use the -minimization SED fitting tool of Robitaille et al. (2007), which applies interstellar reddening directly to the stellar atmosphere models (Castelli & Kurucz, 2004) before fitting them to the data, hence incorporating the optical extinction as a free parameter. The fitting tool can accept any extinction law, defined as opacity as a function of wavelength. We employed a Cardelli et al. (1989) extinction law, characterized by the ratio of total to selective absorption , for the optical–ultraviolet (UV) part of the spectrum and the Indebetouw et al. (2005) extinction law in the IR.
P11 also identified stars with “marginal” IR excesses in the 5.8 or 8.0 m bands of the Spitzer Infrared Array Camera (IRAC; Fazio et al., 2004) and discarded them as unreliable YSO candidates. The SEDs of these sources are well-fit by stellar atmosphere models (see P11 for the definition of “well-fit”) when the IR photometric band(s) affected by potential excess are excluded from the SED fitting procedure. We incorporated these marginal excess stars into the present study, suppressing fitting to the band(s) affected by apparent excess emission.
Compared to traditional photometric analysis techniques using combinations of color-color and color-magnitude diagrams, the SED fitting approach offers the considerable advantage of analyzing all available photometric data simultaneously (Maíz-Apellániz, 2004). By analyzing the sets of models that fit up to photometric datapoints spanning the optical (), near-IR (2MASS ), and mid-IR (IRAC) spectrum, we can probe interrelationships of various physical parameters, such as extinction and luminosity, and test which wavelengths are most important for constraining a given parameter. We define the set of well-fit models for each source as , where and are the goodness-of fit parameters for the th and best-fit models, respectively and is the number of photometric datapoints available for each source (Povich et al., 2009, P11). This criterion is deliberately liberal, typically returning well-fit stellar atmosphere models to each source to explore the full range of potential parameter space. Another benefit of the SED fitting approach is a decreased dependence of the fitting results on any single photometry band; the impact of measurement uncertainties affecting specific bands is reduced by the inclusion of more data.
3. Validation Sample: Spectroscopically Confirmed OB Stars
G11 compiled a catalog of 200 OB stars in Carina with spectral types known from spectroscopy (e.g., Skiff, 2009, and references therein) and available photometry. In this catalog, 182 stars have 2MASS+IRAC photometry in the Vela–Carina Point-Source Archive of sufficient quality for our SED analysis, meaning the sources showed no significant variability111The epochs of the 2MASS and Vela–Carina observations were separated by years. and were not saturated, confused, or swamped by nebular emission. These 182 stars form the validation sample (Table 1) for our SED fitting method. We were able to fit the full SED from to 8.0 m in the majority of cases. Because the photometry was obtained from various sources, many of which did not publish photometric uncertainties, we conservatively set the uncertainties on the optical flux densities to 20% ( mag) for the SED fitting (the 2MASS and IRAC photometry constitute a homogeneous dataset, and we used an uncertainty floor of 10% for the IR datapoints, see P11). The SEDs of stars undetected at 8 m or exhibiting marginal IR excesses can generally be fit well with stellar atmosphere models for m.
Among the validation sample, 22 stars show excess emission in one or more IRAC bands. This is not necessarily evidence for circumstellar disks; the apparent excess could instead be due to (1) systematic photometric errors (Povich et al., 2009), (2) dust trapped near the star in a bow shock or remnant envelope222Some of the “extended red objects” identified by Smith et al. (2010) fall into this category. (Povich et al., 2008), or (3) confusion with a lower-mass star with its own IR excess. In all cases except (1) this excess emission is astrophysically interesting and may be correlated with the youngest OB stars, so we note sources with potential IR excess in column (14) of Table 1.
3.1. Luminosity and Extinction Derived from SED Fitting
In general, hundreds of different atmosphere models can be fit to a given SED, spanning a wide range in stellar effective temperature . This is due to a degeneracy between and that can be resolved with additional information. Using the known spectral types (ST) for the 182 stars in the validation sample (G11), we assigned (ST) using the calibrations of versus spectral type from Martins et al. (2005) for O stars and the extrapolation provided by Crowther (2005) for early B stars. With the parameter (ST) fixed, the bolometric luminosity and extinction become uniquely determined.
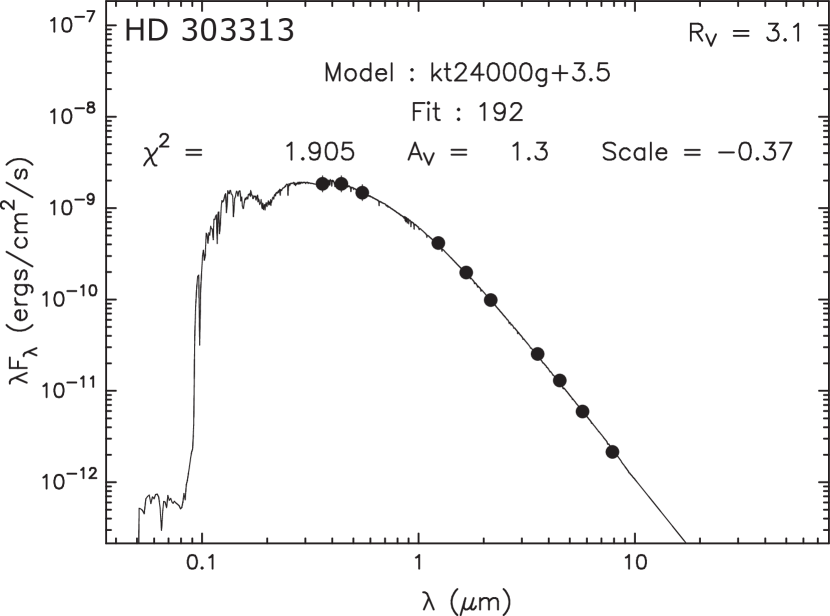
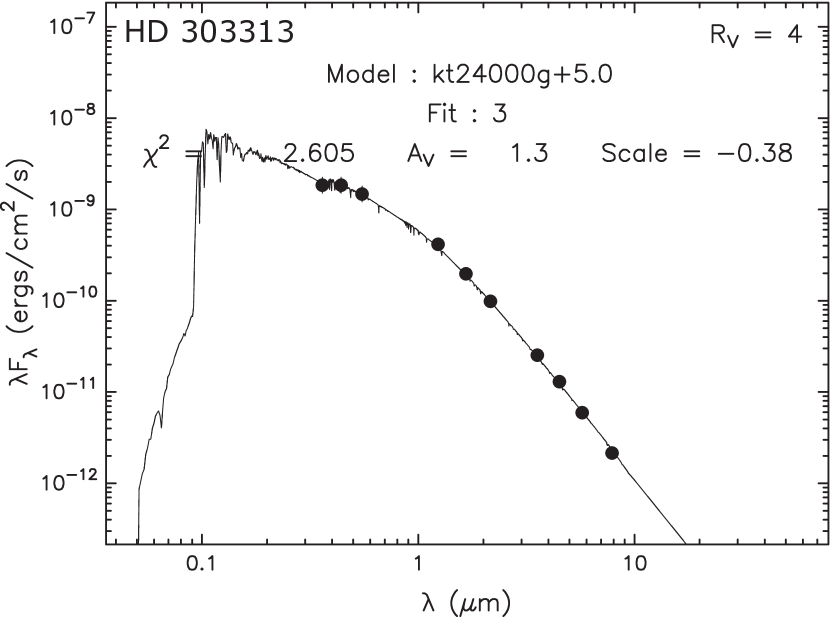
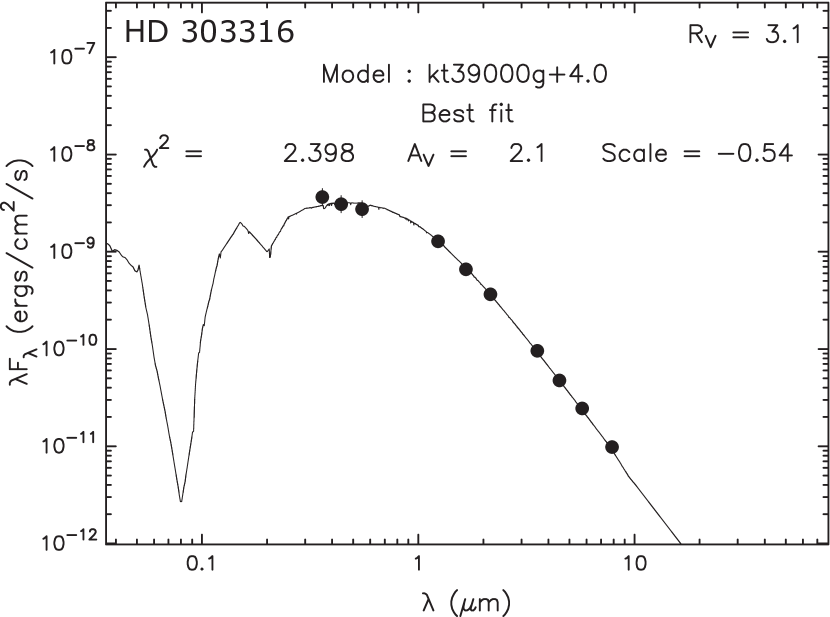
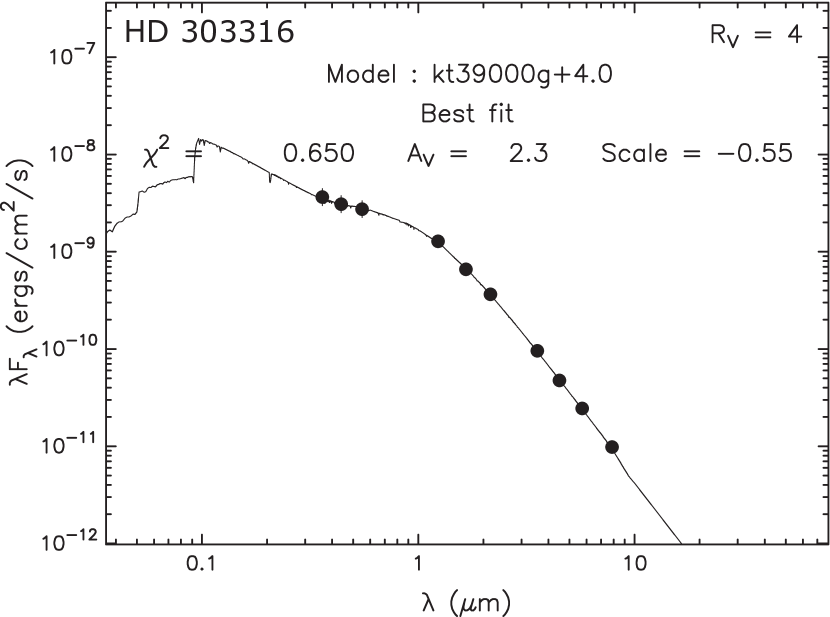
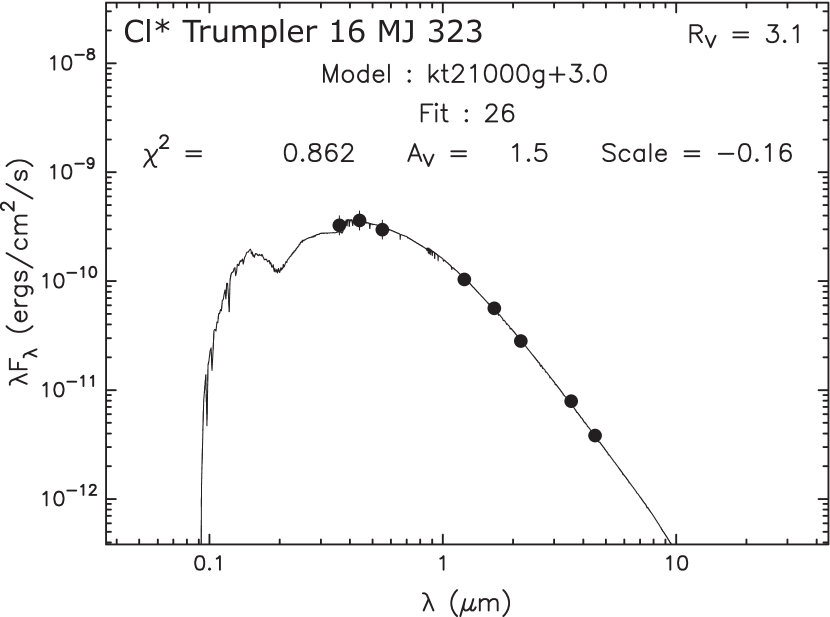
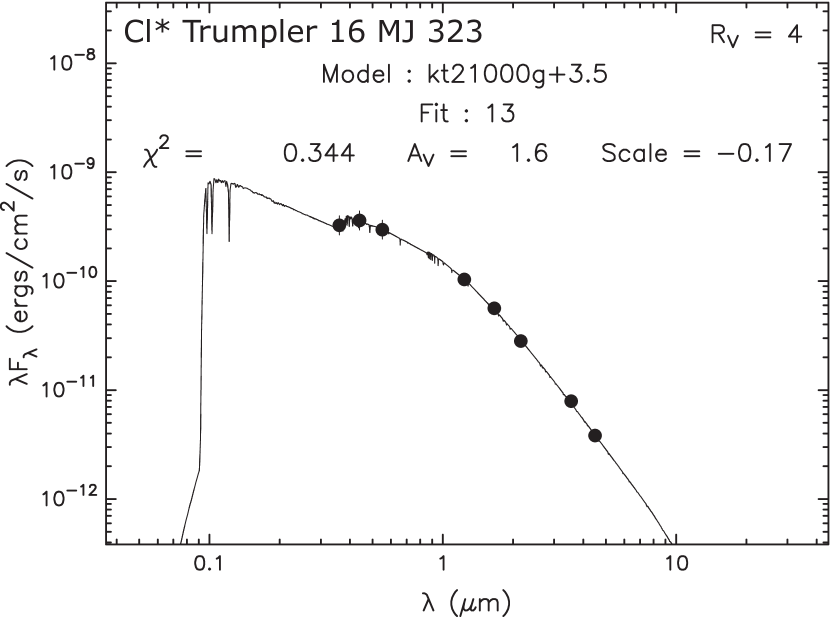
We then chose SED fits corresponding to that temperature for subsequent analysis. Example plots of ATLAS9 stellar atmospheres (Castelli & Kurucz, 2004) fit to the SEDs of 3 validation stars are given in Figure 1, for 2 different extinction laws (see §3.3 below). In each plot, a single example from the family of well-fit model atmospheres is shown, chosen to show a model that matches (ST) for each star (G11): HD 303313 (B1.5 V, 24,000 K), HD 303316 (O6 V, 39,000 K), and Cl* Trumpler 16 MJ 323 (Tr16-18; B2 V, 21,000 K). In addition to temperature, each model atmosphere is specified by surface gravity and metallicity. The metallicity parameter was ignored in our analysis, since it primarily affects spectral lines and has negligible impact on the SED shapes. The impact of surface gravity and the choice of stellar atmosphere models on the SED shapes is discussed in §3.2 below.
Information about the SED fitting results is shown in each panel of Figure 1. The goodness-of-fit parameter is used simply as a binary discriminator separating well-fit from poorly-fit models (see P11 for details). Assuming kpc, the geometrical scale factor, defined as , gives the stellar radius , which can be converted straightforwardly to as a function of . With fixed, the parameter strongly influences the SED shape. The effect of the assumed extinction law is thus apparent in Figure 1: produces better results for the least-reddened example star, HD 303313 ( mag), in terms of both the visual agreement between the model and the data and the of the fits; while conversely works better for the most-reddened star, HD 303316 ( mag). Cl* Trumpler 16 MJ 323 represents an intermediate case with , where the visual quality of the fits is similar between the two extinction laws, but marginally favors .
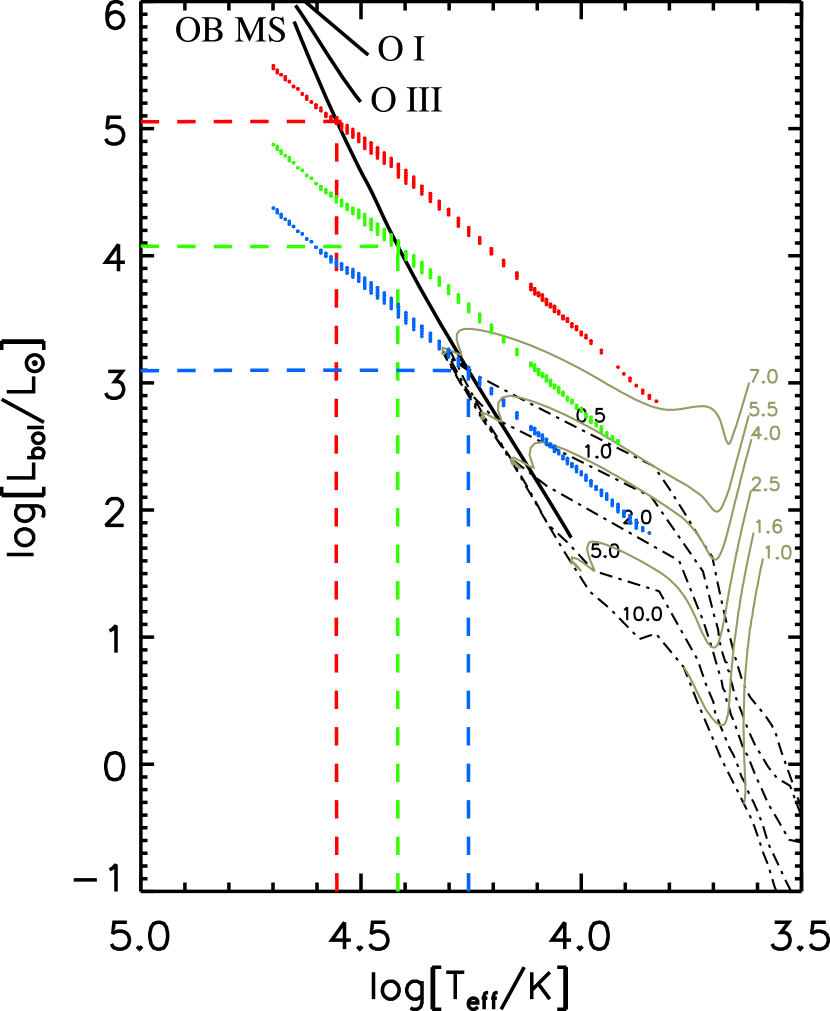
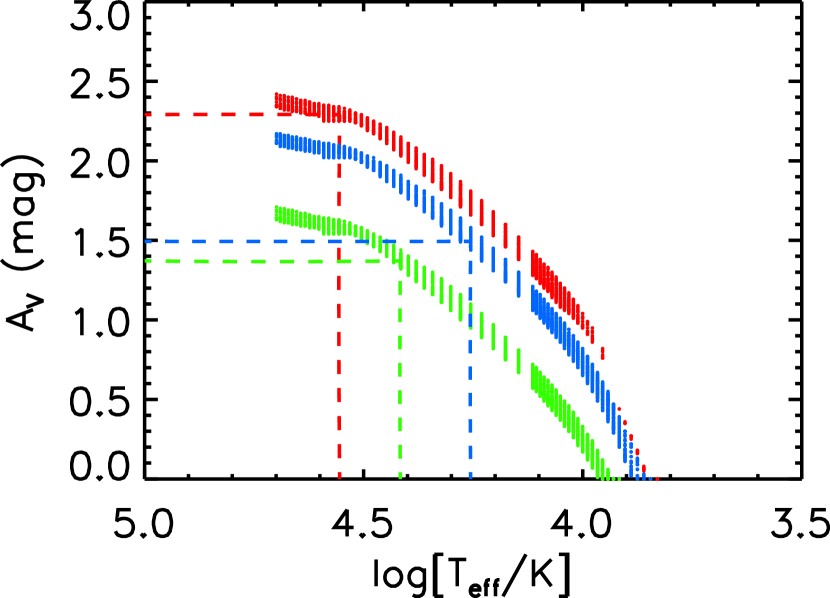
In a traditional photometric study, all stars are plotted simultaneously on a color-magnitude diagram; age, luminosity, and reddening are inferred for the ensemble by comparing loci of stars with the positions of reddening vectors, theoretical isochrones, and/or evolutionary tracks. The SED fitting method enables us to turn this approach around, instead projecting the 3-dimensional locus of the family of well-fit model parameters () for each star onto a theoretical Hertzsprung-Russell (H-R) diagram (Figure 2, top). Models placing a star to the left of the theoretical main sequence (MS; as defined by Martins et al. 2005 for O stars, Crowther 2005 for early B stars, and de Jager & Nieuwenhuijzen 1987 for late B stars) can be discarded as unphysical. A companion plot of against (Figure 2, bottom) represents a second plane in the 3-D parameter space and illustrates the degeneracy between higher extinction and higher temperature. Since the maximum allowed corresponds to the MS, the maximum corresponds to . If (ST) is known from spectroscopy, then and can always be determined uniquely. Values of and (SED) for all 182 stars in the validation sample are reported in columns (4) and (5) of Table 1; these parameter values were computed for each star by slicing the locus of model fits at the adopted spectral type temperature, (ST) in column (3), and taking the mean along both the and dimensions.
CCCP, the Vela–Carina Survey, and 2MASS provide homogeneous X-ray and IR coverage spanning the Carina Nebula, but unfortunately no single complementary dataset exists that gives high-quality optical photometry for the entire CCCP survey area. photometry for the validation sample was compiled from heterogeneous sources in the literature by G11. It is not feasible to incorporate optical photometry into an unbiased search for massive stars throughout Carina, some of which could be highly obscured at optical wavelengths. We therefore fit the SEDs of the stars in the validation sample a second time, discarding the photometry, to test how well SEDs from IR photometry alone constrain the derived physical properties.
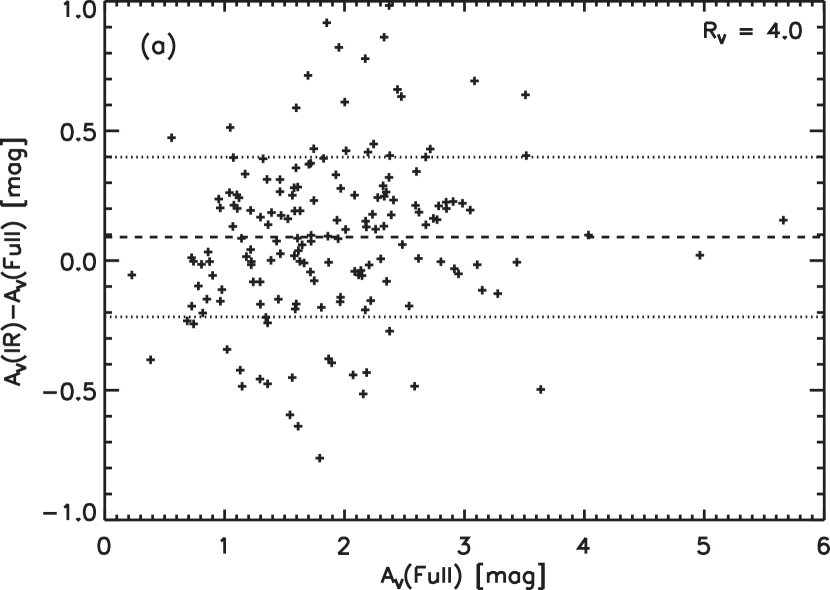
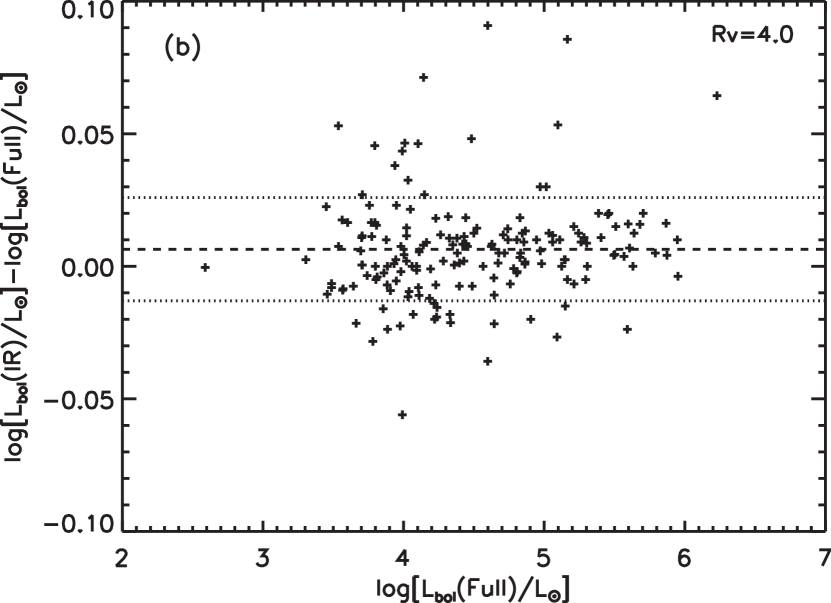
In Figure 3 we plot the differences in (SED) and produced by comparing the results from fitting only the IR portions of the SEDs to the results from fitting the full optical+IR SEDs for all 182 stars in the validation sample. The scatter in is mag (Figure 3a). The mean offset of mag is not significant, given the scatter. The scatter in is dex (note the axis scale in Figure 3b), hence the values derived from fitting only the IR portion of the SED generally reproduce the full SED results to within 5%. Since extinction in the IR is negligible in comparison to visible light, the IR SED sets the overall scaling of the spectrum, determining . Optical photometry then provides a direct measure of (assuming is known, see Figure 2). The majority of stars in the validation sample have mag (Table 1 and Figure 3a), or mag (Cardelli et al., 1989), and it is not surprising that the IR SEDs alone do not tightly constrain , given the conservative estimates of photometric uncertainty used in the SED fitting. For more highly-obscured stars, extinction becomes significant in the near-IR, and photometry should provide more robust measurements.
3.2. Systematics Due to the Choice of Model Atmospheres
One potentially important source of systematic errors in this analysis is the choice of stellar atmosphere models. The ATLAS9 atmospheres (Castelli & Kurucz, 2004) were chosen for convenience, as they come packaged with the Robitaille et al. (2007) fitting tool. These atmospheres are completely static and assume local thermodynamic equilibrium (LTE), therefore they are not strictly appropriate for hot stars, in particular hot stars with strong winds. In the static atmosphere case, spectral shapes are not significantly affected by the inclusion of non-LTE effects, and LTE atmospheres are adequate for the analysis of low-resolution spectra or SEDs (Lanz & Hubeny, 2003). However, O-star parameters computed using fully line-blanketed, non-LTE expanding atmospheres show significant changes in the calibration of and surface gravity () versus spectral type compared with static models, and these effects are, not surprisingly, most pronounced for stars with the strongest winds (Martins et al., 2005). Surface gravities for the hottest atmospheres in the ATLAS9 model grid range from to 5.0, systematically high compared to the Martins et al. (2005) calibrations for O dwarfs () and especially O supergiants ( to 3.7).
To quantify the systematic errors introduced into the SED fitting results by the adoption of the ATLAS9 atmospheres, we compared publicly-available CMFGEN model spectra (Hillier & Miller, 1998) to the nearest ATLAS9 spectra in parameter space. In our comparisons, we normalized pairs of test spectra to unity (equal ) and then computed the fractional difference in flux density between the CMFGEN and ATLAS9 models in each optical and IR bandpass used for SED fitting. A qualitative trend readily emerged, in which the CMFGEN models compared to the ATLAS9 models predict similar flux density in but higher flux density in the IR balanced by lower flux density in the far-UV. This redistribution of flux from the far-UV to the IR is attributable to free-free emission in the stellar winds. Our SED fitting analysis, which effectively scales the ATLAS9 models to the IR SED, may therefore overestimate , compensating by overestimating . We define the magnitude of the systematic error predicted by these comparisons as
which varies strongly with stellar surface gravity. We evaluated four “test cases” based on CMFGEN models spanning the full range of stellar properties among the validation sample and summarize the results in Table 2. While for the OB supergiants, the majority of stars in the validation sample are late O and early B dwarfs and giants with , and the mean for the entire validation sample is .
| CMFGEN | ||||||
|---|---|---|---|---|---|---|
| Test Case | (kK) | (cm s-2) | (%) | (dex) | (mag) | |
| O2–O6.5 I/II | 1 | 42.5 | 3.75 | 28 | 0.12 | 0.26 |
| O7–B I/II | 20 | 30.0 | 3.25 | 19 | 0.08 | 0.19 |
| O3–O6.5 V/III | 20 | 42.5 | 4.00 | 14 | 0.06 | 0.14 |
| O7–O9.5 V/III | 39 | 30.0 | 4.00 | 5 | 0.02 | 0.05 |
Note. — is the number of stars in the validation sample corresponding to each test case, based on their spectral types and luminosity class (G11). The systematic errors expected for the 102 B stars (excluding supergiants) are negligibly small. The first three rows constitute the set of 41 low- stars highlighted in Figures 4–6.
In Figure 4, we plot luminosity derived from color excess and bolometric corrections based on CMFGEN models (Martins et al., 2005, G11) against luminosity from visible+IR SED fitting with the ATLAS9 atmospheres, for 181 validation stars in Table 1.333Tr16-74 lacks a measurement in and was excluded. Assuming typical random errors in photometry of mag (Massey & Johnson, 1993), the random uncertainties on the luminosities plotted in Figure 4 are smaller than the plotting symbol sizes. There is generally good agreement between the two methods, although deviations from the 1–1 relation that are greater than expected due to random photometric errors are observed. In particular, the distribution of OB supergiants and early O stars (the “low-” stars; first 3 rows of Table 2) is displaced toward higher values of , as expected from the maximum model-based systematic errors (dashed line in Figure 4), but we stress that the average systematic error (dotted line) not significant. The scatter apparent in Figure 4 about the 1–1 relation among the late O and B dwarfs and giants (the “high-” stars) is not due to our choice of model atmospheres and instead reflects variations in the extinction law, which impact far more strongly than , as discussed in the following subsection (§3.3).
Ideally, we would use the WM-basic (Pauldrach et al., 2001) or CMFGEN (Hillier & Miller, 1998) non-LTE, expanding atmosphere models for O stars. In a future upgrade to the SED-fitting method we will incorporate an appropriate grid of models into the Robitaille et al. (2007) fitting tool, but after accounting for the potential systematics, our adoption of ATLAS9 atmospheres is not expected to introduce significant errors in the results of the present work. It is critical, however, to use the latest models to obtain bolometric corrections as a function of spectral type, or for our purposes, to assign the appropriate (ST) to the stars in the validation sample (Table 1).
3.3. An “Anomalous” Extinction Law in the Carina Molecular Cloud
Herbst (1976) suggested that the extinction law toward the stellar population of the Carina Nebula was best represented by a ratio of total-to-selective extinction , significantly higher than the normal diffuse interstellar medium (ISM) value of . This claim of “anomalous” extinction was challenged by Turner & Moffat (1980), who measured , consistent with the normal ISM value. Massey & Johnson (1993) found among their sample of massive stars in Tr 16 and Tr 14, equivalent to –3.2 and yielding a spectroscopic distance modulus of or kpc, in significant disagreement with the now well-established distance of kpc (Smith, 2006b). Walborn (1995) pointed out that adopting would lower the spectroscopic distance modulus and bring it into agreement with the geometric distance. Motivated by this historical debate, we performed our SED fitting analysis on the validation sample twice, using extinction laws characterized by and , to evaluate which choice better represents the average extinction law observed toward the known massive stars in Carina.
Measurement of for a single star from photometry, hereafter denoted , depends on an accurate , which in turn is based on knowledge of and a bolometric correction (G11). As we demonstrated in §3.1 above, fitting the full optical through IR SED separates the problem, providing a measure of from the IR that is generally independent of the optical photometry. The result is an improved determination of that is also less sensitive to the adopted extinction law. If the actual extinction law is characterized by , then assuming will yield measurements of that are systematically underestimated by 22.5%. We find empirically from the SED fitting results that (SED) only increases by 6% when an extinction law characterized by is adopted in place of the default extinction law characterized by (Cardelli et al., 1989; Indebetouw et al., 2005). Because the impact of the extinction law is different for the two methods, the preferred average value of is the one that maximizes agreement between and .
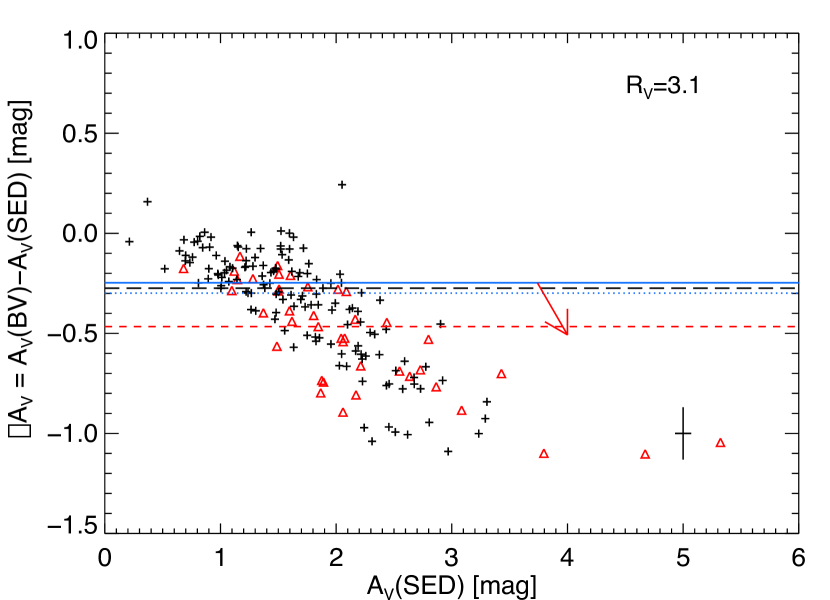
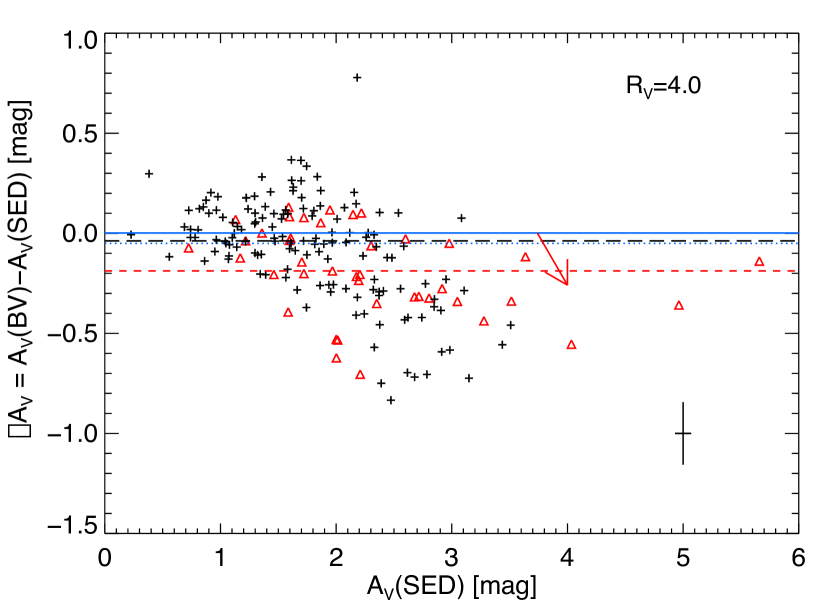
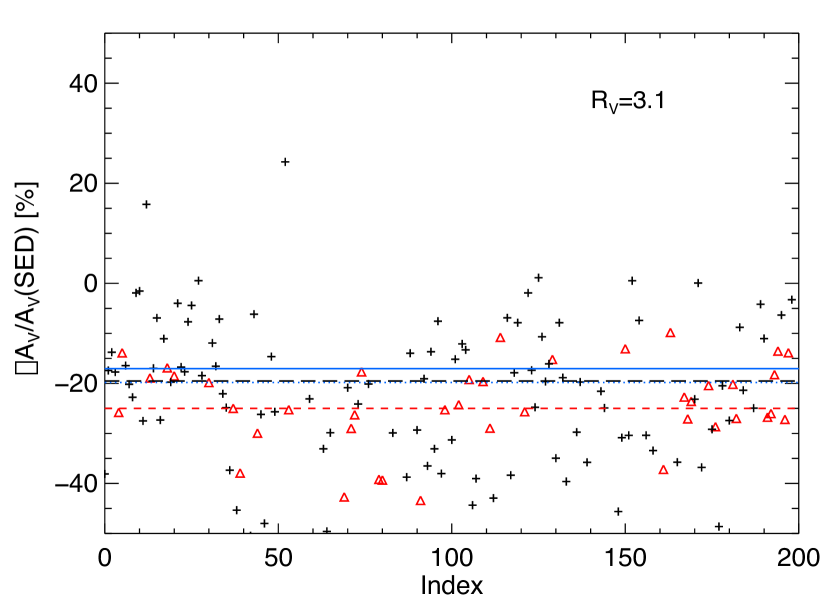
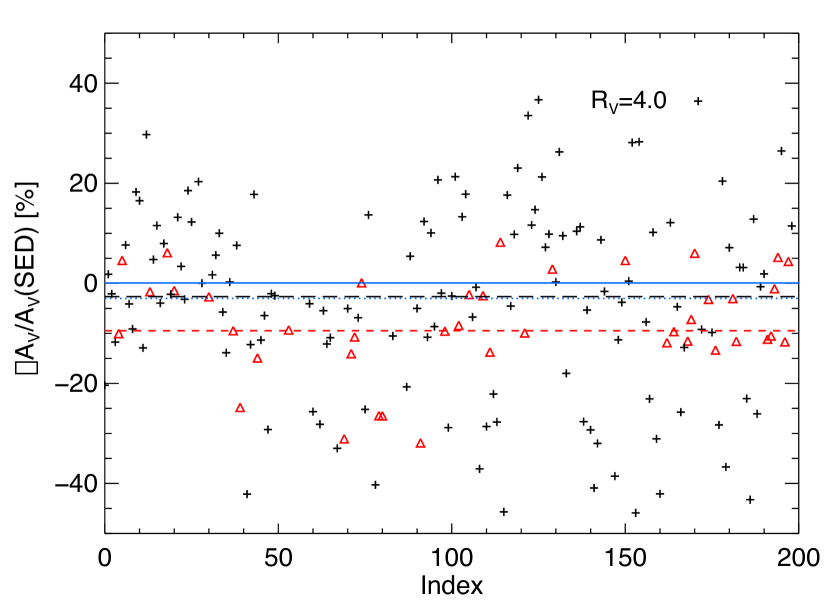
We computed (SED) for 181 stars in the validation sample using both extinction laws, and (Figure 5). In the top-left panel, it is apparent that is consistent with zero only for lightly-reddened stars with mag, while there is a trend toward negative with increasing . This suggests that is systematically underestimated using . We note that the effect of the model-based systematic error in the SED fitting trends in a similar direction (arrow), but this error applies only to the 41 low- stars, and indeed it can be seen that the apparent trend of the low- stars is simply the high- trend transformed by the expected systematics. In the bottom-left panel, the median for , corrected for the expected average systematic error (§3.2), as expected if the actual average extinction law were better characterized by . Adopting (Figure 5, right panels) brings the corrected median to zero. We therefore conclude that while is appropriate for the least-obscured stars in Carina, the average extinction law for the validation sample is better characterized by .
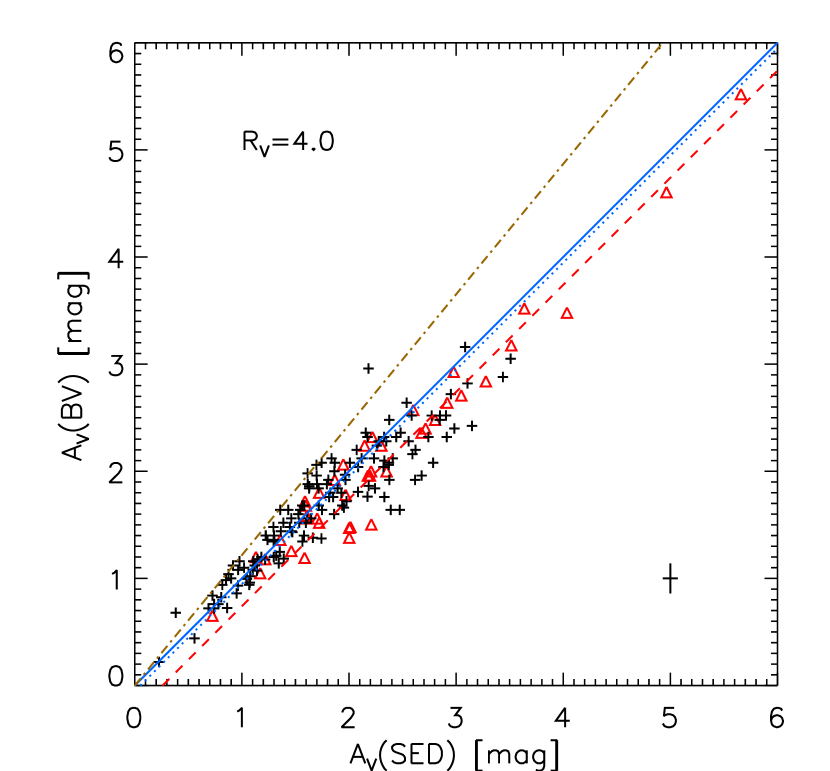
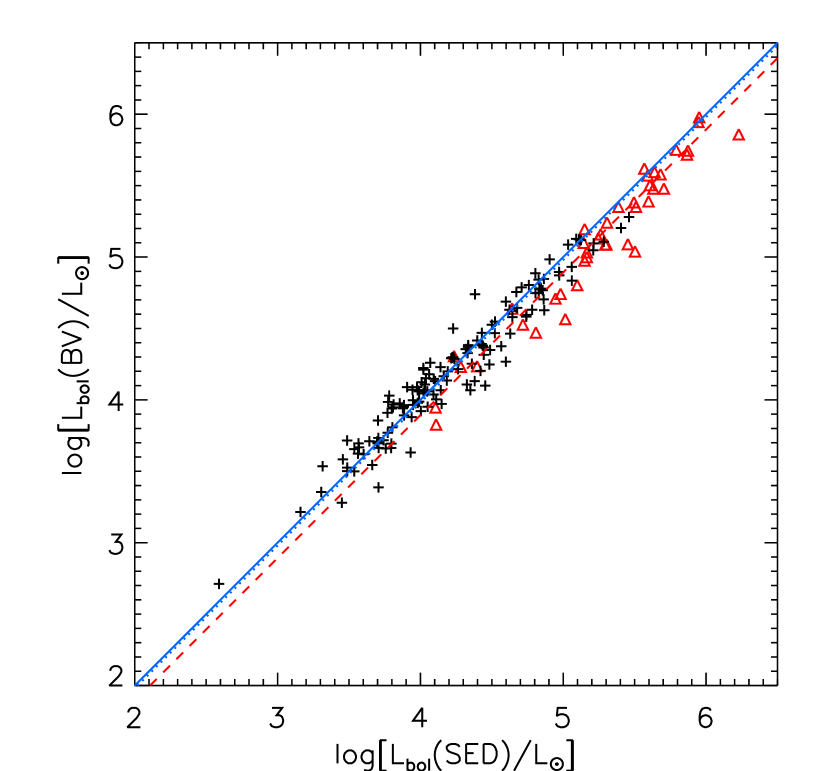
We subsequently adopt an extinction law characterized by (Cardelli et al., 1989), since we are primarily interested in the global properties of the massive stellar population rather than the detailed properties of individual OB stars. The comparison of versus using for 181 stars in the validation sample (Table 1) is plotted in Figure 6. As in Figure 4, the data agree with a 1–1 relation, although there is significant scatter due both to random (photometric) uncertainties and systematic effects. Also plotted is the location of the 1–1 line transformed to the case of , a decrease of 22.5% in and 6% in . Again there is a subset of stars with mag, representing the upper envelope of the distribution, that agrees better with , but if we were to adopt the standard ISM extinction law the large majority of sources would fall below the 1–1 relation in the analogous plot to Figure 6. Among the validation sample (Table 1), we find that (SED) ranges from 0.2 mag to 5.7 mag, with mean mag.
4. Candidate X-ray-Emitting OB Stars
The Vela–Carina Point-Source Catalog contains sources within the CCCP survey area (P11), dominated by stars unassociated with the Carina complex. This would present an overwhelming contamination problem were we to attempt a search for candidate OB stars using the near-IR and mid-IR data alone. The CCCP survey provides a crucial selection criterion. OB stars emit primarily soft X-rays through microshocks in their strong stellar winds (Feldmeier et al., 1997), although a variety of other mechanisms appear to produce a heterogeneous mix of X-ray properties among the 200 known OB stars in the Carina Nebula, 118 of which were detected by CCCP (G11; Nazé et al., 2011). Of the sources in the CCCP X-ray catalog, are likely young stars in the Carina complex, and the vast majority of the IR counterparts to CCCP sources are too faint to masquerade as OB stars at the Carina distance (Getman et al., 2011; Broos et al., 2011b).
4.1. Sample Selection
We began our search for candidate OB stars with 3444 stars in the Vela–Carina Catalog that were both well-fit by stellar atmosphere models and matched to CCCP X-ray sources (Table 1 of P11). We also examined 164 stars with marginal IR excess at 5.8 or 8 m (P11) and CCCP counterparts that were well-fit by stellar atmospheres when the band affected by excess emission was excluded. Stars in the validation sample with CCCP detections were included in these groups. We then applied a magnitude cut at , equivalent to a B3 V star with mag extinction. This reduced the initial sample to 3183 stars without IR excess and 150 stars with marginal IR excess. The primary purpose of this cut was to impose a requirement that the source be detected in the 2MASS catalog; photometry is important for constraining the SED models in the absence of optical photometry.
We then analyzed the loci of SED fitting results on the HR diagram for each of the 3333 stars in the initial sample (as in Figure 2). In contrast to the validation sample analysis, we did not have any prior knowledge from which to constrain , so we followed the procedure of Watson et al. (2008) and identified the intersection point, if one existed, of the fit locus with the theoretical OB MS, as defined by Martins et al. (2005) for O stars and de Jager & Nieuwenhuijzen (1987) for B stars. As we would expect, in the large majority () of cases, the fit loci fall below the OB MS plotted in Figure 2; these stars are insufficiently luminous, assuming kpc, to be OB stars in Carina. For the remaining of the initial sample, the intersection with the MS exists and is defined by . These stars could be OB stars in Carina, but only if they have reached, or evolved beyond, the MS. It is apparent from Figure 2 that a degeneracy between OB stars and lower-mass, pre-main-sequence (PMS) stars exists where the locus of fits extends to cooler and crosses the PMS evolutionary tracks (Siess et al., 2000).
For sufficiently luminous candidate OB stars, the degeneracy with PMS stars can be broken. It is important to recall that, by design, none of the stars in our initial sample exhibit significant IR excess emission, so if they are PMS stars, they can neither be embedded nor possess optically thick circumstellar disks. This effectively places a lower limit on the age of each star, corresponding to the destruction timescale for the circumstellar disk and/or envelope. While this timescale is not well-known for intermediate-mass stars, it likely decreases with increasing stellar mass (Povich & Whitney, 2010, P11). Massive stars reach the MS while still embedded (Zinnecker & Yorke, 2007), hence we do not expect to find any massive PMS stars in our sample.
When the bolometric luminosity of the MS intersection point falls above a fiducial value of , the SED fitting results become physically inconsistent with a PMS interpretation. The three examples plotted in Figure 2 illustrate the general cases of fit loci falling below (blue), above (red), and near (green) the fiducial luminosity. Lacking an independent determination of from spectroscopy, the (blue) stellar locus that intersects the MS near cannot be interpreted unambiguously. Models to the left of the MS can be excluded, but models to the right are consistent with PMS stars between 0.5 and 2 Myr old. Such a source could be a diskless, X-ray-emitting, low- or intermediate-mass PMS star in the Carina Nebula, and this interpretation would be preferred given that late B stars are not expected to emit X-rays (Evans et al., 2011). In contrast, the (red) stellar locus with MS intersection near is unambiguously massive. The PMS interpretation is effectively eliminated for this star, because it implies an extremely young age ( Myr) that is inconsistent with the lack of a strong IR excess. Even if this star has evolved past the MS, we would not disqualify it for inclusion in our list of candidate OB stars, because as a post-MS Carina member it would necessarily be massive, most probably an OB giant or supergiant with . Finally, the (green) stellar locus with MS intersection near represents the borderline case. The PMS interpretation requires a diskless, X-ray-emitting star younger than 0.5 Myr. Such an interpretation is possibly allowed if the disk lifetimes of intermediate-mass stars are very short (Povich & Whitney, 2010), but the OB interpretation is more plausible and hence preferred. We therefore find that stars with equivalent MS luminosity rise above the PMS degeneracy. Applying this cut to our sample, we selected 179 candidate X-ray-emitting OB stars (including 6 with marginal IR excess in the IRAC bands), shown on a Spitzer image of the Carina Nebula in Figure 7.
The selection procedure described above recovered 84 of the 182 sources in the validation sample. All validation stars were not selected because: (1) nearly half of the 200 known OB stars in Carina lack CCCP detections (G11), (2) some validation stars lack 2MASS photometry (Table 1), and (3) validation stars with spectral types later than B1 V (Cl* Trumpler 16 MJ 323 in Figures 1 and 2, for example) generally do not reach the luminosity cutoff of L☉ for unambiguous candidate OB stars.
As a final step in establishing our list of candidate OB stars in Carina, we discarded sources with cataloged spectral types listed in the Skiff (2009) compilation, including the 84 OB stars the validation sample that have counterparts in the CCCP catalog and two foreground giants that were also selected by our search criteria. The final sample of 94 candidate X-ray-emitting OB stars (including 2 with marginal IR excess) is presented in Table 3, and each star is given a catalog number, preceded by “OBc”, in column (1).444OBc 94 falls just below the fiducial luminosity cutoff, but it was added to the sample because its high-quality X-ray spectrum strongly suggests a massive star (see §4.4). Values of , , and (using ) computed from the MS intersection points (Figure 2) are listed in columns (3)–(5). We stress that these stellar parameters should only be used for comparison purposes among the sample, because we have assumed that each star is on the theoretical MS. Formally, these values are upper limits, given the physical constraint that (MS). Systematic errors due to the adoption of the ATLAS9 stellar atmosphere models (see §3.2) may also lead formally to overestimates of , and , but this effect is unimportant given that our analysis produces upper limits anyway. Unresolved binaries and evolved, post-MS OB stars exist in the validation sample (G11) and are expected to be present in the candidate OB sample as well. The parameters given in Table 3 for such stars are certainly overestimates. The OB classification of all stars, as well as the physical parameters derived from SED fitting, must be regarded as tentative until confirmed by follow-up spectroscopic observations.
We have checked for previous identifications of each star in Table 2 in existing stellar catalogs. Most, but not all, of the candidate OB stars were detected by optical all-sky surveys listed in VizieR (Ochsenbein et al., 2000), but the catalogs were intended primarily for astrometry, and the photometry is generally of insufficient quality to aid in our SED analysis. A few have previous identifications and tentative spectral classifications, listed in column (14). Eleven of the candidate OB stars are cataloged in the Henry Draper Extension Charts (HDEC; Nesterov et al., 1995), with the following distribution of spectral classes (no luminosity classes are given): 3 B-type, 5 A-type, 2 G-type, and 1 K0. More recent, optical/near-IR photometric observations, sometimes combined with X-ray observations (Cudworth et al., 1993; Evans et al., 2003; Sanchawala et al., 2007), identified 4 of our candidate OB stars and misclassified 2 others as candidate PMS stars (one of the latter, OBc 42, is among the most highly-obscured stars in our sample).
4.2. Possible Contaminating Sources
We have assumed that X-ray emission is a strong indicator that a candidate OB star in the CCCP field is located at the distance of the Carina Nebula. Getman et al. (2011) provide Monte Carlo simulations that evaluate the potential contaminating source populations expected in the CCCP field. Background active galactic nuclei are the most numerous X-ray contaminants, but such objects are far too faint in the IR to be mistaken for OB stars. Galactic field stars, however, can be sufficiently bright in X-rays to have been included in the CCCP catalog (Getman et al., 2011). In this section, we evaluate the possible levels of contamination in our candidate OB star sample from unassociated field stars.
Foreground MS stars. Getman et al. (2011) predict foreground main-sequence stars in the CCCP, broken down by spectral class into 150, 450, 140, and 850 F, G, K, and M dwarfs, respectively. K and M dwarfs are too cool and faint to be mistaken for OB stars by our SED analysis, but F and G dwarfs could produce contamination, if they are not too distant. We have estimated the maximum distance and potential numbers of foreground MS contaminants as follows. We iterated our analysis of the SED fitting results, experimenting with assumed distances from to 0.5 kpc, and measured the values for . For kpc, a population of possible G dwarfs with L☉ emerged.
The least-obscured stars in the validation sample have mag and reddening consistent with a diffuse ISM extinction law characterized by (Figures 5 & 6). The extinction to the least-obscured Carina members is therefore dominated by the ISM along the line-of-sight to the Carina Nebula with a negligible contribution from local cloud material. The extinction to a nearby star should be a small fraction of the mag extinction to the Carina complex, hence we identified 17 potential foreground dwarfs satisfying mag, assuming and a uniform distribution of extinction with distance. The simulations predict F and G MS stars at kpc detected by the CCCP (Getman et al., 2011). The 17 candidate OB stars that could possibly be foreground dwarfs are identified by “PFD” in column (14) of Table 3.
Giants. The simulations of Getman et al. (2011) predict (150 foreground + 250 background) contaminating giant stars of all spectral classes. Because giants, especially red giants with K and M spectral types, are very luminous in the IR, they represent a potentially serious source of contamination if they are detected in significant numbers by the CCCP. Taking the simulations at face value, we might expect to misclassify 400 X-ray-emitting giants as candidate OB stars, distributed evenly throughout the CCCP field. This is clearly not the case, which suggests that the actual number of giants masquerading as OB stars is far lower. Late K and M giants are sufficiently cool that they can be separated from hot stars on the basis of their near-IR colors, hence they are unlikely to be mistaken for OB stars in our SED analysis. Furthermore, the giants most likely to be strong X-ray emitters detected by CCCP are F and G giants with ages Gyr (Rosner et al., 1995; Pizzolato et al., 2000). Such stars are relatively uncommon. The Getman et al. (2011) simulations predict only (10 foreground + 10 background) F and G giants in the CCCP catalog, and depending on the distance and extinction, these may or may not be selected as candidate OB stars.
Based on the arguments above, the maximum contamination fraction among our candidate OB stars is , and this could be a high upper limit. We know of only a few unassociated stars chosen by our selection criteria. Two spectroscopically identified giants (Figure 7) were discarded, and an additional 8 stars from the HDEC (Nesterov et al., 1995) have non-OB spectral types listed, 6 of which we independently flagged as possible foreground dwarfs (Table 3, column 14). One star, HD 305547 (OBc 72), has cataloged spectral type K0 (Table 3) and probably is a giant, since this classification seems more likely than a highly-luminous O star (equivalent to an O3 V star on the MS) located far from the major ionizing clusters and active star forming regions in the Carina Nebula. It is not clear, however, that the HDEC spectral types are reliable, since the candidate OB stars fall at the extreme faint limit of the HDEC. Considering its source crowding and contamination from bright nebular emission, the Carina Nebula posed an extremely challenging target for the technology available for optical spectroscopy in the early 20th century. New, targeted spectroscopy is needed to confirm the identifications of all 94 candidate OB stars.
4.3. Spatial Distribution
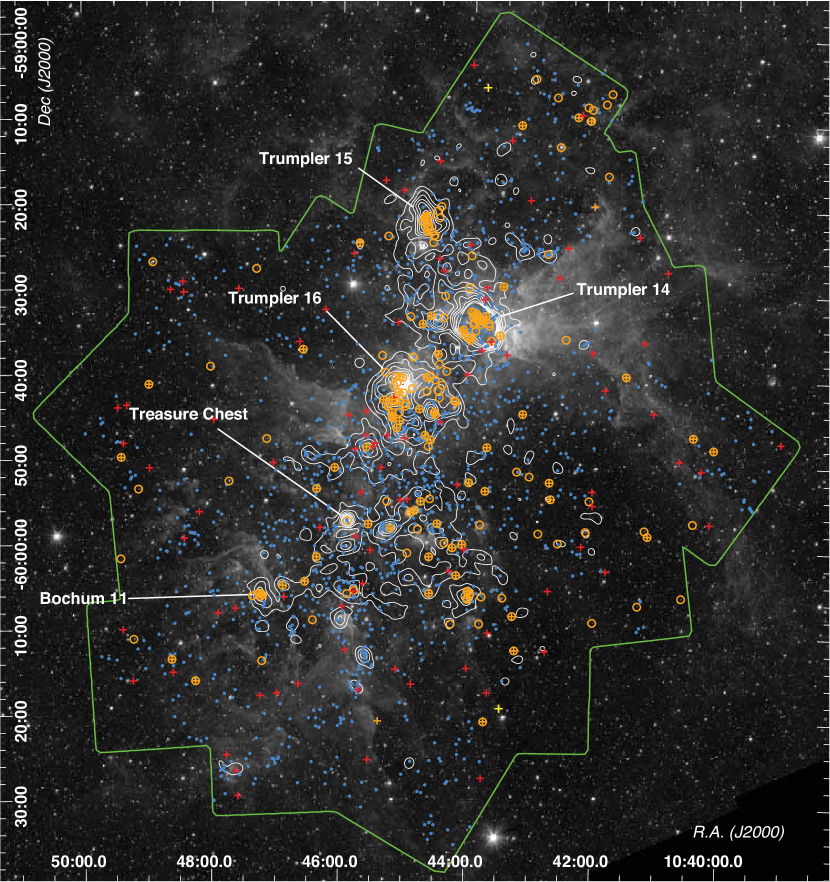
The spatial distributions of known and candidate OB stars selected via our SED fitting method shows good correspondence with the distribution of YSOs selected via mid-IR excess emission by P11 (Figure 7). OB stars, in particular the known OB stars (G11), are spatially correlated with the stellar clusters identified by Feigelson et al. (2011), but there is clearly a more distributed population as well. Unsurprisingly, the candidate OB stars are preferentially found outside of the well-studied, lightly-obscured ionizing clusters Tr 16, 14, 15 and Bo 11. The Treasure Chest cluster contains young OB stars, but it is too compact and too contaminated by nebulosity for reliable 2MASS and Spitzer point-source detections.
The average extinction () of the candidate OB stars is mag. The minimum mag, and it should be noted that the least-obscured candidate OB stars, with mag could instead be contaminating foreground stars (Table 3). The star in our sample with the highest extinction is OBc 59, with mag; this star is apparently located inside or behind an obscuring IR dark cloud in the dense molecular cloud known as the giant pillar (Smith et al., 2000; Rathborne et al., 2004; Yonekura et al., 2005). OBc 59 is found in the middle of a small but significant overdensity of CCCP sources (Feigelson et al., 2011); it is unlikely to be an unassociated background star and may be the most massive member of a highly-obscured young cluster. A similarly highly-obscured star is OBc 42, with mag; this star is apparently located near IRAS 10430–5931, the first embedded cluster discovered in the Carina Nebula (Megeath et al., 1996).
Extinction is generally higher in the South Pillars (Smith et al., 2000, 2010) region, located southeast of Tr 16 (Figure 7), and behind the V-shaped, obscuring dust lane south of Tr 16 and 14 (Smith & Brooks, 2007). The greatest concentration of candidate OB stars is found in the dust lane southeast of Tr 16, where Sanchawala et al. (2007) and Feigelson et al. (2011) have found evidence for an obscured, massive cluster possibly associated with a dense molecular core (Yonekura et al., 2005). The six candidate OB stars in this group (OBc 48, 50, 51, 52, 56, and 61) have average mag, and three of them (OBc 50, 52, and 56) have (Table 3), equivalent to O4 V stars (Martins et al., 2005).
4.4. X-ray Properties
Among the candidate X-ray-emitting OB stars, 21 had X-ray spectra of sufficiently high signal-to-noise (S/N) to measure the absorbing column density , spectral temperature , and total-band (0.5–8 keV), absorption-corrected X-ray luminosity by minimizing the statistic (; Cash, 1979) implemented in the XSPEC spectral fitting package (Arnaud, 1996). We define high-S/N sources as those whose spectra in the fit range of 0.5–8 keV could be divided into 8 or more groups (spectral bins) with S/N per group. This is similar to the requirement used by Nazé et al. (2011) that a source modeled with XSPEC have net counts. OBc 94 is a member of this high-S/N group with 511 total-band net counts, a soft X-ray spectrum ( keV), and no significant variability, all of which suggest a massive star, hence we included OBc 94 in our candidate OB star sample even though its IR SED alone is not quite bright enough (, Table 3) to qualify as an unambiguous OB candidate.
We performed XSPEC fits to the spectra of the 21 high-S/N sources in two different ways. (1) Similar to the approach of Nazé et al. (2011), we fit one- or two-component thermal plasma models, freezing the absorption parameter to the value corresponding to found by the IR SED fitting, (assuming cm-2 mag-1; Vuong et al., 2003). The X-ray properties returned by these “frozen-absorption” fits are presented in Table 4. But whereas Nazé et al. (2011) analyzed known Carina OB stars for which the measurement of is robust,555Nazé et al. (2011) used SED) from our Table 1, if available, and from G11 otherwise. until can be measured by follow-up optical/near-IR spectroscopy is simply an upper limit to the absorption, and we cannot even be certain that a given candidate OB star is actually a Carina member. To obtain a measure of that is independent of the assumptions used in the IR SED fitting, (2) we again fit the X-ray spectra with one- or two-component thermal plasma models, this time letting vary as a free parameter. The X-ray properties returned by these “free-absorption” fits are presented in Table 5.
| (1) | (2) | (3) | (4) | (5) | (6) | (7)bbX-ray luminosity in each thermal plasma component, corrected for the absorption given in column (4). | (8)bbX-ray luminosity in each thermal plasma component, corrected for the absorption given in column (4). |
|---|---|---|---|---|---|---|---|
| OBc | Net Counts | ||||||
| No. | CXOGNC JaaCCCP Catalog identifier (Broos et al., 2011a). | 0.5–8 keV | (cm-2) | (keV) | (keV) | (erg s-1) | (erg s-1) |
| 1 | 103909.94-594714.5 | 1864 | 33.12 | 31.98 | |||
| 2 | 104014.67-595654.4 | 210 | 31.72 | ||||
| 5 | 104059.29-592724.9 | 146 | 31.35 | 30.86 | |||
| 10 | 104154.91-594123.6 | 1249 | 32.36 | 31.67 | |||
| 12 | 104205.01-595317.4 | 146 | 31.75 | ||||
| 18 | 104246.53-601207.0 | 1403 | 32.37 | 31.78 | |||
| 19 | 104306.95-591915.0 | 139 | 31.30 | ||||
| 30 | 104401.63-590327.4 | 174 | 31.77 | 31.00 | |||
| 32 | 104402.75-593946.0 | 1278 | 32.37 | 31.64 | |||
| 34 | 104411.16-595242.6 | 198 | 31.93 | ||||
| 39 | 104430.89-591446.0 | 201 | 31.70 | ||||
| 41 | 104457.51-595429.5 | 574 | 32.06 | 31.50 | |||
| 50 | 104522.29-595047.0 | 379 | 31.46 | 30.81 | |||
| 52 | 104530.22-594821.0 | 218 | 31.49 | ||||
| 55 | 104536.45-594410.7 | 222 | 31.61 | ||||
| 56 | 104536.75-594702.2 | 220 | 31.73 | 30.95 | |||
| 57 | 104538.70-600426.5 | 150 | 31.08 | ||||
| 67 | 104615.19-593217.6 | 133 | 31.16 | 30.86 | |||
| 75 | 104735.26-602923.4 | 199 | 31.29 | 31.12 | |||
| 88 | 104858.62-595057.4 | 288 | 31.59 | 30.15 | |||
| 94 | 104220.83-590908.6 | 511 | 31.63 |
| (1) | (2) | (3) | (4) | (5) | (6) | (7) | (8) | (9) | (10) | (11) |
|---|---|---|---|---|---|---|---|---|---|---|
| OBc | Net Counts | |||||||||
| No. | CXOGNC J | 0.5–8 keV | (cm-2) | (keV) | (keV) | (erg s-1) | (erg s-1) | (mag) | (mag) | |
| 1 | 103909.94-594714.5 | 1864 | 32.56 | 32.04 | 2.1 | 1.5 | 11.6 | |||
| 2 | 104014.67-595654.4 | 210 | 31.78 | 3.5 | -0.5 | 0.5 | ||||
| 5 | 104059.29-592724.9 | 146 | 32.16 | 11.1 | -6.3 | 25.0 | ||||
| 10 | 104154.91-594123.6 | 1249 | 31.01 | 31.75 | 0.5 | 3.5 | 11.5 | |||
| 12 | 104205.01-595317.4 | 146 | 31.55 | 2.3 | 1.1 | 1.5 | ||||
| 18 | 104246.53-601207.0 | 1403 | 31.78 | 31.86 | 0.1 | 2.6 | 17.6 | |||
| 19 | 104306.95-591915.0 | 139 | 31.41 | 11.3 | -2.9 | 0.5 | ||||
| 30 | 104401.63-590327.4 | 174 | 32.20 | 30.96 | 4.3 | -1.2 | 0.3 | |||
| 32 | 104402.75-593946.0 | 1278 | 30.96 | 31.69 | 0.9 | 3.9 | 17.4 | |||
| 34 | 104411.16-595242.6 | 198 | 31.31 | 0.0 | 2.6 | 9.7 | ||||
| 39 | 104430.89-591446.0 | 201 | 31.74 | 6.9 | -1.5 | 1.2 | ||||
| 41 | 104457.51-595429.5 | 574 | 31.00 | 31.57 | 0.1 | 3.5 | 16.2 | |||
| 50 | 104522.29-595047.0 | 379 | 32.49 | 30.58 | 11.0 | -6.1 | 29.9 | |||
| 52 | 104530.22-594821.0 | 218 | 31.50 | 10.3 | -0.2 | 0.0 | ||||
| 55 | 104536.45-594410.7 | 222 | 31.57 | 4.9 | 2.2 | 2.6 | ||||
| 56 | 104536.75-594702.2 | 220 | 32.38 | 14.1 | -5.5 | 13.9 | ||||
| 57 | 104538.70-600426.5 | 150 | 31.07 | 2.1 | 0.2 | 0.1 | ||||
| 67 | 104615.19-593217.6 | 133 | 30.64 | 30.92 | 0.5 | 1.8 | 1.3 | |||
| 75 | 104735.26-602923.4 | 199 | 31.72 | 31.01 | 4.7 | -2.1 | 2.8 | |||
| 88 | 104858.62-595057.4 | 288 | 31.15 | 30.45 | 0.5 | 2.0 | 5.3 | |||
| 94 | 104220.83-590908.6 | 511 | 31.85 | 1.2 | 1.2 | 3.9 |
Note. — Explanations for columns (2), (7), and (8) are given in the footnotes to Table 4.
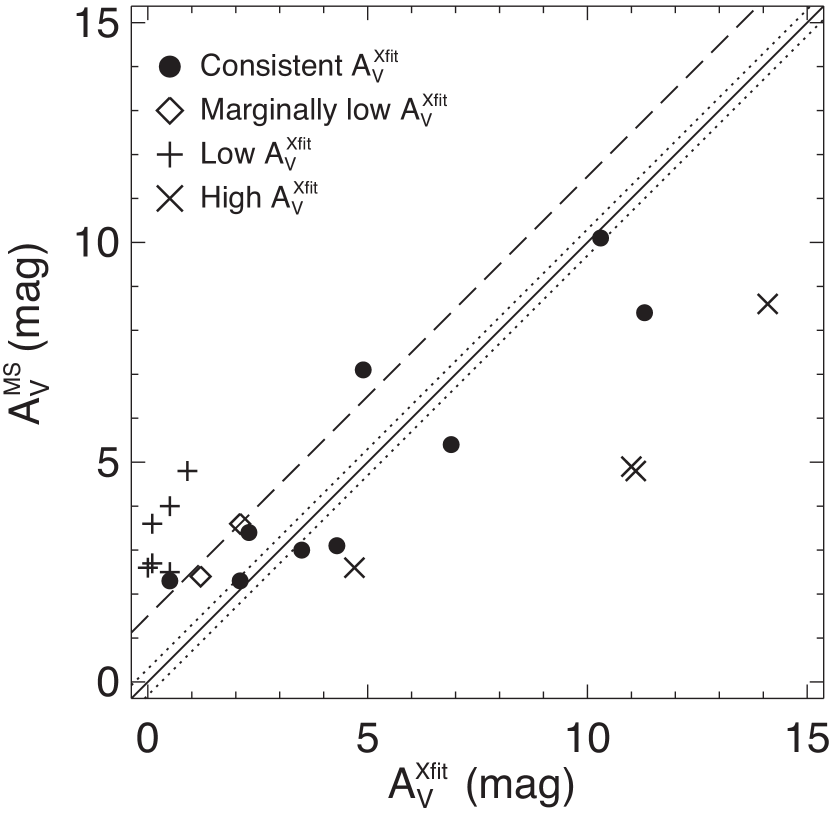
Table 5 includes comparisons between extinction , derived from the best-fit X-ray absorption , and (columns 9 and 10), and these comparisons are plotted in Figure 8. Column (11) gives the change in the goodness-of-fit parameter between the frozen-absorption fits of Table 4 and the best free-absorption fit. XSPEC defines a 90% confidence interval as having , hence for the 9 sources in Table 5 meeting this criterion, we consider the X-ray spectral fitting results to be consistent with the IR SED fitting results. These sources, plotted as filled circles in Figure 8, are OBc 2, 12, 19, 30, 39, 52, 55, 57, and 67.
Based on the well-behaved degeneracy between and (Figure 2) and the mag uncertainty on when only the IR SED is used in the fitting (Figure 3) we can divide the 21 high-S/N sources into the following cases (see Figure 8):
-
•
mag. The X-ray spectral fitting results are consistent with a single OB star on or near the MS. OBc 2, 52 and 57 are in this group, and all are also consistent with the “frozen” fits according to (Table 5).
-
•
mag. X-ray spectral fitting suggests an absorption lower than the MS intersection point but still consistent with . OBc 12 and 94 are in this group, meaning these stars are likely massive Carina members but may be unresolved, binary systems or post-MS (super)giants.
-
•
mag. The X-ray spectrum includes a soft, unabsorbed component, and hence the spectral fitting results are inconsistent with the high absorption required by the SED fitting results. This could cast doubt on the OB candidacy of these stars, since lower absorption correlates with cooler stars (Figure 2b). OBc 1, 10, 18, 32, 34, 41, and 88 fall into this category (as would OBc 55 and 67, except they are still within the 90% confidence interval; Table 5).
-
•
mag. X-ray spectral fitting prefers significantly higher absorption than the maximum allowed by IR SED fitting. There are 2 possible explanations, both of them consistent with X-rays originating from an OB star: X-rays are absorbed “locally” in the stellar wind (Nazé et al., 2011), or a degeneracy in the XSPEC fitting introduces a spurious, highly-luminous but highly-absorbed soft thermal plasma (the latter is more likely in cases where deviation is more than a few mag). OBc 5, 50, 56, and 75 fall into this category (as would OBc 19, 30, and 39, except they are still within the 90% confidence interval.)
In summary, the XSPEC fitting results are consistent with reddened OB stars in the majority of the 21 high-S/N cases (Table 5 and Figure 8). We might wonder if the 7 stars for which XSPEC prefers very low absorption (listed above in the 3rd bullet point) are foreground stars instead of Carina OB stars, however this category includes 5 stars with remarkable X-ray emission that seems very unlikely to originate from a low- star that happens to be located in front of the Carina Nebula. OBc 1, 10, 18, and 32 all boast net counts, making them among the brightest sources in the entire CCCP catalog (Broos et al., 2011a). OBc 41 was observed to produce a spectacular X-ray flare with a peak luminosity erg s-1 (assuming this object is at the Carina distance; Townsley et al., 2011a); the spectral fitting results for OBc 41 presented in Tables 4 and 5 correspond to the quiescent spectrum.
5. Discussion and Summary
We have identified 94 candidate X-ray-emitting OB stars in the Carina Nebula. The majority have not been identified previously, probably because they tend to be more obscured and located outside of well-studied, ionizing clusters. The average extinction (upper limit) among the candidate OB stars is mag, compared to mag among the known OB stellar population.
Using a validation sample of 182 OB stars in the Carina Nebula with known spectral types, we demonstrate that optical+IR SED fitting provides a robust method for simultaneously measuring the bolometric luminosity and extinction of individual stars. While not significant in the current analysis, systematic errors introduced by the inappropriateness of the ATLAS9 model atmospheres (Castelli & Kurucz, 2004) when applied to early O stars and OB supergiants should motivate the incorporation of fully line-blanketed, non-LTE, expanding atmosphere models into the SED fitting analysis for future applications.
We find that the extinction law measured toward the OB stars has two components: –1.5 mag produced by foreground dust in the diffuse interstellar medium (ISM) plus a contribution from local dust in the Carina molecular clouds that increases with as increases. In other words, the “anomalous” extinction law is more readily observed for stars located deeper inside or behind the obscuring Carina molecular clouds. The local dust component is characterized by a ratio of total-to-selective absorption . While a subset of the least-reddened stars agrees with the standard diffuse ISM extinction law (), the average extinction law toward the set of known Carina OB stars is better represented by . Similar two-component extinction laws, with higher values produced by local dust, have been measured toward other Galactic H II regions, for example M17 (Chini & Wargau, 1998; Hoffmeister et al., 2008) and NGC 3603 (Pandey et al., 2000; Melena et al., 2008).
Higher values generally correspond to dust grain distributions with larger average grain sizes (e.g. Cardelli et al., 1989; Whittet et al., 2001; Fitzpatrick & Massa, 2009). Herbst (1976) proposed that smaller dust grains are preferentially evaporated in the harsh radiation field permeating the Carina H II region, weighting the grain distributions toward larger sizes. More recent work, however, suggests that dust grains are rapidly destroyed and replenished inside energetic H II regions, but relatively small column densities are sufficient to produce the bright mid-IR emission often observed to be coincident with the ionized gas (Everett & Churchwell, 2010). Dust processed within the Carina H II region therefore may not contribute significantly to the total line-of-sight extinction. A more plausible explanation for the “anomalous” extinction law in the Carina molecular cloud could be coagulation of grains or the growth of icy grain mantles inside cold molecular cloud fragments, where dust remains shielded from the external radiation field (e.g. Whittet et al., 2001). Such cold clouds appear to obscure many regions of the Carina Nebula. Hot, diffuse plasma produced by the massive stellar population fills the Carina H II region cavities, and there is evidence that this plasma is interacting directly with the molecular clouds, eroding them (Townsley et al., 2011b). Such erosion could provide a mechanism for liberating large grains from the cold, dense molecular clouds, which would explain the widespread impact of this grain population on the local extinction law throughout the Carina complex.
While none of the candidate OB stars shows significant IR excess, some may nevertheless be as young as, or even younger than, lower-mass YSOs with circumstellar disks. In the South Pillars region, OB stars are spatially intermingled with intermediate-mass YSOs exhibiting IR excess emission and frequently associated with compact groups of obscured X-ray sources (Smith et al., 2010; Feigelson et al., 2011, P11). The spatial correlation of diskless OB stars with disk-bearing YSOs (Figure 7) lends support to the scenario of rapid disk/envelope destruction among intermediate- to high-mass YSOs proposed by P11.
The most luminous candidate OB stars have , equivalent to O4 V stars. The Tr 16-SE obscured cluster (Sanchawala et al., 2007) harbors several of these luminous stars, making it a significant feature of the Carina young stellar population, possibly more massive than the well-known Bochum 11 or Treasure Chest clusters.
If confirmed by spectroscopic follow-up, the 94 candidate OB stars could increase the number of cataloged massive stars in Carina by 30% to 50%, depending on the amount of contamination in the sample from unassociated stars (§4.2). Of the 200 known massive stars, 140 have (G11); the remainder have spectral types of B1 V or later and are less luminous than the candidate OB stars in our sample. Of these 140, our blind search detected 84, or 60%, because some stars failed to meet the criteria for inclusion in the CCCP X-ray source catalog (Broos et al., 2011a), and some are located in dense cluster centers, in Tr 16 near Car, in the Treasure Chest, or in similar regions of Carina where the 2MASS and IRAC observations are incomplete due to crowding and/or bright nebular emission. Correcting for these factors of incompleteness, we estimate the Carina Nebula contains between (maximum contamination case) and (negligible contamination case) O and early B stars with . This finding potentially doubles the size of the young massive stellar population in one of the most spectacular star-forming regions in the Galaxy.
References
- Allen & Hillier (1993) Allen, D. A., & Hillier, D. J. 1993, Proceedings of the Astronomical Society of Australia, 10, 338
- Antokhin et al. (2008) Antokhin, I. I., Rauw, G., Vreux, J.-M., van der Hucht, K. A., & Brown, J. C. 2008, A&A, 477, 593
- Arnaud (1996) Arnaud, K. A. 1996, in Astronomical Data Analysis Software & Systems V, Vol. 101, 17
- Ascenso et al. (2007) Ascenso, J., Alves, J., Vicente, S., & Lago, M. T. V. T. 2007, A&A, 476, 199
- Broos et al. (2011a) Broos, P. S. et al. 2011a, ApJS, in press (CCCP Catalog Paper)
- Broos et al. (2011b) Broos, P. S. et al. 2011b, ApJS, in press (CCCP Classifier Paper)
- Cardelli et al. (1989) Cardelli, J. A., Clayton, G. C., & Mathis, J. S. 1989, ApJ, 345, 245
- Cash (1979) Cash, W. 1979, ApJ, 228, 939
- Castelli & Kurucz (2004) Castelli, F., & Kurucz, R. L. 2004, arXiv:astro-ph/0405087
- Chini & Wargau (1998) Chini, R., & Wargau, W. F. 1998, A&A, 329, 161
- Crowther (2005) Crowther, P. A. 2005, Massive Star Birth: A Crossroads of Astrophysics, 227, 389
- Cudworth et al. (1993) Cudworth, K. M., Martin, S. C., & Degioia-Eastwood, K. 1993, AJ, 105, 1822
- Davidson & Humphreys (1997) Davidson, K., & Humphreys, R. M. 1997, ARA&A, 35, 1
- DeGioia-Eastwood et al. (2001) DeGioia-Eastwood, K., Throop, H., Walker, G., & Cudworth, K. M. 2001, ApJ, 549, 578
- de Jager & Nieuwenhuijzen (1987) de Jager, C., & Nieuwenhuijzen, H. 1987, A&A, 177, 217
- Fazio et al. (2004) Fazio, G. G. et al. 2004, ApJS, 154, 10
- Evans et al. (2003) Evans, N. R., Seward, F. D., Krauss, M. I., Isobe, T., Nichols, J., Schlegel, E. M., & Wolk, S. J. 2003, ApJ, 589, 509
- Evans et al. (2011) Evans, N. R. 2011, ApJS, in press (CCCP Tr16 B Stars Paper)
- Everett & Churchwell (2010) Everett, J. E., & Churchwell, E. 2010, ApJ, 713, 592
- Feigelson et al. (2011) Feigelson, E. D. et al. 2011, ApJS, in press (CCCP Clustering Paper)
- Feinstein et al. (1976) Feinstein, A., Marraco, H. G., & Forte, J. C. 1976, A&AS, 24, 389
- Feldmeier et al. (1997) Feldmeier, A., Puls, J., & Pauldrach, A. W. A. 1997, A&A, 322, 878
- Fitzgerald & Mehta (1987) Fitzgerald, M. P., & Mehta, S. 1987, MNRAS, 228, 545
- Fitzpatrick & Massa (2009) Fitzpatrick, E. L., & Massa, D. 2009, ApJ, 699, 1209
- Gagné et al. (2011) Gagné, M. et al. 2011, ApJS, in press (CCCP Massive Star Signatures Paper; G11)
- Getman et al. (2011) Getman, K. V. et al. 2011, ApJS, in press (CCCP Contaminants Paper)
- Herbst (1976) Herbst, W. 1976, ApJ, 208, 923
- Hillier & Miller (1998) Hillier, D. J., & Miller, D. L. 1998, ApJ, 496, 407
- Hoffmeister et al. (2008) Hoffmeister, V. H., Chini, R., Scheyda, C. M., Schulze, D., Watermann, R., Nürnberger, D., & Vogt, N. 2008, ApJ, 686, 310
- Indebetouw et al. (2005) Indebetouw, R. et al. 2005, ApJ, 619, 931
- Lanz & Hubeny (2003) Lanz, T., & Hubeny, I. 2003, ApJS, 146, 417
- Maíz-Apellániz (2004) Maíz-Apellániz, J. 2004, PASP, 116, 859
- Massey & Johnson (1993) Massey, P. & Johnson, J. 1993, AJ, 105, 980
- Martins et al. (2005) Martins, F., Schaerer, D., & Hillier, D. J. 2005, A&A, 436, 1049
- Megeath et al. (1996) Megeath, S. T., Cox, P., Bronfman, L., & Roelfsema, P. R. 1996, A&A, 305, 296
- Melena et al. (2008) Melena, N. W., Massey, P., Morrell, N. I., & Zangari, A. M. 2008, AJ, 135, 878
- Nazé et al. (2011) Nazé, Y. et al. 2011, ApJS, in press (CCCP Massive Star Lx/Lbol Paper)
- Nesterov et al. (1995) Nesterov, V. V., Kuzmin, A. V., Ashimbaeva, N. T., Volchkov, A. A., Röser, S., & Bastian, U. 1995, A&AS, 110, 367
- Ochsenbein et al. (2000) Ochsenbein, F., Bauer, P., & Marcout, J. 2000, A&AS, 143, 23
- Pandey et al. (2000) Pandey, A. K., Ogura, K., & Sekiguchi, K. 2000, PASJ, 52, 847
- Pauldrach et al. (2001) Pauldrach, A. W. A., Hoffmann, T. L., & Lennon, M. 2001, A&A, 375, 161
- Pizzolato et al. (2000) Pizzolato, N., Maggio, A., & Sciortino, S. 2000, A&A, 361, 614
- Povich et al. (2008) Povich, M. S., Benjamin, R. A., Whitney, B. A., Babler, B. L., Indebetouw, R., Meade, M. R., & Churchwell, E. 2008, ApJ, 689, 242
- Povich et al. (2009) Povich, M. S. et al. 2009, ApJ, 696, 1278
- Povich & Whitney (2010) Povich, M. S. & Whitney, B. A. 2010, ApJ, 714, L285
- Povich et al. (2011) Povich, M. S. et al. 2011, ApJS, in press (CCCP IR YSOs Paper; P11)
- Preibisch et al. (2011) Preibisch, T. et al. 2011, ApJS, in press (CCCP Hawk-I Paper)
- Rathborne et al. (2004) Rathborne, J. M., Brooks, K. J., Burton, M. G., Cohen, M., & Bontemps, S. 2004, A&A, 418, 563
- Robitaille et al. (2007) Robitaille, T. P., Whitney, B. A., Indebetouw, R., & Wood, K. 2007, ApJS, 169, 328
- Rosner et al. (1995) Rosner, R., Musielak, Z. E., Cattaneo, F., Moore, R. L., & Suess, S. T. 1995, ApJ, 442, L25
- Sanchawala et al. (2007) Sanchawala, K., et al. 2007, ApJ, 667, 963
- Siess et al. (2000) Siess, L., Dufour, E., & Forestini, M. 2000, A&A, 358, 593
- Skiff (2009) Skiff, B. A. 2009, VizieR Online Data Catalog, 1, 2023
- Skrutskie et al. (2006) Skrutskie, M. F. et al. 2006, AJ, 131, 1163
- Smith et al. (2000) Smith, N., Egan, M. P., Carey, S., Price, S. D., Morse, J. A., & Price, Paul A. 2000, ApJ, 532, L145
- Smith (2006a) Smith, N. 2006a, MNRAS, 367, 763
- Smith (2006b) Smith, N. 2006b, ApJ, 644, 1151
- Smith & Brooks (2007) Smith, N., & Brooks, K. J. 2007, MNRAS, 379, 1279
- Smith et al. (2010) Smith, N. et al. 2010, MNRAS, 406, 952
- Smith (1987) Smith, R. G. 1987, MNRAS, 227, 943
- Stephenson & Sanduleak (1971) Stephenson, C. B., & Sanduleak, N. 1971, Publications of the Warner & Swasey Observatory, 1, 1
- Thé et al. (1980) Thé, P. S., Bakker, R., & Antalova, A. 1980, A&AS, 41, 93
- Townsley et al. (2011a) Townsley, L. K. et al. 2011, ApJS, in press (CCCP Intro Paper)
- Townsley et al. (2011b) Townsley, L. K. et al. 2011, ApJS, in press (CCCP Diffuse Paper)
- Turner & Moffat (1980) Turner, D. G., & Moffat, A. F. J. 1980, MNRAS, 192, 283
- Vuong et al. (2003) Vuong, M. H., Montmerle, T., Grosso, N., Feigelson, E. D., Verstraete, L., & Ozawa, H. 2003, A&A, 408, 581
- Walborn (1995) Walborn, N. R. 1995, Revista Mexicana de Astronomia y Astrofisica Conference Series, 2, 51
- Watson et al. (2008) Watson, C., et al. 2008, ApJ, 681, 1341
- Whittet et al. (2001) Whittet, D. C. B., Gerakines, P. A., Hough, J. H., & Shenoy, S. S. 2001, ApJ, 547, 872
- Yonekura et al. (2005) Yonekura, Y. et al. 2005, ApJ, 634, 476
- Zinnecker & Yorke (2007) Zinnecker, H., & Yorke, H. W. 2007, ARA&A, 45, 481
| (1)aaColumns (1) and (2) are from G11. | (2)aaColumns (1) and (2) are from G11. | (3) | (4) | (5) | (6) | (7)–(13) | (14) | ||||||
|---|---|---|---|---|---|---|---|---|---|---|---|---|---|
| Star | (ST)bbFrom the Martins et al. (2005) calibrations of versus spectral type for O stars, extended to early B stars by Crowther (2005). Spectral types were compiled from various sources by G11. | [3.6] | [4.5] | [5.8] | [8.0] | ||||||||
| Name | (mag) | (kK) | (L☉) | (mag) | SSTGLMAccSpitzer Vela–Carina Point Source Archive identification. | (mag) | (mag) | (mag) | (mag) | (mag) | (mag) | (mag) | IRE?ddSource exhibits marginal IR excess emission in the specified IRAC band(s): I2 = 4.5 m, I3 = 5.8 m, and I4 = 8.0 m. |
| HD 92607 | 1.14 | 35.0 | 5.21 | 1.34 | G287.1147-01.0236 | 7.91 | 7.87 | 7.88 | 7.92 | 7.97 | 7.98 | 8.04 | |
| HD 305443 | 1.20 | 21.0 | 3.71 | 1.18 | G287.2169-01.1326 | 10.23 | 10.22 | 10.25 | 10.22 | 10.11 | 9.66 | 8.78 | I3,I4 |
| HD 92644 | 0.72 | 24.0 | 4.36 | 0.74 | G287.1386-00.9831 | 8.84 | 8.90 | 8.95 | 8.95 | 9.00 | 8.93 | 8.99 | |
| LS 1745 | 0.44 | 21.0 | 3.76 | 0.56 | G287.3038-01.2513 | 9.98 | 10.01 | 10.03 | 10.12 | 10.06 | 10.02 | 9.81 | |
| HD 92741 | 0.65 | 24.0 | 4.98 | 0.72 | G287.3067-01.1132 | 7.29 | 7.35 | 7.35 | 7.36 | 7.47 | 7.42 | 7.41 | |
| LS 1760 | 2.32 | 21.0 | 4.11 | 2.22 | G287.3069-01.1006 | 9.56 | 9.40 | 9.32 | 9.32 | 9.24 | 9.25 | 9.27 | |
| LS 1763 | 1.44 | 21.0 | 3.54 | 1.36 | G287.3866-01.2251 | 10.74 | 10.68 | 10.67 | 10.67 | 10.61 | 10.62 | 10.58 | |
| HD 303225 | 1.00 | 24.0 | 4.02 | 1.04 | G287.2005-00.8168 | 9.80 | 9.86 | 9.83 | 9.90 | 9.89 | 9.71 | 9.53 | |
| HD 92852 | 0.86 | 26.0 | 4.16 | 0.95 | G286.9717-00.3124 | 9.67 | 9.68 | 9.72 | 9.68 | 9.77 | 9.71 | 9.66 | |
| HD 303202 | 1.16 | 17.5 | 3.80 | 0.98 | G287.0516-00.4524 | 9.43 | 9.43 | 9.43 | 9.52 | 9.50 | 9.47 | 9.26 | |
| HD 303189 | 1.04 | 21.0 | 3.70 | 0.88 | G286.9909-00.3252 | 10.14 | 10.16 | 10.19 | 10.19 | 10.26 | 10.15 | 10.14 | |
| HD 305452 | 0.94 | 21.0 | 4.11 | 1.07 | G287.4795-01.2133 | 9.23 | 9.19 | 9.17 | 9.15 | 9.25 | 9.18 | 9.12 | |
| HD 92877 | 0.68 | 21.0 | 4.22 | 0.38 | G287.3762-00.9993 | 8.58 | 8.62 | 8.67 | 8.91 | 9.02 | 8.96 | 9.01 | |
| HD 305439A | 2.93 | 29.5 | 5.17 | 2.98 | G287.4098-01.0496 | 7.83 | 7.80 | 7.75 | 7.66 | ||||
| LS 1778 | 1.34 | 26.0 | 3.95 | 1.30 | G287.0195-00.3222 | 10.27 | 10.28 | 10.23 | 10.30 | 10.21 | 9.85 | 8.59 | I3,I4 |
| HD 303297 | 1.08 | 26.0 | 4.23 | 0.96 | G287.0328-00.3394 | 9.42 | 9.51 | 9.50 | 9.60 | 9.57 | 9.52 | 9.57 | |
| HD 92894 | 1.43 | 29.5 | 4.62 | 1.47 | G287.0253-00.3142 | 9.06 | 9.05 | 9.02 | 9.11 | 9.15 | 8.97 | 8.87 | |
| HD 303296 | 1.10 | 26.0 | 4.24 | 1.02 | G287.0519-00.3221 | 9.41 | 9.44 | 9.49 | 9.52 | 9.58 | 9.54 | 9.62 | |
| HD 92937 | 1.20 | 19.0 | 4.24 | 1.13 | G287.2718-00.6977 | 8.53 | 8.54 | 8.47 | 8.53 | 8.54 | 8.52 | 8.68 | |
| Coll228-30 | 1.08 | 24.0 | 3.71 | 1.10 | G287.4684-01.0448 | 10.62 | 10.64 | 10.66 | 10.71 | 10.68 | 10.57 | 10.47 | |
| HD 92964 | 1.58 | 19.0 | 5.87 | 1.61 | G287.1091-00.3582 | 4.67 | 4.44 | 4.51 | 4.69 | 4.37 | 4.33 | ||
| HD 305438 | 0.98 | 35.0 | 4.76 | 0.85 | G287.4416-00.9615 | 8.88 | 8.93 | 8.98 | 9.07 | 9.12 | 9.08 | 9.08 | |
| LS 1790 | 1.18 | 28.0 | 3.89 | 1.15 | G287.0697-00.2693 | 10.54 | 10.57 | 10.60 | 10.61 | 10.61 | 10.77 | 10.98 | |
| HD 305437 | 0.93 | 28.0 | 4.50 | 0.96 | G287.4288-00.9315 | 9.03 | 9.07 | 9.10 | 9.09 | 9.03 | 8.77 | 8.33 | I3,I4 |
| HD 303313 | 1.48 | 24.0 | 3.98 | 1.29 | G287.2264-00.5331 | 9.92 | 9.93 | 9.93 | 9.92 | 9.91 | 10.01 | 10.14 | |
| HD 305535 | 0.94 | 19.0 | 3.91 | 0.82 | G287.4936-01.0103 | 9.30 | 9.27 | 9.32 | 9.27 | 9.43 | 9.35 | 9.37 | |
| HD 305515 | 1.12 | 24.0 | 3.77 | 0.92 | G287.4581-00.9030 | 10.45 | 10.67 | 10.34 | 10.40 | ||||
| HD 93002 | 1.12 | 29.5 | 4.43 | 1.12 | G287.0907-00.2177 | 9.45 | 9.46 | 9.46 | 9.52 | 9.53 | 9.47 | 9.39 | |
| HD 303316 | 2.24 | 39.0 | 5.14 | 2.30 | G287.4139-00.7887 | 8.70 | 8.62 | 8.50 | 8.48 | 8.50 | 8.47 | 8.49 | |
| HD 93028 | 0.82 | 33.0 | 4.86 | 0.81 | G287.6399-01.1917 | 8.47 | 8.53 | 8.61 | 8.61 | 8.63 | 8.71 | 8.67 | |
| HD 305516 | 1.36 | 28.0 | 4.33 | 1.30 | G287.4754-00.8832 | 9.63 | 9.45 | 9.18 | 8.28 | I3,I4 | |||
| HD 93026 | 1.00 | 24.0 | 4.09 | 0.90 | G287.1566-00.2855 | 9.58 | 9.56 | 9.58 | 9.65 | 9.67 | 9.62 | 9.70 | |
| HD 93027 | 1.02 | 31.5 | 4.81 | 1.08 | G287.6130-01.1302 | 8.67 | 8.72 | 8.67 | 8.77 | 8.78 | 8.73 | 8.66 | |
| HD 93056 | 0.72 | 26.0 | 4.43 | 0.86 | G287.6134-01.0895 | 8.95 | 8.98 | 9.00 | 9.01 | 9.08 | 9.07 | 9.05 | |
| HD 303312 | 2.28 | 29.5 | 4.71 | 2.28 | G287.3328-00.5494 | 9.14 | 9.01 | 8.88 | 8.88 | 8.85 | 8.85 | 8.82 | |
| Tr14-30 | 2.64 | 26.0 | 4.81 | 2.92 | G287.3829-00.6320 | 8.65 | 8.46 | 8.30 | 8.28 | 8.16 | 8.18 | ||
| LS 1809 | 3.16 | 37.0 | 5.03 | 3.08 | G287.4025-00.6332 | 8.68 | 8.66 | 8.61 | 8.68 | ||||
| HD 305556 | 1.19 | 29.5 | 4.95 | 1.59 | G287.7569-01.2877 | 8.30 | 8.30 | 8.17 | 8.23 | 8.25 | 8.20 | 8.20 | |
| Tr14-28 | 2.42 | 21.0 | 3.64 | 3.15 | G287.3931-00.6053 | 11.02 | 10.76 | 10.63 | 10.55 | 10.50 | 10.37 | ||
| Tr14-27 | 2.20 | 33.0 | 4.42 | 2.62 | G287.3915-00.6007 | 10.23 | 10.05 | 9.90 | 9.84 | 9.81 | 9.90 | ||
| HD 305518 | 2.36 | 31.5 | 4.97 | 2.48 | G287.5057-00.8142 | 8.70 | 8.50 | 8.47 | 8.39 | 8.43 | 8.42 | 8.33 | |
| LS 1813 | 1.40 | 21.0 | 3.80 | 1.22 | G287.5478-00.8885 | 10.02 | 9.99 | 9.97 | 9.95 | 10.02 | 9.95 | 9.95 | |
| Tr14-20 | 2.00 | 39.0 | 5.17 | 2.35 | G287.3900-00.5853 | 8.66 | 8.52 | 8.50 | 8.43 | 8.42 | 8.42 | 8.48 | |
| HD 93097 | 0.96 | 29.5 | 4.32 | 1.07 | G287.6486-01.0689 | 9.73 | 9.75 | 9.77 | 9.85 | 9.82 | 9.71 | 9.59 | |
| Tr14-21 | 2.52 | 33.0 | 4.64 | 2.58 | G287.3976-00.5905 | 9.55 | 9.39 | 9.26 | 9.32 | 9.31 | 9.38 | 9.43 | |
| Tr14-22 | 2.08 | 21.0 | 3.54 | 2.37 | G287.3992-00.5931 | 11.20 | 10.97 | 10.85 | 10.67 | 10.64 | 10.40 | ||
| Coll228-48 | 0.76 | 24.0 | 3.49 | 0.78 | G287.6771-01.1140 | 11.02 | 11.09 | 11.10 | 11.17 | 11.18 | 11.11 | ||
| HD 305521 | 1.44 | 28.0 | 4.40 | 1.46 | G287.5868-00.9424 | 9.46 | 9.40 | 9.35 | 9.40 | 9.41 | 9.41 | ||
| Tr14-24 | 1.92 | 26.0 | 3.93 | 2.62 | G287.4051-00.5948 | 10.77 | 10.55 | 10.44 | 10.37 | 10.37 | 10.41 | ||
| Tr14-5 | 1.96 | 33.0 | 4.45 | 2.68 | G287.4073-00.5867 | 9.93 | 9.84 | 9.80 | 9.78 | 9.74 | 9.80 | ||
| Tr14-3 | 2.96 | 28.0 | 4.38 | 2.18 | G287.4037-00.5798 | 9.73 | 9.62 | 9.49 | 9.58 | 9.54 | 9.46 | 9.19 | |
| HD 93128 | 2.00 | 45.0 | 5.63 | 2.21 | G287.4047-00.5783 | 7.91 | 7.86 | 7.79 | 7.78 | 7.75 | 7.68 | 7.78 | |
| Tr14-4 | 1.64 | 29.5 | 4.35 | 2.39 | G287.4085-00.5817 | 10.07 | 9.90 | 9.80 | 9.80 | 9.82 | 9.75 | 9.46 | |
| Tr14-26 | 1.64 | 21.0 | 3.71 | 2.47 | G287.4213-00.6020 | 10.50 | 10.36 | 10.27 | 10.08 | ||||
| LS 1821 | 1.18 | 34.0 | 4.68 | 1.22 | G287.6651-01.0535 | 9.19 | 9.20 | 9.18 | 9.13 | 9.27 | 9.17 | 9.27 | |
| Tr14-6 | 1.72 | 26.0 | 4.05 | 1.98 | G287.4160-00.5852 | 10.12 | 10.17 | 9.79 | |||||
| Tr14-18 | 2.04 | 24.0 | 3.80 | 2.32 | G287.4187-00.5886 | 10.84 | 10.63 | 10.54 | 10.48 | 10.40 | 9.88 | I3 | |
| Tr14-12 | 1.76 | 21.0 | 3.16 | 1.81 | G287.4079-00.5681 | 11.75 | 11.55 | 11.58 | |||||
| Tr14-19 | 2.32 | 26.0 | 4.03 | 2.44 | G287.4128-00.5753 | 10.64 | 10.27 | 10.15 | 10.13 | 10.13 | 10.03 | 10.16 | |
| Coll228-66 | 1.21 | 31.5 | 4.44 | 1.32 | G287.6668-01.0480 | 9.70 | 9.68 | 9.65 | 9.65 | 9.63 | 9.65 | 9.61 | |
| Tr16-126 | 2.52 | 26.0 | 4.44 | 2.85 | G287.4341-00.6089 | 9.58 | 9.37 | 9.24 | 9.12 | 9.12 | 9.06 | ||
| Tr14-8 | 1.38 | 38.0 | 5.10 | 2.00 | G287.4108-00.5649 | 8.62 | 8.57 | 8.46 | 8.41 | 8.20 | 7.83 | I3,I4 | |
| Coll228-68 | 1.00 | 26.0 | 3.95 | 1.05 | G287.6751-01.0606 | 10.28 | 10.28 | 10.26 | 10.25 | 10.32 | 10.24 | 10.10 | |
| HD 93146 | 1.26 | 38.0 | 5.26 | 1.46 | G287.6676-01.0464 | 8.11 | 8.11 | 8.02 | 8.04 | 8.08 | 8.06 | 8.06 | |
| HD 93130 | 1.96 | 38.0 | 5.68 | 2.20 | G287.5685-00.8593 | 7.30 | 7.26 | 7.15 | 7.02 | 7.07 | 7.02 | 6.98 | |
| Coll228-67 | 1.07 | 33.0 | 4.83 | 1.14 | G287.6747-01.0584 | 8.66 | 8.75 | 8.71 | 8.65 | 8.76 | 8.72 | 8.82 | |
| LS 1822 | 1.36 | 24.0 | 4.11 | 1.36 | G287.3604-00.4671 | 9.62 | 9.65 | 9.60 | 9.69 | 9.66 | 9.61 | 9.63 | |
| Tr14-127 | 2.52 | 33.0 | 4.74 | 2.77 | G287.4388-00.6131 | 9.44 | 9.25 | 9.18 | 9.04 | 9.09 | 8.64 | ||
| CPD-58 2627 | 2.00 | 32.0 | 4.52 | 1.86 | G287.3936-00.5211 | 9.43 | 9.45 | 9.59 | |||||
| Tr14-124 | 1.84 | 26.0 | 4.15 | 2.24 | G287.4435-00.5999 | 10.16 | 9.97 | 9.92 | 9.84 | 9.69 | 8.73 | I3 | |
| HD 305520 | 1.47 | 26.0 | 5.01 | 2.00 | G287.6353-00.9603 | 7.95 | 7.84 | 7.70 | 7.62 | 7.63 | 7.59 | 7.57 | |
| HD 93160 | 1.48 | 38.0 | 5.70 | 2.01 | G287.4408-00.5884 | 7.18 | 7.14 | 7.08 | 6.98 | 7.05 | 6.87 | 6.92 | |
| HD 305536 | 1.25 | 31.5 | 4.83 | 1.35 | G287.6735-01.0092 | 8.71 | 8.74 | 8.67 | 8.65 | 8.66 | 8.67 | ||
| Tr16-245 | 2.88 | 29.5 | 4.57 | 3.44 | G287.5190-00.7061 | 9.86 | 9.54 | 9.41 | 9.25 | 9.22 | 9.21 | 9.43 | |
| Tr16-246 | 2.40 | 28.0 | 4.33 | 2.98 | G287.5200-00.7039 | 10.18 | 9.89 | 9.76 | 9.65 | 9.65 | 9.71 | 9.62 | |
| HD 305522 | 1.18 | 28.0 | 4.44 | 1.39 | G287.6552-00.9573 | 9.36 | 9.31 | 9.26 | 9.28 | 9.32 | 9.26 | 9.34 | |
| LS 1837 | 1.16 | 26.0 | 3.88 | 1.11 | G287.7270-01.0886 | 10.42 | 10.48 | 10.37 | 10.36 | 10.56 | 10.40 | 10.40 | |
| Tr16-11 | 1.56 | 24.0 | 3.77 | 1.61 | G287.5076-00.6457 | 10.66 | 10.55 | 10.51 | 10.51 | 10.40 | 9.96 | 8.60 | I3,I4 |
| QZ Car | 1.50 | 30.5 | 6.23 | 2.21 | G287.6659-00.9423 | 5.55 | 5.39 | 5.25 | 5.01 | 5.06 | 4.98 | ||
| LS 1840 | 1.84 | 26.0 | 3.98 | 1.72 | G287.4427-00.5136 | 10.31 | 10.26 | 10.27 | 10.27 | 10.26 | 10.19 | 10.16 | |
| Tr14-122 | 1.64 | 24.0 | 3.74 | 1.75 | G287.4642-00.5503 | 10.71 | 10.63 | 10.61 | 10.57 | 10.55 | 10.54 | ||
| Tr16-94 | 1.40 | 24.0 | 4.14 | 1.30 | G287.5276-00.6656 | 9.60 | 9.58 | 9.57 | 9.56 | 9.57 | 9.56 | 9.45 | |
| Tr16-18 | 1.56 | 21.0 | 3.31 | 1.65 | G287.5442-00.6856 | 11.43 | 11.28 | 11.29 | 11.19 | 11.23 | 10.95 | 10.59 | I3,I4 |
| Tr15-26 | 1.64 | 26.0 | 3.94 | 1.43 | G287.3689-00.3543 | 10.33 | 10.31 | 10.34 | 10.31 | 10.33 | 10.27 | 10.22 | |
| Tr16-12 | 2.24 | 26.0 | 3.98 | 2.26 | G287.5142-00.6272 | 10.54 | 10.37 | 10.28 | 10.29 | 10.33 | 10.12 | ||
| HD 305523 | 1.78 | 31.0 | 5.24 | 1.97 | G287.6601-00.9021 | 7.78 | 7.69 | 7.63 | 7.55 | 7.58 | 7.55 | 7.57 | |
| Tr16-10 | 2.12 | 29.5 | 4.84 | 2.41 | G287.5068-00.6087 | 8.84 | 8.67 | 8.58 | 8.55 | 8.55 | 8.41 | 7.99 | I4 |
| Tr16-17 | 1.80 | 26.0 | 4.05 | 1.83 | G287.5400-00.6709 | 10.24 | 10.17 | 10.17 | 10.03 | 10.09 | 9.85 | ||
| Tr15-23 | 2.08 | 29.5 | 4.07 | 1.87 | G287.3826-00.3725 | 10.49 | 10.44 | 10.46 | 10.52 | 10.38 | 10.45 | 10.51 | |
| HD 93204 | 1.56 | 40.0 | 5.39 | 1.70 | G287.5656-00.7110 | 8.03 | 7.99 | 7.97 | 7.87 | 7.92 | 7.91 | 7.86 | |
| Tr15-25 | 1.52 | 15.0 | 2.59 | 1.39 | G287.3800-00.3590 | 12.07 | 12.00 | 11.98 | 11.87 | 11.72 | |||
| Tr16-13 | 1.88 | 26.0 | 4.01 | 1.70 | G287.5347-00.6503 | 10.24 | 10.21 | 10.17 | 10.01 | 9.52 | 8.20 | I3,I4 | |
| HD 93205 | 1.56 | 45.0 | 5.79 | 1.60 | G287.5662-00.7058 | 7.39 | 7.39 | 7.34 | 7.30 | 7.29 | 7.29 | 7.31 | |
| Tr15-20 | 2.28 | 33.0 | 3.70 | 2.35 | G287.4066-00.3982 | 11.90 | 11.79 | 11.80 | 11.69 | 11.72 | 11.66 | 11.32 | |
| Tr15-19 | 2.32 | 33.0 | 3.70 | 2.33 | G287.4091-00.3992 | 11.91 | 11.79 | 11.76 | 11.70 | 11.64 | 11.56 | ||
| HD 93222 | 1.37 | 36.0 | 5.46 | 1.74 | G287.7363-01.0159 | 7.59 | 7.50 | 7.44 | 7.45 | 7.42 | 7.42 | 7.35 | |
| Tr15-18 | 5.52 | 31.0 | 5.61 | 5.66 | G287.4158-00.4098 | 8.04 | 7.55 | 7.16 | 7.06 | 6.90 | 6.76 | 6.76 | |
| Tr16-21 | 2.82 | 35.0 | 4.86 | 3.11 | G287.5969-00.7506 | 9.38 | 9.14 | 9.01 | 8.98 | 8.95 | 8.89 | 8.93 | |
| LS 1853 | 3.48 | 26.0 | 5.50 | 4.03 | G287.6510-00.8524 | 7.29 | 6.95 | 6.72 | 6.79 | 6.54 | 6.44 | 6.38 | |
| Coll228-36 | 1.34 | 28.0 | 4.26 | 1.57 | G287.7040-00.9522 | 9.85 | 9.79 | 9.74 | 9.78 | 9.73 | 9.76 | 9.66 | |
| Tr16-14 | 2.28 | 28.0 | 4.14 | 2.56 | G287.5396-00.6400 | 10.52 | 10.37 | 10.27 | 9.85 | 9.16 | 8.07 | I2,I3 | |
| HD 303311 | 1.72 | 41.0 | 5.15 | 1.59 | G287.4847-00.5352 | 8.59 | 8.59 | 8.56 | 8.58 | 8.62 | 8.63 | ||
| Tr15-21 | 1.92 | 29.5 | 3.45 | 2.38 | G287.4087-00.3905 | 12.32 | 12.19 | 12.13 | 11.94 | 11.94 | |||
| Tr16-20 | 1.40 | 26.0 | 4.06 | 1.22 | G287.6063-00.7595 | 9.96 | 9.97 | 10.02 | 9.97 | 9.97 | 9.98 | 10.02 | |
| Tr16-16 | 2.04 | 26.0 | 4.19 | 2.09 | G287.5593-00.6633 | 9.92 | 9.79 | 9.77 | 9.75 | 9.72 | 9.68 | 9.69 | |
| Tr15-4 | 1.68 | 26.0 | 3.88 | 1.58 | G287.3995-00.3598 | 10.52 | 10.49 | 10.52 | 10.52 | 10.32 | 9.83 | I3 | |
| Tr15-14 | 1.86 | 19.0 | 3.77 | 1.63 | G287.4092-00.3781 | 9.91 | 9.87 | 9.80 | 9.81 | 9.57 | 9.20 | 8.51 | I3,I4 |
| Tr16-15 | 2.08 | 29.5 | 4.38 | 2.79 | G287.5478-00.6384 | 10.11 | 9.90 | 9.87 | 9.73 | 9.74 | 9.66 | 9.60 | |
| Tr16-100 | 1.96 | 39.0 | 5.50 | 2.18 | G287.6020-00.7374 | 7.80 | 7.73 | 7.64 | 7.64 | 7.62 | 7.58 | 7.53 | |
| Tr15-13 | 2.08 | 26.0 | 4.02 | 1.74 | G287.4123-00.3771 | 10.26 | 10.21 | 10.20 | 10.16 | 9.97 | 9.35 | 8.26 | I3,I4 |
| Tr15-15 | 1.68 | 28.0 | 4.33 | 1.56 | G287.4171-00.3851 | 9.56 | 9.52 | 9.51 | 9.56 | 9.61 | 9.63 | 9.64 | |
| Tr15-9 | 2.32 | 26.0 | 3.46 | 2.17 | G287.4092-00.3701 | 11.75 | 11.67 | 11.61 | 11.61 | 11.59 | 11.48 | ||
| Tr15-7 | 1.98 | 19.0 | 3.78 | 1.61 | G287.4084-00.3668 | 9.79 | 9.72 | 9.68 | 9.72 | 9.73 | 9.72 | 9.81 | |
| Tr15-2 | 1.84 | 31.0 | 4.67 | 1.63 | G287.4059-00.3575 | 9.04 | 8.99 | 9.02 | 9.07 | 9.05 | 8.99 | 8.89 | |
| HD 93249 | 1.60 | 32.0 | 5.11 | 1.53 | G287.4071-00.3593 | 8.02 | 8.06 | 7.99 | 8.04 | 7.99 | 7.98 | 7.94 | |
| Tr15-3 | 1.56 | 21.0 | 3.81 | 1.46 | G287.4092-00.3606 | 10.12 | 10.02 | 10.08 | 10.00 | 10.02 | 9.73 | ||
| HD 93250 | 1.92 | 42.0 | 5.95 | 1.87 | G287.5065-00.5423 | 6.78 | 6.72 | 6.71 | 6.95 | 6.68 | 6.65 | 6.59 | |
| HD 305524 | 2.12 | 37.0 | 5.12 | 2.12 | G287.6688-00.8482 | 8.53 | 8.43 | 8.37 | 8.37 | 8.41 | 8.33 | 8.38 | |
| Tr15-10 | 1.96 | 21.0 | 3.49 | 1.70 | G287.4158-00.3637 | 10.87 | 10.88 | 10.58 | 9.20 | I4 | |||
| Tr16-104 | 1.64 | 37.0 | 5.09 | 1.55 | G287.5885-00.6870 | 8.34 | 8.34 | 8.29 | 8.51 | 8.48 | 8.46 | 8.46 | |
| HD 305534 | 1.40 | 28.0 | 4.52 | 1.58 | G287.6986-00.8945 | 9.22 | 9.15 | 9.09 | 9.12 | 9.13 | 9.09 | 9.03 | |
| Tr16-29 | 2.48 | 21.0 | 3.86 | 2.38 | G287.5531-00.5910 | 10.20 | 10.09 | 10.00 | 9.98 | 9.84 | 8.91 | I3 | |
| Tr16-5 | 1.92 | 26.0 | 4.03 | 1.81 | G287.5824-00.6450 | 10.21 | 10.15 | 10.16 | 10.07 | 10.05 | |||
| LS 1865 | 1.81 | 34.0 | 4.74 | 2.08 | G287.6967-00.8587 | 9.34 | 9.18 | 9.10 | 9.10 | 9.13 | 8.97 | 9.19 | |
| Tr16-31 | 1.84 | 28.0 | 4.33 | 1.89 | G287.5209-00.5186 | 9.68 | 9.63 | 9.60 | 9.53 | 9.55 | 9.55 | 9.84 | |
| LS 1866 | 1.66 | 21.0 | 3.94 | 1.95 | G287.7385-00.9262 | 10.05 | 9.89 | 9.77 | 9.75 | 9.67 | 9.66 | 9.32 | |
| Tr16-26 | 1.76 | 24.0 | 3.79 | 2.17 | G287.6069-00.6652 | 10.86 | 10.66 | 10.51 | 10.45 | 10.32 | 10.05 | 9.43 | I3,I4 |
| Tr16-25 | 1.86 | 21.0 | 3.66 | 2.18 | G287.6100-00.6697 | 10.63 | 10.49 | 10.31 | 10.43 | 10.41 | 10.40 | ||
| Tr16-4 | 1.88 | 26.0 | 3.99 | 1.79 | G287.6015-00.6449 | 10.27 | 10.17 | 10.26 | 10.22 | 10.55 | |||
| Tr16-8 | 1.52 | 28.0 | 4.03 | 1.54 | G287.5893-00.6174 | 10.32 | |||||||
| Tr16-23 | 2.52 | 32.0 | 5.06 | 2.91 | G287.6340-00.6901 | 8.65 | 8.42 | 8.34 | 8.19 | 8.23 | 8.18 | 8.15 | |
| Tr16-9 | 2.12 | 31.5 | 4.86 | 2.23 | G287.6170-00.6576 | 8.92 | 8.80 | 8.76 | 8.67 | 8.70 | 8.55 | 8.73 | |
| Tr16-24 | 1.68 | 21.0 | 3.56 | 1.72 | G287.6263-00.6751 | 10.83 | 10.73 | 10.69 | 10.66 | 10.54 | 10.36 | 10.66 | |
| HD 303308 | 1.80 | 42.0 | 5.57 | 1.72 | G287.5937-00.6129 | 7.71 | 7.71 | 7.62 | 7.58 | 7.69 | |||
| Tr16-3 | 1.97 | 34.0 | 4.64 | 1.96 | G287.6094-00.6393 | 9.45 | 9.41 | 9.36 | 9.33 | ||||
| Tr16-1 | 1.64 | 31.5 | 4.60 | 1.36 | G287.6035-00.6214 | 9.25 | 9.14 | 9.25 | 9.40 | ||||
| Tr16-22 | 3.05 | 34.0 | 4.97 | 3.51 | G287.6447-00.6994 | 9.27 | 8.96 | 8.81 | 8.66 | 8.59 | 8.54 | 8.44 | |
| Tr16-33 | 2.12 | 21.0 | 3.32 | 1.84 | G287.6009-00.6099 | 11.19 | 11.25 | ||||||
| Tr16-74 | 26.0 | 3.86 | 2.14 | G287.6229-00.6512 | 10.74 | 10.68 | 10.62 | 10.56 | 10.53 | 10.17 | |||
| Tr16-2 | 1.52 | 26.0 | 3.99 | 1.60 | G287.6119-00.6238 | 10.37 | 10.21 | 10.14 | 10.11 | ||||
| HD 93343 | 2.10 | 35.0 | 5.06 | 2.33 | G287.6434-00.6791 | 8.68 | 8.54 | 8.43 | 8.37 | 8.39 | 8.36 | 8.41 | |
| Tr16-76 | 2.64 | 21.0 | 4.04 | 2.54 | G287.6272-00.6463 | 9.83 | 9.65 | 9.53 | 9.46 | 9.45 | 9.44 | ||
| Tr16-34 | 2.06 | 35.0 | 5.21 | 2.37 | G287.6425-00.6751 | 8.33 | 8.18 | 8.09 | 8.01 | 8.00 | 7.97 | 8.03 | |
| Tr16-110 | 2.32 | 37.0 | 5.40 | 2.74 | G287.6393-00.6683 | 8.08 | 7.89 | 7.76 | 7.69 | 7.69 | 7.65 | 7.72 | |
| HD 305533 | 1.76 | 28.0 | 4.48 | 2.33 | G287.7457-00.8681 | 9.62 | 9.47 | 9.30 | 9.34 | 9.21 | 8.92 | ||
| Tr16-112 | 2.36 | 41.0 | 5.51 | 2.68 | G287.6407-00.6544 | 8.15 | 7.99 | 7.88 | 7.77 | 7.73 | 7.71 | 7.74 | |
| HD 305528 | 1.36 | 21.0 | 3.81 | 1.24 | G287.7275-00.8186 | 9.96 | 9.99 | 9.97 | 9.86 | 9.97 | 9.95 | 9.96 | |
| HD 93342 | 3.18 | 26.0 | 5.45 | 3.52 | G287.4875-00.3585 | 7.30 | 6.97 | 6.80 | 6.97 | 6.58 | 6.44 | 6.45 | |
| Tr16-55 | 1.92 | 24.0 | 3.49 | 1.97 | G287.6151-00.5926 | 11.40 | 11.31 | 11.28 | 11.26 | 11.20 | 11.20 | 11.14 | |
| Tr16-115 | 1.68 | 31.5 | 4.63 | 1.94 | G287.6423-00.6392 | 9.39 | 9.31 | 9.26 | 9.19 | 9.26 | 9.21 | 9.20 | |
| Tr16-28 | 1.80 | 21.0 | 3.60 | 1.93 | G287.6047-00.5607 | 10.77 | 10.67 | 10.68 | 10.51 | 10.45 | 10.35 | 9.69 | I4 |
| HD 305532 | 2.48 | 39.0 | 5.15 | 2.80 | G287.7803-00.8413 | 8.87 | 8.66 | 8.54 | 8.47 | 8.56 | 8.46 | 8.52 | |
| FO 15 | 4.61 | 40.0 | 5.31 | 4.96 | G287.7144-00.7055 | 9.29 | 8.81 | 8.50 | 8.32 | 8.36 | 8.24 | 8.36 | |
| HD 93403 | 2.06 | 40.0 | 5.95 | 1.95 | G287.5439-00.3448 | 6.64 | 6.61 | 6.54 | 6.70 | 6.49 | 6.47 | 6.46 | |
| HD 305538 | 2.06 | 29.5 | 4.23 | 1.70 | G287.8634-00.9441 | 10.03 | 10.13 | 10.05 | 9.98 | 9.99 | |||
| Coll228-81 | 1.76 | 28.0 | 4.10 | 1.85 | G287.8794-00.9432 | 10.41 | 10.32 | 10.28 | 10.30 | 10.11 | 9.79 | ||
| CPD-59 2661 | 2.32 | 31.5 | 4.60 | 2.91 | G287.8138-00.8166 | 9.93 | 9.66 | 9.44 | 9.24 | 9.06 | 8.45 | 6.82 | I3,I4 |
| HD 305525 | 3.52 | 42.0 | 5.59 | 3.64 | G287.7878-00.7129 | 8.18 | 7.96 | 7.77 | 7.74 | 7.78 | 7.71 | 7.70 | |
| HD 93501 | 1.20 | 24.0 | 4.49 | 1.30 | G287.8989-00.8522 | 8.72 | 8.64 | 8.56 | 8.75 | 8.76 | 8.68 | 8.68 | |
| LS 1892 | 2.84 | 41.0 | 5.29 | 3.28 | G287.8383-00.7339 | 8.77 | 8.56 | 8.42 | 8.34 | 8.36 | 8.31 | 8.30 | |
| LS 1893 | 1.38 | 29.5 | 4.09 | 1.66 | G287.9622-00.9585 | 10.43 | 10.39 | 10.35 | 10.45 | 10.27 | 10.10 | 9.42 | I3,I4 |
| HD 305539 | 2.36 | 37.0 | 4.90 | 2.16 | G287.9415-00.8844 | 9.01 | 8.95 | 8.92 | 8.94 | 8.91 | 8.95 | 9.01 | |
| HD 303304 | 2.48 | 37.0 | 5.28 | 2.85 | G287.7373-00.4796 | 8.39 | 8.25 | 8.14 | 8.06 | 8.06 | 7.98 | 7.86 | |
| HD 93576 | 2.08 | 32.0 | 4.83 | 2.01 | G287.9836-00.8717 | 8.88 | 8.87 | 8.77 | 8.76 | 8.76 | 8.62 | 8.76 | |
| HD 93620 | 1.18 | 21.0 | 4.28 | 1.22 | G287.8802-00.6024 | 8.80 | 8.82 | 8.78 | 8.79 | 8.83 | 8.72 | 8.68 | |
| HD 93632 | 2.40 | 40.0 | 5.87 | 2.72 | G288.0270-00.8708 | 7.19 | 7.06 | 6.85 | 6.78 | 6.84 | 6.77 | 6.70 | |
| Coll228-89 | 0.72 | 21.0 | 3.57 | 0.69 | G288.0871-00.9845 | 10.42 | 10.43 | 10.53 | 10.52 | 10.51 | 10.57 | ||
| HD 93632B | 1.48 | 21.0 | 3.88 | 1.45 | G288.0317-00.8716 | 9.89 | 9.79 | 9.75 | 9.71 | 9.77 | 9.79 | 9.86 | |
| Bo11-5 | 2.72 | 33.0 | 4.78 | 2.95 | G288.0304-00.8653 | 9.40 | 9.15 | 9.02 | 8.97 | 9.04 | 8.94 | 9.00 | |
| HD 305612 | 2.16 | 33.0 | 4.87 | 2.59 | G288.0326-00.8645 | 9.12 | 8.89 | 8.76 | 8.77 | 8.77 | 8.67 | 8.74 | |
| HD 303402 | 2.20 | 26.0 | 4.22 | 2.07 | G287.7464-00.2975 | 9.78 | 9.69 | 9.66 | 9.65 | 9.67 | 9.68 | 9.68 | |
| LS 1914 | 1.60 | 28.0 | 4.00 | 1.86 | G288.0454-00.8634 | 10.59 | 10.48 | 10.41 | 10.41 | 10.33 | 10.37 | 10.54 | |
| HD 93695 | 0.22 | 17.5 | 4.80 | 0.23 | G287.9839-00.6430 | 6.69 | 6.82 | 6.80 | 6.86 | 6.91 | 6.90 | 6.88 | |
| HD 93723 | 0.76 | 17.5 | 4.18 | 0.74 | G287.9138-00.4268 | 8.38 | 8.43 | 8.43 | 8.45 | 8.54 | 8.48 | 8.45 | |
| HD 305619 | 2.71 | 30.5 | 5.30 | 3.05 | G288.2199-00.9608 | 7.96 | 7.77 | 7.62 | 7.51 | 7.54 | 7.47 | 7.41 | |
| HD 93843 | 1.05 | 40.0 | 5.64 | 1.17 | G288.2418-00.9025 | 7.23 | 7.27 | 7.23 | 7.31 | 7.30 | 7.26 | 7.15 | |
| HD 93873 | 2.57 | 26.0 | 5.60 | 2.60 | G287.9216-00.1936 | 6.58 | 6.54 | 6.32 | 6.30 | 6.17 | 6.08 | ||
| HD 303413 | 1.68 | 26.0 | 4.40 | 1.60 | G288.0371-00.4031 | 9.25 | 9.17 | 9.12 | 9.19 | 9.22 | 9.16 | 9.21 | |
| HD 305602 | 1.88 | 21.0 | 4.02 | 1.62 | G288.1487-00.5765 | 9.61 | 9.51 | 9.45 | 9.53 | 9.47 | 9.43 | 9.34 | |
| HD 93911 | 1.52 | 19.0 | 4.72 | 1.72 | G288.2901-00.8336 | 7.59 | 7.49 | 7.45 | 7.34 | 7.42 | 7.34 | 7.27 | |
| HD 305599 | 2.24 | 29.5 | 4.64 | 2.15 | G288.1504-00.5059 | 9.20 | 9.14 | 9.01 | 9.07 | 9.08 | 8.92 | ||
| HD 305606 | 0.84 | 21.0 | 3.57 | 0.73 | G288.2415-00.6818 | 10.43 | 10.42 | 10.45 | 10.57 | 10.61 | 10.51 | 10.51 | |
| (1) | (2) | (3)bbValues in columns (3)–(5) were derived from SED fitting under the assumption of single massive stars on the theoretical zero-age main sequence (see text). Formally, the , and reported here are upper limits and should be used only for comparison purposes among this sample. | (4)bbValues in columns (3)–(5) were derived from SED fitting under the assumption of single massive stars on the theoretical zero-age main sequence (see text). Formally, the , and reported here are upper limits and should be used only for comparison purposes among this sample. | (5)bbValues in columns (3)–(5) were derived from SED fitting under the assumption of single massive stars on the theoretical zero-age main sequence (see text). Formally, the , and reported here are upper limits and should be used only for comparison purposes among this sample. | (6) | (7)–(13) | (14) | ||||||
|---|---|---|---|---|---|---|---|---|---|---|---|---|---|
| OBc | [3.6] | [4.5] | [5.8] | [8.0] | Other ID/Sp.T.ddPrevious star identifications come from the following sources: HD = Nesterov et al. (1995); Y = Cudworth et al. (1993); Cr 228 (Collinder 228) = Feinstein et al. (1976) or Thé et al. (1980); IRS = Smith (1987); MJ = Massey & Johnson (1993); XMM = Antokhin et al. (2008); Bo 11 (Bochum 11) = Fitzgerald & Mehta (1987); and LS = Stephenson & Sanduleak (1971). Candidate massive stars or candidate low-mass PMS stars (Evans et al., 2003; Sanchawala et al., 2007) are indicated by spectral types OB or PMS, respectively. NOP means that the star was not found in any of optical photometric catalogs listed by VizieR (Ochsenbein et al., 2000). PFD indicates that a candidate OB star is also consistent with a foreground MS classification. | ||||||||
| No. | CXOGNC JaaCCCP Catalog identifier (Broos et al., 2011a). | (kK) | () | (mag) | SSTGLMCccSpitzer Vela–Carina Point Source Catalog identifier. | (mag) | (mag) | (mag) | (mag) | (mag) | (mag) | (mag) | or IRE?eeSource exhibits marginal IR excess emission in the specified IRAC band(s): I2 = 4.5 m, I3 = 5.8 m, and I4 = 8.0 m. |
| 1 | 103909.94-594714.5 | 40.3 | 5.4 | 3.6 | G286.9928-01.0735 | 8.61 | 8.03 | 7.89 | 7.95 | 7.97 | 7.93 | 7.90 | |
| 2 | 104014.67-595654.4 | 32.8 | 4.8 | 3.0 | G287.1891-01.1488 | 9.51 | 9.14 | 9.02 | 8.98 | 9.04 | 9.02 | 9.06 | |
| 3 | 104023.46-595039.0 | 26.1 | 4.1 | 3.2 | G287.1549-01.0488 | 10.59 | 10.31 | 10.13 | 10.04 | 10.03 | 10.07 | 10.08 | |
| 4 | 104044.15-594934.8 | 34.3 | 4.9 | 9.8 | G287.1844-01.0122 | 11.38 | 10.33 | 9.77 | 9.30 | 9.15 | 9.00 | 8.87 | |
| 5 | 104059.29-592724.9 | 36.2 | 5.1 | 4.9 | G287.0350-00.6729 | 9.50 | 9.00 | 8.71 | 8.64 | 8.50 | 8.54 | 8.52 | |
| 6 | 104109.05-594359.3 | 28.9 | 4.4 | 3.4 | G287.1856-00.9056 | 10.28 | 9.80 | 9.68 | 9.70 | 9.74 | 9.60 | 9.62 | |
| 7 | 104118.94-593544.5 | 26.0 | 4.1 | 3.7 | G287.1379-00.7747 | 10.87 | 10.34 | 10.18 | 10.03 | 10.18 | 10.03 | 10.25 | |
| 8 | 104125.96-592319.6 | 36.0 | 5.1 | 7.2 | G287.0518-00.5859 | 10.37 | 9.39 | 9.06 | 8.77 | 8.84 | 8.73 | 8.58 | |
| 9 | 104151.03-600239.1 | 41.2 | 5.5 | 3.5 | G287.4113-01.1367 | 8.38 | 7.89 | 7.78 | 7.74 | 7.85 | 7.79 | 7.73 | HD 305449/G5 |
| 10 | 104154.91-594123.6 | 26.9 | 4.2 | 4.0 | G287.2494-00.8213 | 10.83 | 10.26 | 10.04 | 10.18 | 10.04 | 10.02 | 9.92 | |
| 11 | 104204.67-595457.2 | 29.8 | 4.5 | 3.5 | G287.3749-01.0104 | 10.11 | 9.61 | 9.53 | 9.48 | 9.53 | 9.44 | 9.45 | |
| 12 | 104205.01-595317.4 | 44.0 | 5.8 | 3.4 | G287.3626-00.9856 | 7.79 | 7.37 | 7.24 | 7.23 | 7.27 | 7.25 | 7.17 | |
| 13 | 104206.81-593701.7 | 32.1 | 4.7 | 4.2 | G287.2367-00.7453 | 9.97 | 9.49 | 9.31 | 9.18 | 9.26 | 9.13 | 9.14 | |
| 14 | 104214.48-595945.4 | 27.0 | 4.2 | 3.9 | G287.4311-01.0711 | 10.76 | 10.22 | 10.07 | 10.00 | 10.07 | 9.95 | 9.95 | |
| 15 | 104231.48-592444.7 | 28.2 | 4.3 | 2.5 | G287.1855-00.5405 | 10.02 | 9.78 | 9.71 | 9.65 | 9.74 | 9.66 | PFD | |
| 16 | 104239.15-592816.0 | 32.3 | 4.7 | 1.9 | G287.2275-00.5846 | 9.16 | 9.01 | 8.99 | 8.92 | 9.00 | 8.92 | 9.15 | HD 303314/A3, PFD |
| 17 | 104244.85-600502.0 | 33.2 | 4.8 | 3.5 | G287.5285-01.1185 | 9.50 | 9.21 | 9.04 | 8.96 | 9.02 | 8.90 | 8.91 | |
| 18 | 104246.53-601207.0 | 29.0 | 4.4 | 2.7 | G287.5876-01.2207 | 9.94 | 9.67 | 9.60 | 9.57 | 9.54 | 9.55 | 9.56 | HD 305453/B, PFD |
| 19 | 104306.95-591915.0 | 32.1 | 4.7 | 8.5 | G287.2083-00.4242 | 11.45 | 10.27 | 9.80 | 9.49 | 9.52 | 9.36 | 9.38 | |
| 20 | 104325.19-591214.7 | 27.8 | 4.3 | 4.2 | G287.1874-00.3030 | 10.68 | 10.17 | 10.05 | 9.95 | 10.02 | 9.85 | 9.70 | |
| 21 | 104326.46-593724.9 | 27.0 | 4.2 | 1.6 | G287.3877-00.6716 | 9.92 | 9.87 | 9.84 | 9.86 | 9.78 | HD 303315/A2, Y494, PFD | ||
| 22 | 104340.38-601704.0 | 25.8 | 4.0 | 4.8 | G287.7250-01.2408 | 11.28 | 10.60 | 10.44 | 10.24 | 10.27 | 10.24 | 10.18 | |
| 23 | 104340.56-601003.4 | 27.2 | 4.2 | 2.9 | G287.6705-01.1372 | 10.23 | 10.15 | 10.13 | 9.73 | 9.86 | Cr 228-108 | ||
| 24 | 104341.21-593553.3 | 34.7 | 4.9 | 4.2 | G287.4031-00.6344 | 9.54 | 9.19 | 8.97 | 8.87 | 8.82 | 8.75 | 8.72 | |
| 25 | 104344.72-602705.5 | 28.0 | 4.3 | 3.4 | G287.8115-01.3838 | 10.42 | 9.91 | 9.83 | 9.82 | 9.82 | 9.81 | 9.72 | |
| 26 | 104345.96-592933.9 | 32.7 | 4.8 | 3.5 | G287.3625-00.5367 | 9.73 | 9.22 | 9.07 | 8.99 | 9.08 | 8.94 | 9.39 | Y582 |
| 27 | 104347.75-593056.8 | 25.9 | 4.1 | 20.2 | G287.3764-00.5553 | 13.71 | 12.66 | 11.38 | 10.91 | 10.99 | NOP | ||
| 28 | 104349.96-593655.6 | 42.4 | 5.6 | 12.1 | G287.4276-00.6411 | 11.01 | 9.58 | 8.76 | 8.15 | 8.04 | 7.91 | 8.12 | NOP, IRS 79 |
| 29 | 104400.19-601414.0 | 26.9 | 4.2 | 5.9 | G287.7389-01.1797 | 11.49 | 10.62 | 10.38 | 10.17 | 10.23 | 10.13 | 10.09 | |
| 30 | 104401.63-590327.4 | 35.0 | 5.0 | 3.1 | G287.1872-00.1371 | 9.17 | 8.83 | 8.70 | 8.71 | 8.74 | 8.65 | 8.66 | |
| 31 | 104401.80-592434.2 | 27.8 | 4.3 | 2.6 | G287.3529-00.4474 | 10.12 | 9.95 | 9.89 | 9.86 | 9.87 | 9.76 | 9.69 | PFD |
| 32 | 104402.75-593946.0 | 27.2 | 4.2 | 4.8 | G287.4736-00.6702 | 10.96 | 10.36 | 10.19 | 10.06 | 10.04 | 10.00 | 9.79 | Y442 |
| 33 | 104404.07-600017.1 | 41.2 | 5.5 | 3.7 | G287.6366-00.9708 | 8.41 | 7.98 | 7.82 | 7.74 | 7.80 | 7.82 | 7.72 | Cr 228 45 |
| 34 | 104411.16-595242.6 | 33.0 | 4.8 | 2.6 | G287.5904-00.8524 | 9.31 | 9.01 | 8.94 | 8.95 | 8.94 | 8.95 | 8.95 | MJ 253, PFD |
| 35 | 104418.03-600251.7 | 28.2 | 4.3 | 7.6 | G287.6824-00.9951 | 11.73 | 10.77 | 10.30 | 10.05 | 10.02 | 9.94 | 9.86 | NOP |
| 36 | 104426.06-592738.9 | 29.7 | 4.5 | 6.3 | G287.4216-00.4685 | 11.10 | 10.23 | 9.91 | 9.66 | 9.72 | 9.59 | 9.71 | Y297, S07/OB |
| 37 | 104427.81-594521.4 | 42.1 | 5.6 | 3.6 | G287.5637-00.7278 | 8.31 | 7.83 | 7.74 | 7.62 | 7.74 | 7.70 | 7.62 | |
| 38 | 104430.26-592612.9 | 32.7 | 4.8 | 3.5 | G287.4188-00.4434 | 9.61 | 9.35 | 9.15 | 9.20 | 9.14 | 9.00 | 8.99 | |
| 39 | 104430.89-591446.0 | 32.8 | 4.8 | 5.4 | G287.3308-00.2742 | 10.21 | 9.68 | 9.40 | 9.17 | 9.16 | 9.09 | 9.08 | |
| 40 | 104452.43-601610.6 | 27.9 | 4.3 | 2.7 | G287.8493-01.1578 | 10.16 | 9.97 | 9.86 | 9.77 | 9.82 | 9.76 | 9.80 | PFD |
| 41ffOB candidate 41 appears to be responsible for the spectacular X-ray flare discovered by Townsley et al. (2011a). | 104457.51-595429.5 | 33.7 | 4.9 | 3.7 | G287.6900-00.8333 | 9.61 | 9.11 | 8.95 | 8.97 | 9.05 | 8.96 | 8.83 | Cr 228 113,XMM |
| 42 | 104500.90-594718.7 | 39.0 | 5.3 | 33.9 | G287.6404-00.7242 | 14.40 | 12.33 | 10.40 | 9.62 | S07/PMS | |||
| 43 | 104503.61-591815.3 | 38.3 | 5.3 | 3.7 | G287.4196-00.2932 | 8.84 | 8.36 | 8.26 | 8.23 | 8.26 | 8.07 | 8.15 | |
| 44 | 104504.33-595435.2 | 32.8 | 4.8 | 3.8 | G287.7032-00.8282 | 9.78 | 9.27 | 9.14 | 9.16 | 9.12 | 9.06 | 8.96 | MJ 482 |
| 45 | 104507.24-601426.0 | 30.9 | 4.6 | 11.7 | G287.8628-01.1178 | 12.44 | 11.35 | 10.63 | 9.93 | 9.87 | 9.56 | 9.41 | |
| 46 | 104507.50-593344.9 | 30.0 | 4.5 | 4.1 | G287.5474-00.5176 | 10.28 | 9.75 | 9.57 | 9.40 | 9.53 | 9.48 | 9.50 | Y87 |
| 47 | 104511.18-594233.8 | 29.1 | 4.4 | 11.9 | G287.6226-00.6440 | 11.42 | 11.02 | 10.15 | 9.78 | 9.82 | Y188/B | ||
| 48 | 104517.21-594701.6 | 27.2 | 4.2 | 8.1 | G287.6683-00.7040 | 12.05 | 11.09 | 10.61 | 10.25 | 10.13 | 10.13 | ||
| 49 | 104520.42-591706.1 | 35.7 | 5.0 | 3.5 | G287.4423-00.2594 | 9.03 | 8.95 | 8.92 | 8.70 | 8.58 | 8.31 | HD 303300/B3 | |
| 50 | 104522.29-595047.0 | 42.2 | 5.6 | 4.9 | G287.7070-00.7545 | 8.62 | 8.18 | 7.88 | 7.73 | 7.67 | 7.68 | 7.67 | MJ568 |
| 51 | 104528.60-594756.1 | 38.9 | 5.3 | 13.2 | G287.6965-00.7061 | 11.91 | 10.27 | 9.46 | 8.78 | 8.64 | 8.50 | 8.59 | NOP |
| 52 | 104530.22-594821.0 | 42.0 | 5.6 | 10.1 | G287.7028-00.7108 | 10.43 | 9.24 | 8.60 | 8.14 | 7.97 | 8.04 | 7.95 | XMM |
| 53 | 104531.95-600029.1 | 32.1 | 4.7 | 6.1 | G287.7999-00.8884 | 10.55 | 9.90 | 9.57 | 9.31 | 9.26 | 9.17 | 9.32 | |
| 54 | 104533.12-602504.2 | 37.1 | 5.2 | 7.5 | G287.9927-01.2501 | 10.29 | 9.29 | 8.88 | 8.68 | 8.69 | 8.53 | 8.44 | |
| 55 | 104536.45-594410.7 | 38.7 | 5.3 | 7.1 | G287.6824-00.6432 | 9.83 | 9.19 | 8.77 | 8.42 | 8.34 | 8.24 | 8.23 | MJ 594, Y237/PMS |
| 56 | 104536.75-594702.2 | 42.9 | 5.7 | 8.6 | G287.7047-00.6850 | 9.76 | 8.88 | 8.33 | 8.00 | 7.84 | 7.75 | 7.72 | XMM, S07/OB |
| 57 | 104538.70-600426.5 | 26.0 | 4.1 | 2.2 | G287.8430-00.9400 | 10.32 | 10.16 | 10.10 | 10.03 | 10.09 | 10.01 | 10.05 | Cr 228 84, PFD |
| 58 | 104540.66-595345.0 | 33.1 | 4.8 | 20.1 | G287.7640-00.7804 | 15.02 | 12.55 | 11.17 | 10.16 | 9.96 | 9.70 | 9.61 | |
| 59 | 104541.93-601652.1 | 29.1 | 4.4 | 35.6 | G287.9453-01.1205 | 13.91 | 12.12 | 11.33 | 10.78 | 10.58 | NOP | ||
| 60 | 104545.36-595853.0 | 27.0 | 4.2 | 4.9 | G287.8124-00.8516 | 11.00 | 10.56 | 10.35 | 10.11 | 9.94 | 9.31 | I3 | |
| 61 | 104546.64-594840.2 | 26.8 | 4.2 | 6.5 | G287.7357-00.6997 | 11.59 | 10.94 | 10.56 | 10.25 | 10.26 | 10.14 | 10.05 | S07/PMS |
| 62 | 104547.07-600519.5 | 25.9 | 4.1 | 10.2 | G287.8656-00.9446 | 13.07 | 11.63 | 11.07 | 10.48 | 10.45 | HD 305538/B | ||
| 63 | 104549.10-592542.3 | 26.1 | 4.1 | 2.3 | G287.5627-00.3580 | 10.29 | 10.13 | 10.04 | 10.03 | 9.99 | 9.94 | 10.06 | PFD |
| 64 | 104553.14-594440.5 | 30.0 | 4.5 | 11.6 | G287.7170-00.6343 | 12.57 | 11.39 | 10.64 | 10.09 | 9.96 | 9.34 | XMM, NOP | |
| 65 | 104554.99-601212.1 | 32.9 | 4.8 | 3.8 | G287.9332-01.0390 | 9.79 | 9.24 | 9.07 | 9.00 | 9.13 | 9.06 | 9.07 | |
| 66 | 104557.88-600708.6 | 28.7 | 4.4 | 8.4 | G287.8989-00.9613 | 12.03 | 10.80 | 10.36 | 10.06 | 10.00 | 9.93 | 9.95 | |
| 67 | 104615.19-593217.6 | 27.8 | 4.3 | 2.3 | G287.6626-00.4299 | 10.01 | 9.94 | 9.86 | 9.84 | 9.87 | 9.75 | 9.63 | HD 303306/A2, PFD |
| 68 | 104619.06-595754.3 | 29.2 | 4.4 | 3.0 | G287.8671-00.8046 | 9.94 | 9.71 | 9.62 | 9.58 | 9.40 | 9.11 | 8.62 | MJ 685 I3,I4 |
| 69 | 104638.67-601613.3 | 30.2 | 4.5 | 2.7 | G288.0442-01.0566 | 9.67 | 9.45 | 9.36 | 9.37 | 9.37 | 9.33 | 9.21 | HD 305546/G, PFD |
| 70 | 104638.75-593607.8 | 29.9 | 4.5 | 6.2 | G287.7365-00.4631 | 11.00 | 10.10 | 9.82 | 9.63 | 9.69 | 9.60 | 9.51 | |
| 71 | 104652.25-600603.3 | 32.7 | 4.8 | 3.6 | G287.9911-00.8932 | 9.61 | 9.42 | 9.31 | 9.30 | 9.13 | 8.88 | 8.27 | Bo 11 11 |
| 72 | 104658.97-601721.4 | 44.0 | 5.8 | 3.8 | G288.0901-01.0542 | 8.06 | 7.50 | 7.43 | 7.35 | 7.47 | 7.38 | 7.24 | HD 305547/K0 |
| 73 | 104702.99-595019.2 | 28.9 | 4.4 | 3.4 | G287.8904-00.6501 | 10.29 | 9.77 | 9.68 | 9.68 | 9.66 | 9.61 | 9.65 | MJ 760 |
| 74 | 104714.56-601737.7 | 28.2 | 4.3 | 4.0 | G288.1207-01.0436 | 10.59 | 10.03 | 9.90 | 9.82 | 9.93 | 9.76 | 9.67 | |
| 75 | 104735.26-602923.4 | 28.8 | 4.4 | 2.5 | G288.2484-01.1981 | 9.92 | 9.75 | 9.65 | 9.67 | 9.60 | 9.54 | 9.55 | PFD |
| 76 | 104735.79-592953.7 | 25.8 | 4.0 | 4.2 | G287.7956-00.3161 | 11.07 | 10.50 | 10.33 | 10.30 | 10.32 | 10.25 | 10.01 | |
| 77 | 104737.35-602625.1 | 29.7 | 4.5 | 7.2 | G288.2297-01.1523 | 11.33 | 10.51 | 10.06 | 9.83 | 9.74 | 9.64 | ||
| 78 | 104738.07-600724.8 | 26.1 | 4.1 | 6.5 | G288.0860-00.8697 | 11.76 | 10.89 | 10.51 | 10.37 | 10.31 | 10.21 | 10.13 | |
| 79 | 104746.41-602434.5 | 34.7 | 4.9 | 9.6 | G288.2320-01.1167 | 11.36 | 10.23 | 9.60 | 9.17 | 9.00 | 9.01 | 9.14 | |
| 80 | 104754.55-600800.0 | 26.9 | 4.2 | 5.1 | G288.1203-00.8627 | 11.22 | 10.45 | 10.17 | 10.07 | 10.16 | 10.02 | 10.13 | |
| 81 | 104758.74-594517.3 | 26.2 | 4.1 | 3.7 | G287.9557-00.5220 | 10.80 | 10.26 | 10.18 | 9.99 | 10.12 | 10.03 | 10.12 | |
| 82 | 104811.96-595606.6 | 27.8 | 4.3 | 3.9 | G288.0628-00.6698 | 10.62 | 10.11 | 10.01 | 9.94 | 10.02 | 9.85 | 9.70 | |
| 83 | 104826.24-595912.6 | 26.2 | 4.1 | 3.9 | G288.1127-00.7024 | 10.84 | 10.35 | 10.19 | 10.12 | 10.19 | 10.01 | 10.02 | |
| 84 | 104826.62-593020.1 | 28.1 | 4.3 | 3.2 | G287.8946-00.2734 | 10.24 | 9.98 | 9.91 | 9.80 | 9.75 | 9.73 | 9.65 | |
| 85 | 104827.47-592906.0 | 30.7 | 4.6 | 2.1 | G287.8868-00.2542 | 9.45 | 9.32 | 9.29 | 9.23 | 9.32 | 9.23 | 9.28 | HD 303405/A7, PFD |
| 86 | 104836.67-601456.8 | 30.0 | 4.5 | 3.0 | G288.2513-00.9260 | 9.86 | 9.50 | 9.45 | 9.45 | 9.46 | 9.41 | 9.26 | |
| 87 | 104838.92-593002.0 | 33.1 | 4.8 | 3.8 | G287.9154-00.2573 | 9.69 | 9.18 | 9.03 | 8.97 | 9.04 | 8.98 | 8.99 | |
| 88 | 104858.62-595057.4 | 27.2 | 4.2 | 2.5 | G288.1106-00.5491 | 10.20 | 9.95 | 9.88 | 9.80 | 9.89 | 9.91 | 9.82 | PFD |
| 89 | 104914.26-601556.8 | 27.9 | 4.3 | 1.9 | G288.3282-00.9058 | 9.87 | 9.76 | 9.79 | 9.74 | 9.75 | 9.75 | 9.68 | LS 1945/OB, PFD |
| 90 | 104919.78-594337.7 | 27.0 | 4.2 | 1.8 | G288.0948-00.4201 | 10.01 | 9.94 | 9.91 | 9.79 | 9.89 | 9.90 | 9.87 | HD 303416/A0, PFD |
| 91 | 104922.78-594806.0 | 29.1 | 4.4 | 2.2 | G288.1341-00.4837 | 9.78 | 9.59 | 9.50 | 9.55 | 9.54 | 9.55 | 9.47 | PFD |
| 92 | 104923.73-600956.9 | 32.1 | 4.7 | 5.9 | G288.3003-00.8077 | 10.55 | 9.73 | 9.54 | 9.27 | 9.36 | 9.22 | 9.22 | |
| 93 | 104928.17-594355.9 | 31.1 | 4.6 | 4.1 | G288.1128-00.4166 | 10.10 | 9.57 | 9.38 | 9.34 | 9.39 | 9.30 | 9.21 | |
| 94 | 104220.83-590908.6 | 25.0 | 3.9 | 2.4 | G287.0420-00.3225 | 10.62 | 10.30 | 10.24 | 10.16 | 10.23 | 10.12 | 10.40 | PFD |