A Chandra Observation of Supernova Remnant G350.10.3
and Its Central Compact Object
Abstract
We present a new Chandra observation of supernova remnant (SNR) G350.10.3. The high resolution X-ray data reveal previously unresolved filamentary structures and allow us to perform detailed spectroscopy in the diffuse regions of this SNR. Spectral analysis demonstrates that the region of brightest emission is dominated by hot, metal-rich ejecta while the ambient material along the perimeter of the ejecta region and throughout the remnant’s western half is mostly low-temperature, shocked interstellar/circumstellar medium (ISM/CSM) with solar-type composition. The data reveal that the emission extends far to the west of the ejecta region and imply a lower limit of 6.6 pc on the diameter of the source (at a distance of 4.5 kpc). We show that G350.10.3 is likely in the free expansion (ejecta-dominated) stage and calculate an age of years. The derived relationship between the shock velocity and the electron/proton temperature ratio is found to be entirely consistent with that of other SNRs. We perform spectral fits on the X-ray source XMMU J172054.5372652, a candidate central compact object (CCO), and find that its spectral properties fall within the typical range of other CCOs. We also present archival 24 data of G350.10.3 taken with the Spitzer Space Telescope during the MIPSGAL galactic survey and find that the infrared and X-ray morphologies are well-correlated. These results help to explain this remnant’s peculiar asymmetries and shed new light on its dynamics and evolution.
Subject headings:
ISM: individual (G350.10.3) — stars: individual (XMMU J172054.5372652) — stars: neutron — supernova remnants1. Introduction
Observations of young supernova remnants (SNRs) provide our best means of relating the thermodynamic properties of shock waves and ejecta distributions to the mechanics of supernovae and their associated progenitors. Chandra studies of young remnants have yielded some of the most spectacular advances in SNR research and revealed intriguing and unexpected features of these intricate systems.
G350.10.3 is a young, luminous SNR in the inner Galaxy. Its nonthermal and linearly polarized radio emission led to its identification as a SNR by Clark et al. (1973,1975), but a 4.8 GHz Very Large Array radio image (Salter et al. 1986) revealed a bizarre, asymmetric morphology, unlike that of the typical shell-like structures. In subsequent SNR catalogs, the source was either removed or listed as a SNR candidate (Green 1991; Whiteoak & Green 1996). G350.10.3 has been detected with ROSAT and ASCA, where it was labeled 1RXS J172106.9372639 and AX J1721.03726, respectively (Voges et al. 1999, Sugizaki et al. 2001). An observation with XMM-Newton (Gaensler et al. 2008, hereafter G08) revealed the source to be concentrated in a bright clump, coincident with the region of strongest radio emission. The X-ray spectrum was found to be well-fit by a two-component model (XSPEC model VPSHOCK + RAYMOND), consisting of a shocked plasma with electron temperature , ionization timescale and large overabundances of all metals, as well as a collisionally equilibrated, low-temperature () component with solar abundances. The best-fit value for interstellar absorption was . G08 proposed that G350.10.3 is interacting with a molecular cloud seen along its eastern edge in the survey of Bitran et al. (1997). These considerations as well as data from the Southern Galactic Plane Survey (McClure-Griffiths et al. 2005) were used to derive an approximate distance of 4.5 kpc. Henceforth we scale quantities with , the distance in units of 4.5 kpc.
G08 detected an unresolved X-ray source, XMMU J172054.5372652, to the west of the bright emission and proposed it to be a neutron star, likely a central compact object (CCO), associated with G350.10.3. Its spectrum was found to be a good fit to an absorbed blackbody although a power-law model with an unphysically high photon index () provided an acceptable fit as well. G08 carried out a search for possible pulsations but found no periodic signals in the range of 146 ms to 1 hr.
In this paper, we present a detailed study of G350.10.3 and its candidate CCO. In § 2 we summarize the Chandra and Spitzer observations and data reduction. § 3.1 features a discussion of the X-ray and infrared imaging and a comparison of various spectral fits. In § 3.2 we use the parameters derived from the models to analyze the dynamics and evolution of G350.10.3. A discussion of the compact source XMMU J172054.5372652 follows in § 3.3. In § 4 we interpret the results of these investigations and attempt to present a coherent and self-consistent picture of G350.10.3. We conclude with § 5, a summary of our findings.
2. Observations
In order to obtain a high-resolution map of the SNR emission structure, study its spectral properties in unprecedented detail and obtain tighter constraints on the spectral fit parameters, we observed G350.10.3 on 2009 May 21 and 22 for 84 ks with the Advanced CCD Imaging Spectrometer (ACIS-S) on board the Chandra X-ray Observatory (observation ID 10102). Standard data reduction was performed to remove hot pixels and flares, resulting in an effective exposure time of 83 ks. The 24 and 70 images of the spatial region corresponding to G350.10.3 were obtained during MIPSGAL, an infrared survey of the Galactic plane (Carey et al. 2009). The target was observed (in both bands) on 2006 October 06 with the Multiband Infrared Photometer for Spitzer (MIPS) instrument on board the Spitzer Space Telescope. The raw data were calibrated using the standard BCD (basic calibrated data) pipeline to correct for bright pixels and flares resulting in exposure times of 2.6 s (24 ) and 3.15 s (70 ). The 70 data were additionally filtered to mitigate instrumental effects (stimflash latents and residual background drifts). An 8 image was obtained during GLIMPSE, an infrared survey of the inner Milky Way Galaxy (Churchwell et al. 2009). The target was observed on 2004 September 07 with the InfraRed Array Camera (IRAC) on board the Spitzer Space Telescope. The raw data were calibrated using the standard BCD pipeline to correct for hot pixels and flares resulting in an exposure time of 1.2 s.
3. Analysis
3.1. Imaging and Spectroscopy
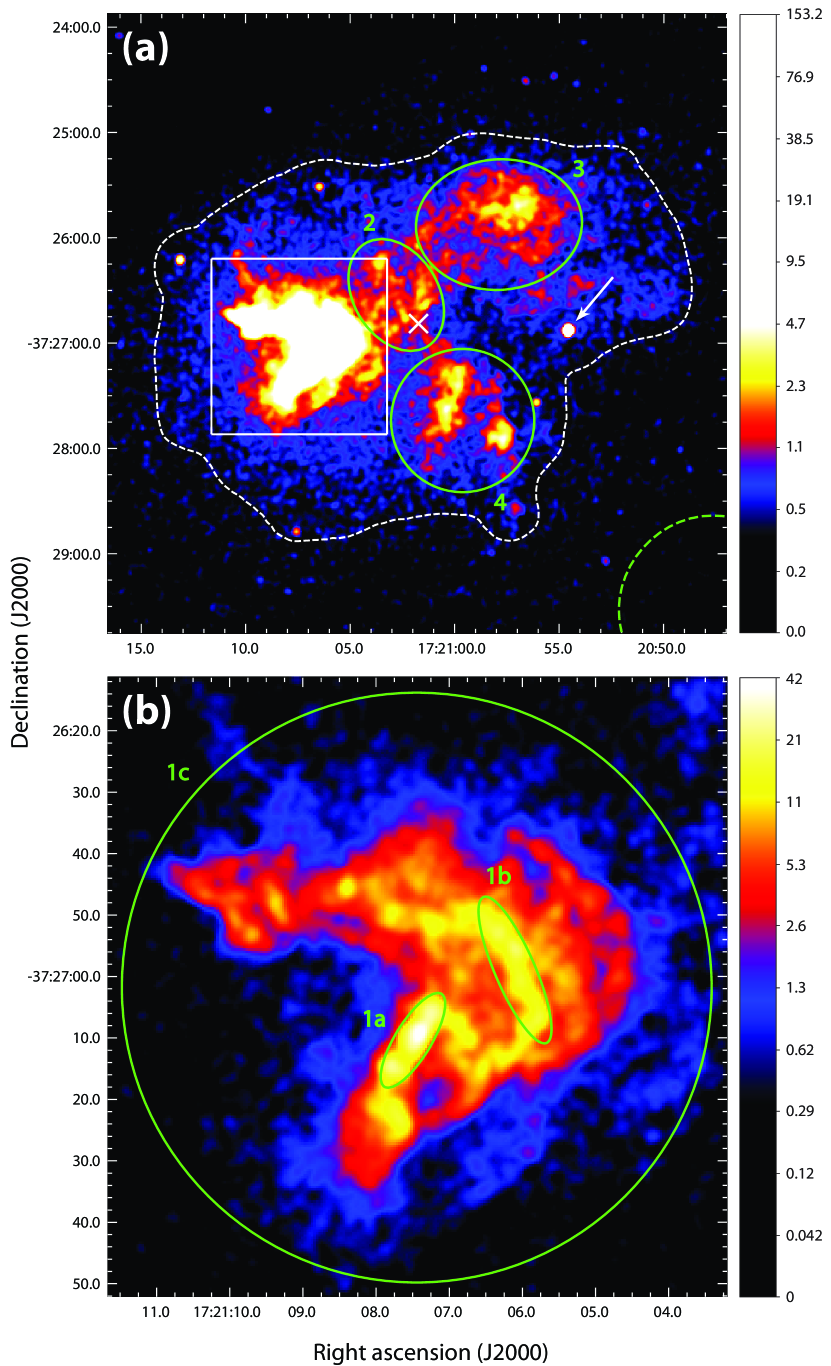
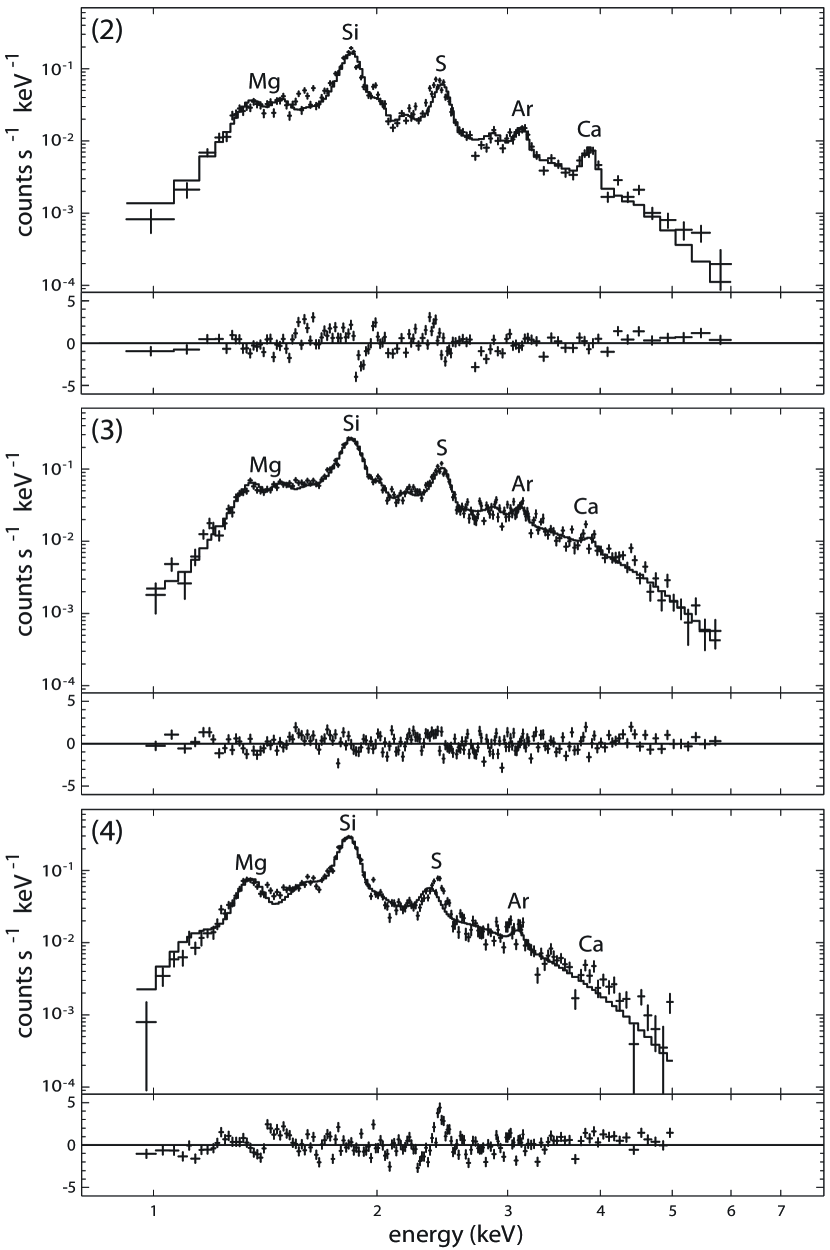
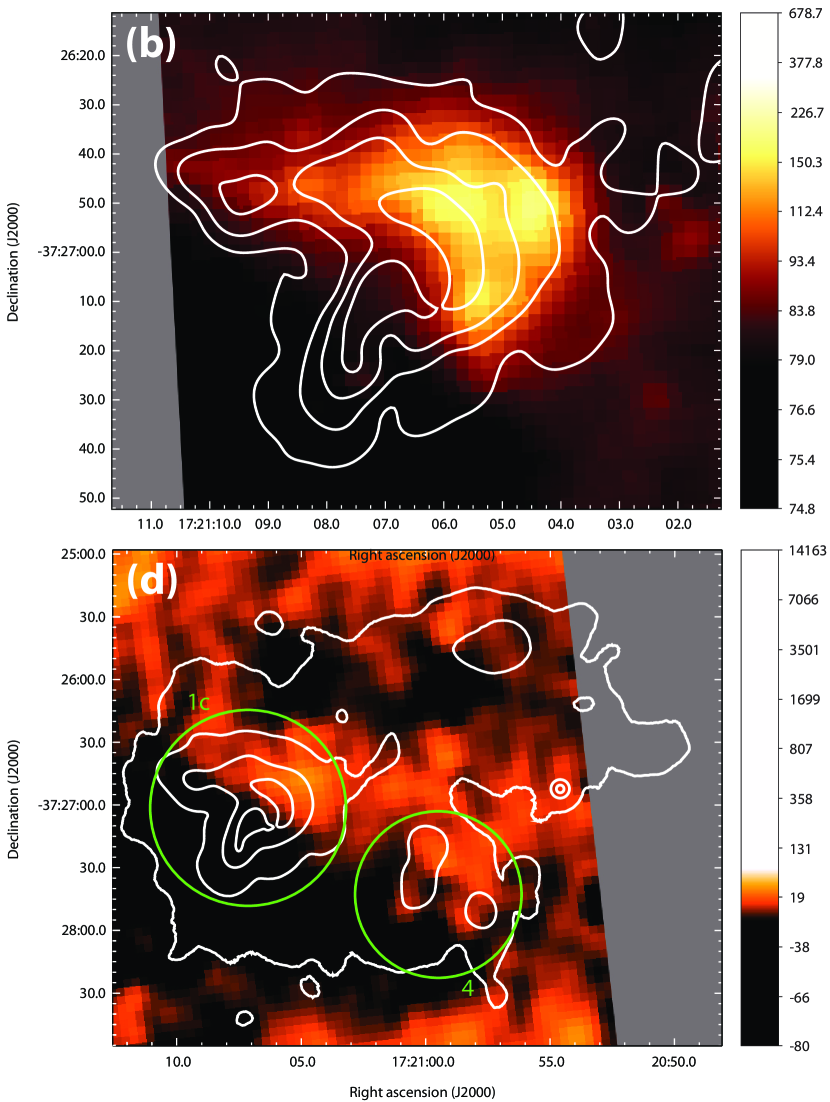
A Chandra image of G350.10.3 is shown in Figure 1a. We filtered the data on the 0.5 - 8.0 keV energy band and smoothed the image by applying a Gaussian kernel with a of 3 pixels (1.48 arcsec). The source is dominated by an extended bright clump of material in the east with fainter emission extending far to the west. The dashed contour, shown in the figure, surrounds the SNR at a level of 3 above the background and indicates the apparent extent of the emission. Throughout our analysis, we adopt a source radius of pc (2.5 arcmin) and assume, following the argument of G08, that . Although the data reveal an elliptical shell-like structure, a large region in the southwest is markedly fainter than the adjacent emission with a flux only a factor of above the background. The unresolved X-ray source XMMU J172054.5372652 (indicated by the arrow in Figure 1a) is seen far to the west of the bright emission, significantly displaced from the apparent center of the SNR (marked by the white cross in Figure 1a). Figure 1b shows the detailed structure of the ejecta region and reveals previously unresolved filamentary structures running across its center. We find that the six regions enumerated in Figures 1a and 1b represent the range of spectral characteristics found in this remnant. The spectra and the corresponding response files were produced using the specextract script in Ciao 4.2. We subtracted the local background spectrum from a source-free region of the detector, partly shown as the dashed region in the southwest corner of Figure 1a, and grouped the data to a minimum of 15 counts per bin. We fit each spectrum by an absorbed nonequilibrium ionization (NEI) plane-parallel shock model with variable abundances (XSPEC model ”VNEI”; Borkowski et al. 2001). Elements below Mg and above Fe were fixed at solar abundances since their contributions in the fitted bandpass are negligible. The uncertainties were calculated at 90% confidence (). Although fixing the absorption at an average global value of produced acceptable fits for regions 1a, 1b, 2, 3 and 4 (the exception is region 1c and is discussed below), we allow to vary in order to account for possible small-scale variations in the absorbing column. The spectra and fitted models for regions 1a, 1b and 1c are shown in Figure 2 with parameters (for regions 1a and 1b) listed in Table 1. The fits for regions 2, 3 and 4 are shown in Figure 3, with parameters listed in Table 1.
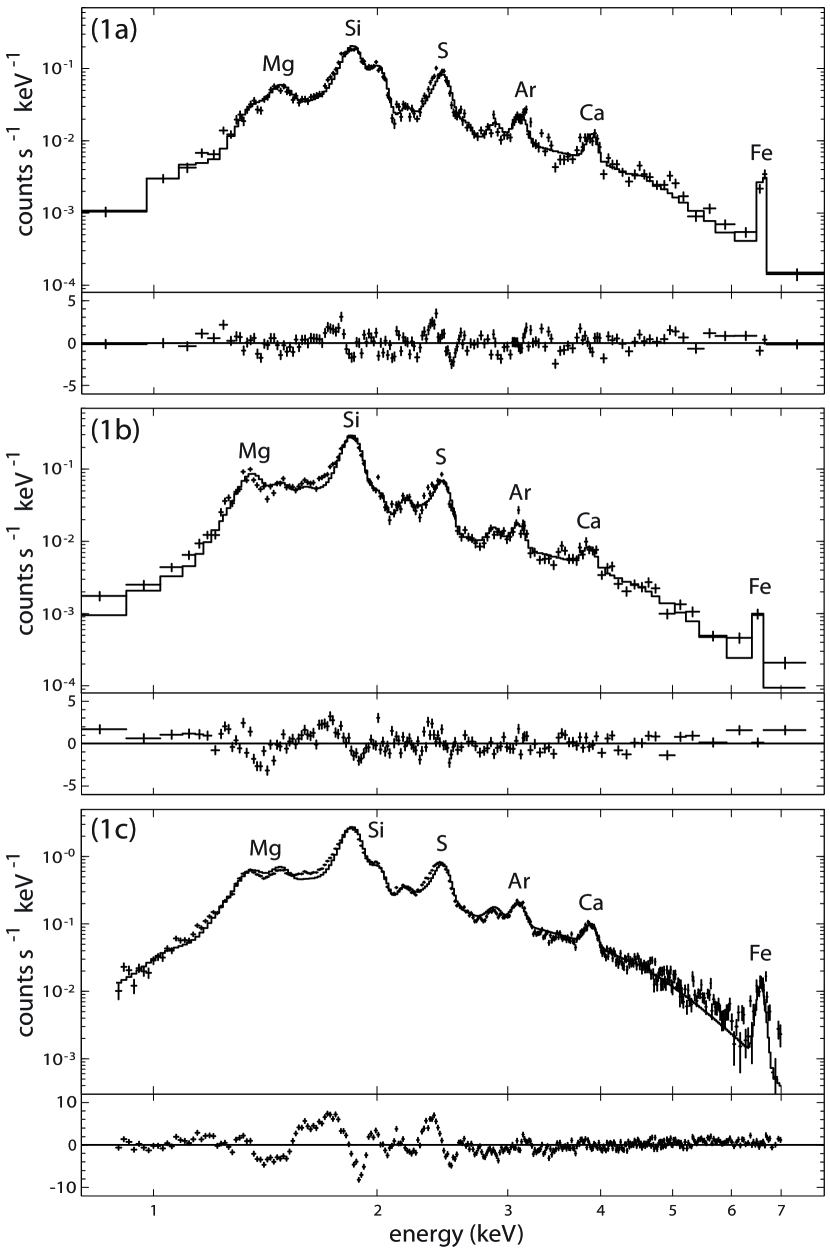
The spectrum of region 1a (extracted from one of the bright filaments in Figure 1b) is roughly representative of that found throughout the bright eastern emission. It can be fit by an absorbed VNEI model with column density , electron temperature , ionization timescale and large overabundances of Mg, Si, S, Ca and Fe. These characteristics unambiguously demonstrate the presence of hot, metal-rich ejecta. The spectrum of region 1b (extracted from the other bright filament) is similar to that of region 1a although the Mg and Si lines clearly indicate a somewhat lower ionization timescale. Although morphologically well-defined, we find that the spectral characteristics of the filaments are basically consistent with the surrounding regions.
| Parameter | Region 1a | Region 1b | Region 2 | Region 3 | Region 4 | |
| aafootnotemark: ( cm-2) | ||||||
| (keV) | ||||||
| Mg | ||||||
| Si | ||||||
| S | ||||||
| Ca | ||||||
| Febbfootnotemark: | (1) | (1) | (1) | |||
| () | ||||||
| Fluxccfootnotemark: () | 8.9 | 8.2 | 5.4 | 11 | 7.2 | |
| /dof | 1.94/157 | 2.16/144 | 1.89/115 | 1.55/178 | 2.27/154 | |
| Note. — All uncertainties are statistical errors at 90% confidence, 1.6. Elements below Mg and above Fe were fixed at solar because their contributions in the fitted bandpass are small | ||||||
| The absorption was calculated using the model of Wilms et al. (2000) | ||||||
| (1) indicates that the elemental abundance was fixed at solar | ||||||
| The values listed are the unabsorbed fluxes over the energy range keV | ||||||
Although G08 found evidence for variations in elemental abundances between nearby regions within the bright eastern emission, our spectral fits of small regions in this vicinity show no significant variations within uncertainties. In order to compare our results with those of the XMM-Newton observation, we attempted to fit the entire ejecta-dominated emission (region 1c: the same area as fitted by G08) using a VNEI model. As can be seen from the high residuals, this model does not provide a good fit, and hence, we do not display the fit parameters. However, the best-fit parameters are roughly consistent with those of regions 1a and 1b, indicating that the extremely large number of X-ray photon counts () and small error bars likely magnify small deficiencies in the model and result in the poor statistics. In addition, it is possible that small variations in temperature and elemental abundances exist, but are not discernible with the statistics in our spectra from small-scale, spatially-resolved regions. Using the two-component model VPSHOCK + RAYMOND (the same as that used by G08 - their fit results are summarized in § 1) for region 1c also fails to provide a good fit. The inconsistencies between our results and those of G08 are likely explained simply by the fact that the long exposure in the Chandra observation exposes weaknesses in the models that were previously hidden due to the fact that the XMM-Newton spectrum has fewer photon counts.
Region 3 is largely representative of the spectral features found along the perimeter of the ejecta region and throughout the remnant’s western half. The spectrum can be described by a VNEI model with absorbing column , electron temperature , ionization timescale and near-solar abundances of all metals. These results suggest an interstellar/circumstellar origin. Although otherwise similar, the fit for region 4 indicates a somewhat lower temperature and an ionization timescale of , lower than that of region 3 by a factor of 20. The centroid of the Si line in the region 4 spectrum is at a slightly lower energy than that of region 3 and since the goodness of fit statistics are dominated by the Si line (the error bars are smallest in this region), it is this feature that causes the drastic difference in the ionization timescale. Region 2, adjacent to the bright eastern emission, has somewhat enhanced abundances of Mg, Si and S and a highly enhanced abundance of Ca. Although similar in temperature to region 3, the overabundance of metals suggests the possible presence of ejecta.
The model histogram for the spectrum of region 4 slightly misses the centroid of the S line complex, suggesting that the several bright patches within this region likely vary in their ionization states. Fitting the individual clumps, however, leads to a similar result with the added handicap of poor statistics in the spectra. We thus present the fit to the composite region with the understanding that a deeper exposure is necessary to characterize the spectrum more precisely. The spectral fits to regions 1b, 2 and 4 do not formally correspond to good fits based on the statistics. In the case of region 1b, this deficiency is due to the fact that the model histogram misses the minimum of the Mg line and is too low on the low-energy shoulder of the Si line. In the region 2 spectrum, the fit is too low on the maximum of the Si line, as can be seen from the high residuals in this area. We acknowledge these weaknesses in the models and use them to simply make qualitative statements about the approximate distribution of elemental abundances, temperatures and ionization states, rather than using them to derive precise numerical results.
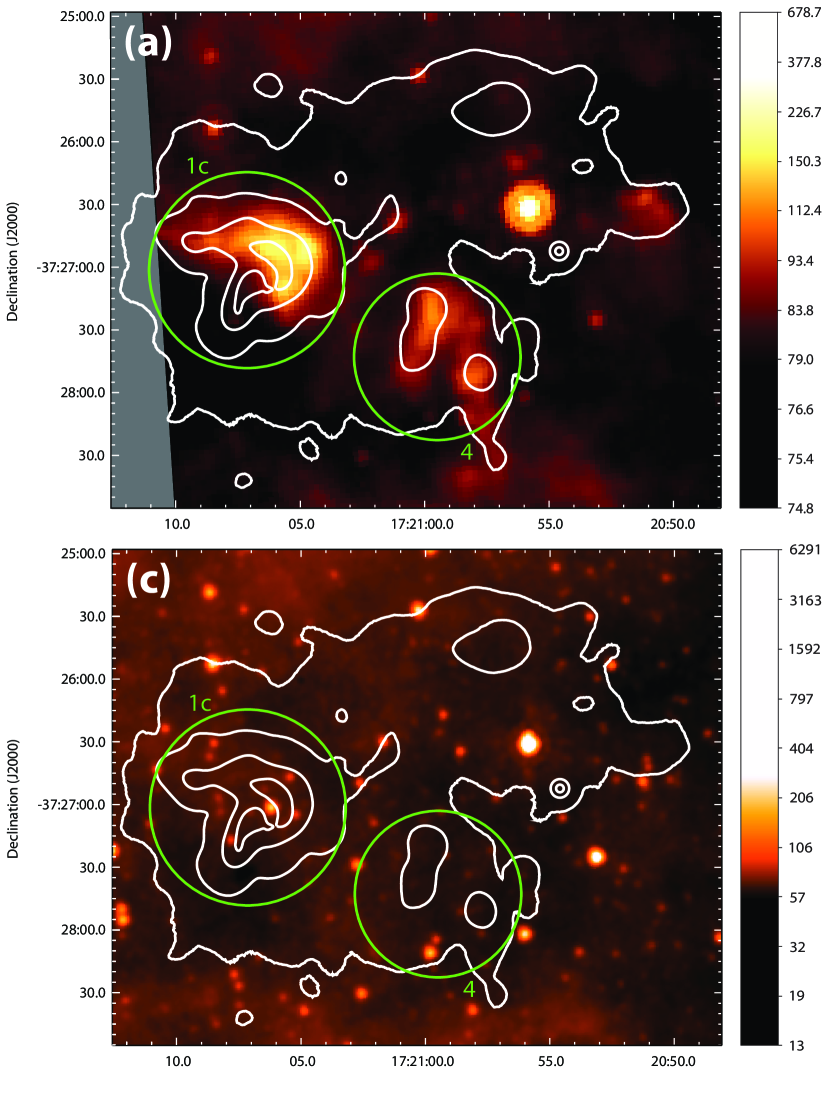
A 24 infrared image of G350.10.3, overlaid with the contours from the X-ray data, is shown in Figure 4a. The two bright clumps in the east and the south correspond to regions 1c and 4 respectively. Most notably, the upper filament from the X-ray image (region 1b) appears to outline precisely the eastern edge of the infrared emission while the lower filament (region 1a) is notably absent at 24 . An enlarged 24 um image of the ejecta- dominated region, overlaid with the X-ray contours, is shown in Figure 4b. While the angular resolution at 24 um is much coarser than that provided by Chandra, these images are sufficiently sensitive to identify two distinct regions of emission with clear morphological similarities to the X-ray emission from the SNR (regions 1c and 4 in Figure 1). Figures 4c and 4d show IRAC 8 and MIPS 70 images of the spatial region corresponding to G350.10.3. We do not detect any significant emission from G350.10.3 at 8 and although we see 70 emission in regions corresponding to the SNR, the emission does not differ significantly from regions in the surrounding medium. With the current resolution we cannot determine whether or not some of the 70 emission is associated with the SNR. We searched the 3.6 , 4.5 and 5.8 IRAC bands but found no apparent emission from G350.10.3 or XMMU J172054.5372652.
3.2. Dynamics and Evolution
We analyze the dynamics and evolution of G350.10.3 using the numerical study of nonradiative SNRs by Truelove and McKee (1999), hereafter TM99. We fit the X-ray spectrum of the SNR’s entire western half by an absorbed VNEI model in order to derive the average post-shock electron density and the mass of the swept-up material. The parameters of the model are roughly intermediate to those of regions 3 and 4. We assume a spherical half-shell with thickness for the geometry and a value of 4 for the compression ratio of post-shock and pre-shock densities. We also take the ratio between the electron and atomic hydrogen densities to be , valid for cosmic abundances. With the normalization parameter from the fit (), we use the relation
| (1) |
where is the estimated volume and is the distance, to derive an approximate post-shock electron density and a corresponding swept-up mass of , with the obvious caveat that the uncertainties are unquantifiable since the visible emission — and hence the observed radius — is only a lower constraint on the true size of the SNR. G08 derived a substantially higher density through two independent methods. However, the first calculation assumes ionization equilibrium, inferred from using a two-component model (which we were unable to fit, as discussed in § 3.1). The second calculation assumes a Sedov solution — an assumption that is likely not valid for reasons discussed below. If the molecular cloud interaction scenario (as proposed by G08) is correct, the density throughout the ejecta-dominated half of the SNR is likely to be higher than that in the western half. Hence, extrapolating our estimate to the eastern half of the SNR (for a total of ) is likely an underestimate of the true swept-up mass, although this figure can be used as a rough lower bound.
For a progenitor with an ejecta density profile (typical of core-collapse supernovae), TM99 demonstrate that the radius and age at which a free-expanding SNR enters the Sedov-Taylor (ST) phase are given by
| (2) |
and
| (3) |
where is the ejecta mass and is the explosion energy. Here is the pre-shock mass density and is given by
| (4) |
where is the mass of the hydrogen atom, 1.4 is the equivalent molecular weight of the hydrogen and helium mixture, (assuming cosmic abundances) and the factors 1.2 and 4 are the electron/hydrogen density ratio and post-shock/pre-shock compression ratio, respectively. Using typical values of for the ejecta mass consistent with the formation of a neutron star (Woosley et al. 2002), we calculate to be pc, somewhat larger than the observed radius for G350.10.3 ( pc). Assuming that the observed radius of the SNR is approximately equal to its true radius (in § 4 we discuss the scenario in which this assumption is not valid), this result suggests that G350.10.3 is likely in the free expansion (ejecta-dominated) stage and has not yet entered the ST phase.
If we make an assumption about the explosion energy, we can determine the age using the relation
| (5) |
as derived from TM99. We explore the parameter space for and ergs and derive an age of years. The shock velocity and proton temperature follow from111This expression for the shock velocity comes from TM99 Table 7. It should be noted, however, that the authors overlooked the minus sign in the exponent.
| (6) |
and
| (7) |
The results of these calculations are summarized in Table 2. Using keV for the electron temperature of the ISM component, the average value from our fits, the inferred electron-to-proton temperature ratio is . This is in excellent agreement with measured values of this ratio for SNR shocks in the inferred velocity range (Ghavamian et al. 2007).
3.3. The Compact Source
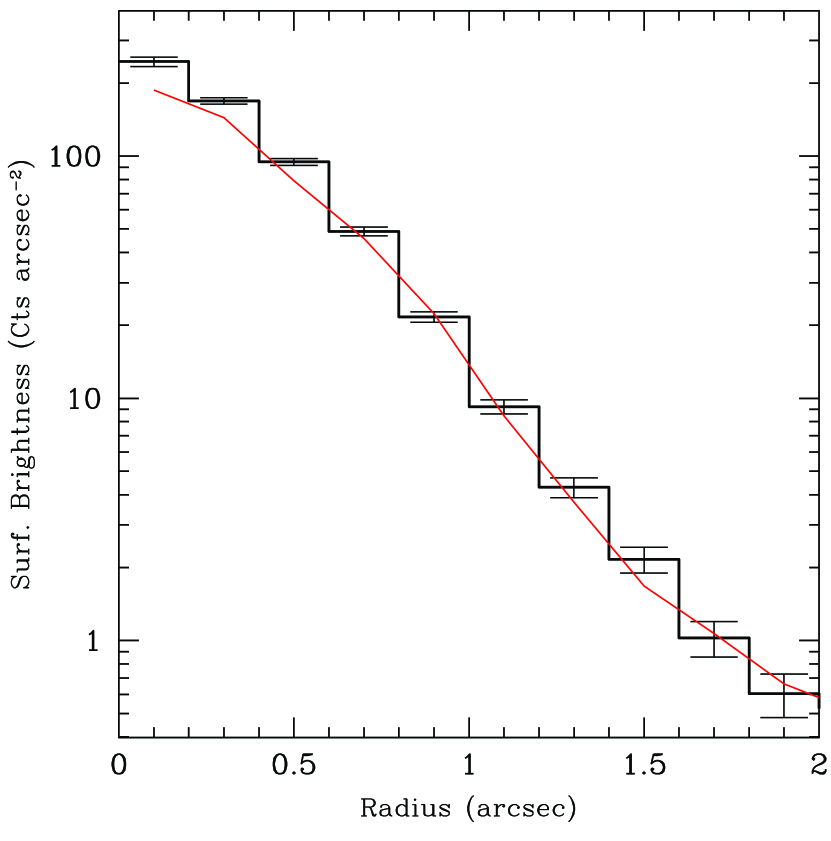
Using the derived age for the remnant, we calculate the projected velocity of XMMU J172054.5372652 to be , assuming a displacement of pc (1.3 arcmin) from the adopted center of the SNR. We generated a lightcurve of XMMU J172054.5372652 but found no short-term flux variation within the Chandra exposure. We applied barycenter corrections to the photon arrival times and searched for periodicity using the -test (Buccheri et al. 1983). No pulsations with period longer than 6.4 s and pulsed fraction larger than 16% were detected at 99% confidence. The Chandra image in Figure 1a shows no extended emission surrounding the CCO and a generated radial profile (Figure 5) of the source confirms that it is fully consistent with a model PSF. As a note, photon pile-up is negligible with a level of less than 5%.
| Parameter | Value | |
|---|---|---|
| Age, , (years) | ||
| Shock Velocity, , () | ||
| Proton Temperature, , (keV) | ||
| Speed of CCO, , () |
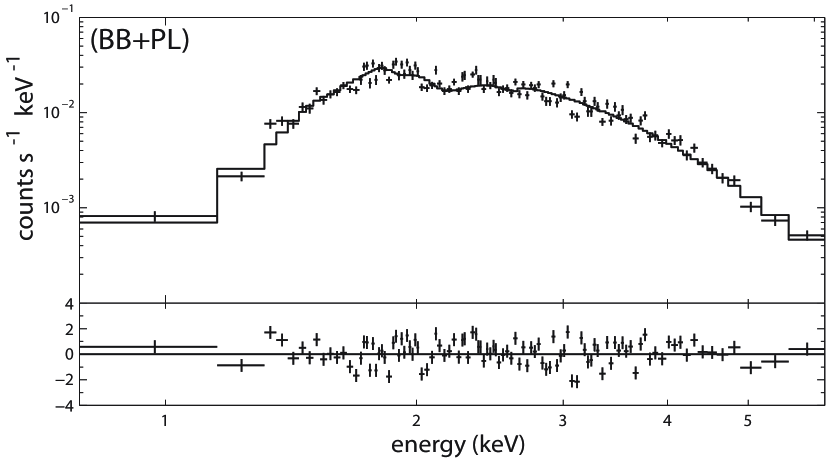
We extracted the CCO counts from a 2 arcsec-radius aperture and grouped the source spectrum to a minimum of 25 counts per bin. Using the SHERPA environment, we fit the spectrum to simple absorbed blackbody (BB) and power-law (PL) models. Although the PL fit is slightly better than the BB, the large photon index () suggests a thermal origin for the emission. Both fits are consistent with those discussed in G08. Since CCOs are often characterized by two-component models (BB+PL and BB+BB), we investigated those as well. The results are summarized in Table 3. The best-fit absorption column density is and agrees with that of the SNR. While the CCO spectrum is dominated by a BB with keV and a small emission radius of km, the high energy component is not very well constrained. Our results suggest that it can be modeled by either an additional BB component with a very high temperature (0.9 keV), or a PL component. Adding a second component improves the fit although not at a statistically significant level. Unfortunately, the current data do not allow us to distinguish between these two scenarios and a deeper exposure is required. We present the spectrum of XMMU J172054.5372652 overlaid with the BB+PL model in Figure 6.
| Parameter | BB | PL | BB+PL | BB+BB | |
| ( cm-2) | |||||
| (keV) | |||||
| (km) | |||||
| (keV) | |||||
| (km) | |||||
| Fluxaafootnotemark: () | |||||
| bbfootnotemark: | 1.5 | 9.8 | |||
| /dof | 1.02/105 | 0.94/105 | 0.86/103 | 0.86/103 | |
| The flux is over the energy range keV and has been corrected for foreground absorption | |||||
| Unabsorbed flux ratio between the first and second spectral components in the keV energy range | |||||
4. Discussion
The high resolution Chandra data reveal that the emission from G350.10.3 extends far to the west of the bright ejecta region and provide a rough constraint on the size of the SNR, with the caveat that the asymmetric morphology makes it difficult to extract a reliable diameter. G08 estimated the age of G350.10.3 to be years based on the diameter of the ejecta region alone ( pc) and the shock velocity derived from the electron temperature. However, we see that the emission from G350.10.3 extends far beyond the bright ejecta-dominated region and our analysis (using the model treatment of TM99) shows that the electron temperature is almost certainly an underestimate of the proton temperature. With the diameter, a post-shock density estimate and an assumed range of values for and as input parameters, we calculate a shock velocity of , a proton temperature of keV and an age of years. We see that although the size of the SNR is far larger, the age is consistent with earlier estimates due to the lower ISM density estimate.
The enhanced elemental abundances and high temperature of the bright emission in the remnant’s eastern half unambiguously demonstrate the presence of hot, metal-rich ejecta. By contrast, spectral analysis of the emission around the perimeter of the ejecta region and throughout the SNR’s western half (with the possible exception of region 2 — see discussion in § 3.1) reveals cooler material with solar-type composition, which supports shocked interstellar/circumstellar medium (ISM/CSM) for its origin. This well-defined interface between the ejecta and shocked ISM regions further supports G08’s suggestion that G350.10.3 is interacting with a molecular cloud in the east. If this is indeed the case, the expanding shock wave propagating eastward through the dense gas would form a strong reverse shock and heat the metal-rich ejecta to X-ray emitting temperatures while the shock front propagating in the other direction would still be expanding relatively unimpeded into the diffuse ISM.
Although we cannot conclusively determine whether the 24 emission is due to dust or line emission, the similarity between the infrared and X-ray morphologies supports the shocked dust scenario (Seok et al. 2008). In addition, the lack of significant emission at 70 and in the IRAC band is consistent with dust emission that peaks between those bands. The catalog of 24 MIPSGAL sources by Mizuno et al. (2010) lists only a handful of SNRs, but spectroscopic observations with Spitzer have shown that SNRs interacting with dense molecular clouds produce a number of shocked molecular and atomic species in the mid-infrared band (Hewitt et al. 2009). Thus the presence of 24 emission coinciding with the eastern bright X-ray clump in G350.10.3 is consistent with a molecular cloud interaction. As can be seen from Figure 4, the upper filament (region 1b) appears to outline precisely the eastern edge of of the region corresponding to the ejecta-dominated emission. By contrast, the lower filament (region 1a) is not visible at 24 . The Mg and Si lines in the spectra of these two regions (Figure 2) as well as the spectral fit results (Table 1) suggest that the ionization timescale of the region 1a filament is noticeably higher than that of the region 1b filament. Although we cannot determine whether the difference is due to a higher density or longer time since shock, the material in region 1a (in either case) may have cooled/sputtered more than that in the region 1b filament. Incidentally, both regions of emission at 24 (1c and 4) coincide with the regions of lowest ionization timescale, as determined from their X-ray spectra. This result seems consistent with the scenario that the 24 emission is due to dust heated by the reverse shock propagating back into the SNR and the difference in brightness between the various regions could be attributed to dust cooling or sputtering.
If the explosion occurred approximately at the center of the X-ray emission (RA. 17:21:01.019, DEC. -37:26:49.61), the derived age puts the projected velocity of XMMU J172054.5372652 at , assuming it was formed in the same explosion. The lower limit of this velocity, although high, falls within the measured for the CCO in Puppis A (Hui & Becker 2006: Winkler & Petre 2007). The upper limit is significantly higher than that measured for any CCO. Although the spectrum of XMMU J172054.5372652 can be fitted with a BB+BB or a BB+PL model, the former requires a BB component of unusually high temperature. On the other hand, a BB+PL model is not uncommon when comparing to the X-ray spectra of other CCOs. The best-fit BB+PL parameters in Table 3 fall within the typical range of others (see Table 2 in Pavlov et al. 2004). Indeed, XMMU J172054.5372652 could be a close cousin of the CCOs inside SNRs Vela Jr (G266.1-1.2) and Puppis A. These objects have an age of kyr and a blackbody temperature of keV. We also note that for the CCO inside Puppis A, XMM-Newton observations indicate an additional hard spectral component that can be fitted with either a PL of or a hard BB with keV (Becker & Aschanbach 2002), very similar to our case.
In addition to the prominent difference in flux between the bright eastern emission and the surrounding regions, there is an intriguing contrast in brightness between the ambient material in the far west and the bright regions of shocked CSM/ISM (regions 3 and 4 in Figure 1a). We estimate the brightness ratio of these regions to be , implying a density ratio of . Thus, if more of the remnant lies unseen further to the west, it would need to be only slightly less dense to emit below the background. If this is indeed the case, it would change all the derived SNR parameters and imply that the SNR may have already entered the ST phase. The larger radius would increase the SNR’s age, lower the shock velocity and lower the proton temperature. In addition, it would imply that XMMU J172054.5372652 may be closer to the explosion center than evident from the visible emission, which would place its speed at a lower, more typical value. On the other hand, if G350.10.3 is indeed interacting with a molecular cloud along its eastern edge, the apparent center of the emission is likely a poor estimate of the explosion location. In this case, the supernova center would be closer to the eastern edge, which would tend to increase the velocity of the CCO.
5. Conclusion
In this paper, we have investigated the dynamical properties of G350.10.3 and its candidate neutron star XMMU J172054.5372652. By doing spectral modeling on the high resolution X-ray data, we have found that the region of brightest emission is dominated by hot, metal-rich ejecta while the diffuse material throughout the surrounding regions is mostly cooler swept-up CSM/ISM with solar abundances. These results further support the conclusion of Gaensler et al. (2008) that G350.10.3 is interacting with a dense molecular cloud in the east. The X-ray imaging has resolved new morphological features and revealed that the SNR is far more extended than apparent from the ejecta region alone. We used the numerical model of Truelove and McKee (1999) to show that G350.10.3 is likely in the free expansion phase and derive values for its age, shock velocity and proton temperature. We examined the relationship between the inferred shock velocity and the derived electron/proton temperature ratio for G350.10.3 and found it to be entirely consistent with that of other SNRs. The derived age puts the speed of XMMU J172054.5372652 at an unusually high value although its spectral characteristics are found to be consistent with CCOs in other remnants. We presented an archival 24 image of G350.10.3 and found that the infrared and X-ray morphologies are well-correlated, offering additional support for a molecular cloud interaction.
References
- Becker & Aschenbach (2002) Becker, W., & Aschenbach, B. 2002, in Proc. 270, WE-Heraeus Seminar on Neutron Stars, Pulsars, and Supernova Remnants, ed. W. Becker, H. Lesch, & J. Trmper (MPE Report 278; Garching: MPI), 64
- Bitran et al. (1997) Bitran, M., Alvarez, H., Bronfman, L., May, J., & Thaddeus, P. 1997, A&AS, 125, 99
- Borkowski et al. (2001) Borkowski, K. J., Lyerly, W. J., & Reynolds, S. P. 2001, ApJ, 548, 820
- Buccheri et al. (1983) Buccheri, R., et al. 1983, A&A, 128, 245
- Carey et al. (2009) Carey, S. J., et al. 2009, PASP, 121, 76
- Churchwell et al. (2009) Churchwell, E., et al. 2009, PASP, 121, 213
- Clark et al. (1973) Clark, D. H., Caswell, J. L., & Green, A. J. 1973, Nature, 246, 28
- Clark et al. (1975) Clark, D. H., Caswell, J. L., & Green, A. J. 1975, Aust. J. Phys. Astrophys. Suppl., 1
- Gaensler et al. (2008) Gaensler, B. M., et al. 2008, ApJ, 680, L37 (G08)
- Ghavamian et al. (2007) Ghavamian, P., Laming, J. M., & Rakowski, C. E., 2007, ApJ, 654, L69
- Green et al. (1991) Green, D. A. 1991, PASP, 103, 209
- Hewitt et al. (2009) Hewitt, J. W., Rho, J., Andersen, M., & Reach, W. T. 2009, ApJ, 694, 1266
- Hui & Becker (2006) Hui, C. Y., & Becker, W. 2006, A&A, 457, L33
- McClure-Griffiths et al. (2005) McClure-Griffiths, N. M., et al. 2005, ApJS, 158, 178
- Mizuno et al. (2010) Mizuno, D. R., et al. 2010, AJ, 139, 1542
- Pavlov et al. (2004) Pavlov, G. G., Sanwal, D., & Teter, M. A. 2004, in IAU Symp. 218, Young Neutron Stars and Their Environments, ed. F. Camilo & B. M. Gaensler (San Francisco, CA: ASP), 239
- Salter et al. (1986) Salter, C. J., Patnaik, A. R., Shaver, P. A., & Hunt, G. C. 1986, A&A, 162, 217
- Seok et al. (2008) Seok, J.Y., Koo, B.-C., Onaka, T., et al. 2008, PASJ, 60, 453
- Sugizaki et al. (2001) Sugizaki, M., Mitsuda, K., Kaneda, H., Matsuzaki, K., Yamauchi, S., & Koyama, K. 2001, ApJS, 134, 77
- Truelove & McKee (1999) Truelove, J. K., & McKee, C. F. 1999, ApJS, 120, 299 (TM99)
- Voges et al. (1999) Voges, W., et al. 1999, A&A, 349, 389
- Whiteoak & Green (1996) Whiteoak, J. B. Z., & Green, A. J. 1996, A&AS, 118, 329
- Wilms et al. (2000) Wilms, J., Allen, A., & McCray, R. 2000, ApJ, 542, 914
- Winkler & Petre (2007) Winkler, P. F., & Petre, R. 2007, ApJ, 670, 635
- Woosley et al. (2002) Woosley S. E., Heger A., & Weaver T. A., 2002, Rev. Modern Phys., 74, 1015