The hot and the cool otbursts in the symbiotic system AG Draconis
Abstract
In this papper we present the analyses of the six (1998, 1997, 2001, 2002, 2003 and 2005) last outbursts of AG Draconis on the basis of low resolution visual spectroscopy. A new method to determine the Zanstra’s temperature of the hot ionizing source from the optical H and HeIIÅ emission lines has been used. As a results we obtained the evolution of the individual outburst on the H-R diagram.
1Centre for Astronomy of Nicolaus Copernicus University, Toruń, Poland
2Tartu Observatory, Estonia
3Department of Physic, University of Tartu
1. Background
AG Dra is the best studied case of so-called ”yellow” symbiotic binaries containing a hot white dwarf and a metal-poor K giant. The giant is significantly brighter than similar normal giants with the same temperature belonging to the disc population (Mikolajewska et al. 1995). It is a relatively active system among the other symbiotics. Its quiescence stages are almost regularly disrupted (in 1936, 1951, 1966, 1980, and 1994) with intervals of about 15 years series of several (2-5) outbursts Bastian (1998). The last active phase consist of five outbursts between 1994 and 1998. In 2001 an unexpected series of three outbursts have been observed. New active stage has started in 2006, and was preceded by smaller outburst in 2005. Basing on the analysis of the 1980-86 series of outbursts Gonzlez-Riestra et al. (1999) distinguished ”hot” and ”cool” outbursts.
The most of the spectroscopic and photometric observations were presented in Leedjrv et al. (2004). A new set of observations was also obtained. Low resolution and objective prism spectroscopy, was carried out in Torun Observatory using Canadian Copernicus Spectrograph, and the flint prism, attached to the 60/90cm Schmidt-Cassegrain telescope. All the Torun spectra were converted to absolute flux scale using standard stars and available photometry. Additionally the equivalent widths published in (Leedjrv et al. 2004) were converted to fluxes. The observed fluxes were corrected for the self-absorption (in the HII regions), and the absorption (in the HI regions) effects.

2. Method
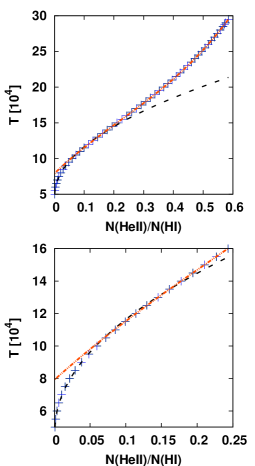
Basing on Zanstra’s method we have made a new attempt to compute the temperature of the hot ionizing source. Following Osterbrock (1989) we found the relation between the number of the photons emitted by the neutral hydrogen and the single ionized helium and the observed fluxes in H and HeIIÅ emission lines. As a result we have obtained semi-empirical relations
for the temperature range , and
for . The fitted curves are shown on Figure 1.
Using the B-case recombination equation we can compute the luminosity of the hot star separately from both and HeII Å and can plot the status of the hot star on the H-R diagram.
3. Results
The time evolution of the V magnitude of the system, as well as the temperature, the luminosity and the radius of the white dwarf is shown in Figure 2. The differences between the two types of outbursts are clearly visible in the U-band photometry. The 1997, 1998 events are brighter than 2001, 2002 and 2003 ones. The duration time of 1997, 1998 and 2005 outbursts ( days) is significantly longer than the one of 2001, 2002 and 2003 outbursts ( days). The temperature reached by white dwarf during the 2002 and 2003 outbursts is higher than during the rest of outbursts, but the luminosities observed in 1997 and 2005 are the largest among the events shown here. The significant differences are visible in the hot star pseudo-photosphere radius. During the 2001-2003 outbursts the radius stays at the same level () (marked with a dashed horizontal line), but it growth significantly up to in 1997, 1998 and 2005.
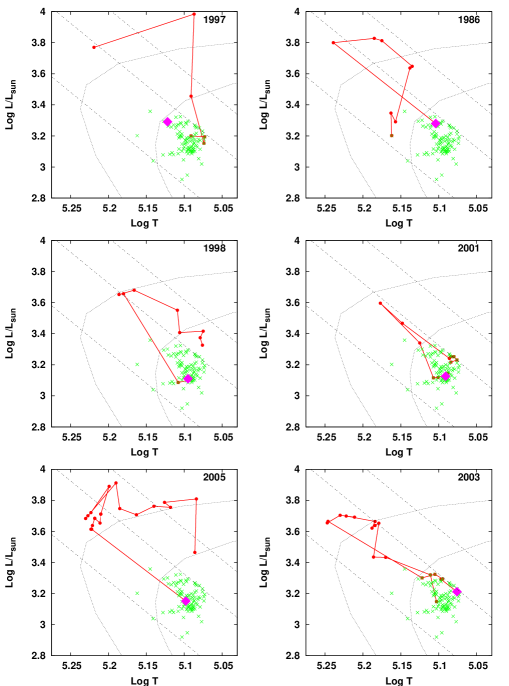
The evolution on the H-R diagram for the six different outbursts is graphicaly presented in Figure 3. The left column panels present the cool outbursts, the right column panel – the hot ones. We have included the 1986 event (data taken from Gonzlez-Riestra et al. (1999)), which is similar to 2002 and 2003 outbursts. Both types of outburst are characterised by an increase of the white dwarf luminosity and temperature during the first phase of the outburst. At the begining of the cool and hot outbursts the white dwarf evolves with the almost constant radius and increasing temperature and luminosity. After the star reaches maximum temperature and luminosity, two scenarios are possible for the further outburst evolution. According to the first one (hot outbursts), the cooling process fallows almost the same path to the quiet stage. According to the second scenario (cool outbursts) after the increase of the temperature and the luminosity a constant luminosity phase is observed.
Our analysis shows two kinds of outbursts – cool and hot. As cool outbursts we can consider the 1997, 1998 and 2005 events, while the 2001, 2002, and 2003 outbursts belong to the hot ones. During the hot outbursts we do not observe the predicted by the theory of the thermonuclear outburst, constant luminosity phase of the white dwarf.
Acknowledgments.
This work is supported by the Polish MNiSW Grant N203 018 32/2338.
References
- Bastian (1998) Bastian, U., 1998, A&A, 329L, 61
- Gonzlez-Riestra et al. (1999) Gonzlez-Riestra R., Viotti R., Iijima T., Greiner J., 1999, A&A, 347, 478
- Greiner et al. (1997) Greiner J., Bickert K., Luthardt R., Viotti R., Altamore A., Gonzalez-Riestra R., Stencel R. E., 1997, A&A, 322, 576
- Mikolajewska et al. (1995) Mikolajewska J., Kenyon S. J., Mikolajewski M., Garcia M. R., Polidan R. S., 1995, AJ, 109, 1289
- Leedjrv et al. (2004) Leedjrv L., Burmeister M., Mikołajewski M., Puss A., Annuk K., Gałan C., 2004,A&A, 415, 273
- Osterbrock (1989) Osterbrock D. E., in Astrophysics of Gaseous Nebulae and Active Galactic Nuclei, University Science Books Sausalito, California, 1989
- Vassiliadis et al. (1994) Vassiliadis E., Wood P. R., 1994, ApJS, 92, 125