Compton processes in the bright AGN MCG +8-11-11
Abstract:
We present preliminary results on the hard X-ray emission properties of the Seyfert 1.5 galaxy MCG 81111, as observed by INTEGRAL and SWIFT. All the INTEGRAL IBIS/ISGRI data available up to October 2009 have been analysed together with two SWIFT/XRT snapshot observations performed in August and October 2009, quasi-simultaneously to INTEGRAL pointed observations of MCG 81111. No correlation is observed between the hard X-ray flux and the spectral slope, while the position of the high-energy cut-off is found to have varied during the INTEGRAL observations. This points to a change in the temperature of the Comptonising medium from a minimum value of to values larger than 100–150 keV. There is no significant detection of Compton reflection, with a 3 upper limit of , and no line has been detected at 112 keV, as previously claimed from HEAT observations (). The variability behaviour of MCG 81111 is found to be similar to that shown by IC 4329A, with different temperatures of the electron plasma for similar flux levels of the source, while other bright Seyfert galaxies present different variability patterns at hard X-rays, with spectral changes correlated to flux variations (e.g. NGC 4151).
1 Introduction
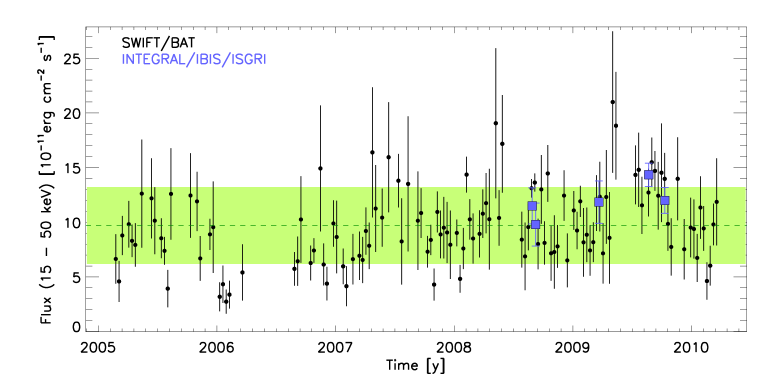
The Seyfert 1.5 MCG 81111 () is one of the brightest Seyfert galaxies in the X-rays and historically showed flux variations by a factor of 3–4 on time scale of years (Fig. 1). This source has been extensively observed in the past below 10 keV, but only few observations were performed at hard X-rays before the advent of the present hard X-ray satellites INTEGRAL, SWIFT and Suzaku. Due to the relatively low amount of reflection and the properties of the Fe line, it has been suggested that the observed reflection is produced in the accretion disc and that the narrow core of the Fe K line is emitted in the broad line region, whereas no evidences for a classical torus are found in the X-ray spectrum of this AGN [1], making MCG 81111 a very peculiar Seyfert galaxy. We present here the preliminary results of simultaneous INTEGRAL [2] and SWIFT [3] pointed observations of MCG 81111. Such observations aim at measuring the Comptonisation parameters for an increasing sample of Seyfert galaxies in order to test the AGN unification model and to provide more precise inputs for cosmic X-ray background models. In addition, the study of the spectral variability properties of AGN can provide important information about the structure, the physics and the dynamics of the radiating source.
2 INTEGRAL and SWIFT observations
Before the 2009 pointed observation, MCG 81111 had been observed by INTEGRAL during non-dedicated observations, resulting in off-axis angles mostly larger than . For this reason, a relatively low effective IBIS/ISGRI [4] exposure time of only 235 ks had been accumulated, compared to the 660 ks of field exposure. During August and October 2009, INTEGRAL has performed 400 ks (242 ks of effective, off-axis corrected ISGRI time) of pointed observations on MCG 81111, coordinated with 2 quasi-simultaneous SWIFT snapshots of 2.4 and 3.6 ks, respectively. We have analysed all the IBIS/ISGRI data available in the archive with the source within from the center of the field of view, resulting in 477 ks of effective exposure, accumulated between the beginning of the mission and October 11, 2009. The data have been analysed using version 9.0 of the Offline Scientific Analysis Software (OSA). The spectra have been extracted using the standard OSA spectral extraction.
The two SWIFT observations have been performed on August 26 and October 8, 2009 and the XRT data have been analysed with the SWIFT software version 3.4 distributed with the HEAsoft 6.7 package and the latest available calibration files.
3 Spectral analysis
3.1 Spectral slope and flux variability
We have grouped the IBIS/ISGRI data into 6 separate periods, spanning from 40 to 170 ks of effective exposure time each, accumulated within 4 days to 2 years. In order to investigate the variations of the spectral shape and its correlation with the source flux across the mission lifetime, we have fitted these spectra with a simple power law model. The statistic of the spectrum collected during the first period (2003–2005) does not allow to constrain the power law slope, which has therefore been fixed to the value . No correlation is found between the spectral slope and the 18–60 keV flux, with the flux varying by about 40% while the slope did not significantly change (Fig. 2).

During the 2008–2009 INTEGRAL observations, the source was detected with a flux larger than its average level over the last 6 years as measured by SWIFT/BAT111The BAT light curve in the 15–50 keV band has been downloaded from the Swift/BAT hard X-ray transient monitoring pages: http://swift.gsfc.nasa.gov/docs/swift/results/transients (Fig. 1).
3.2 Comptonisation features
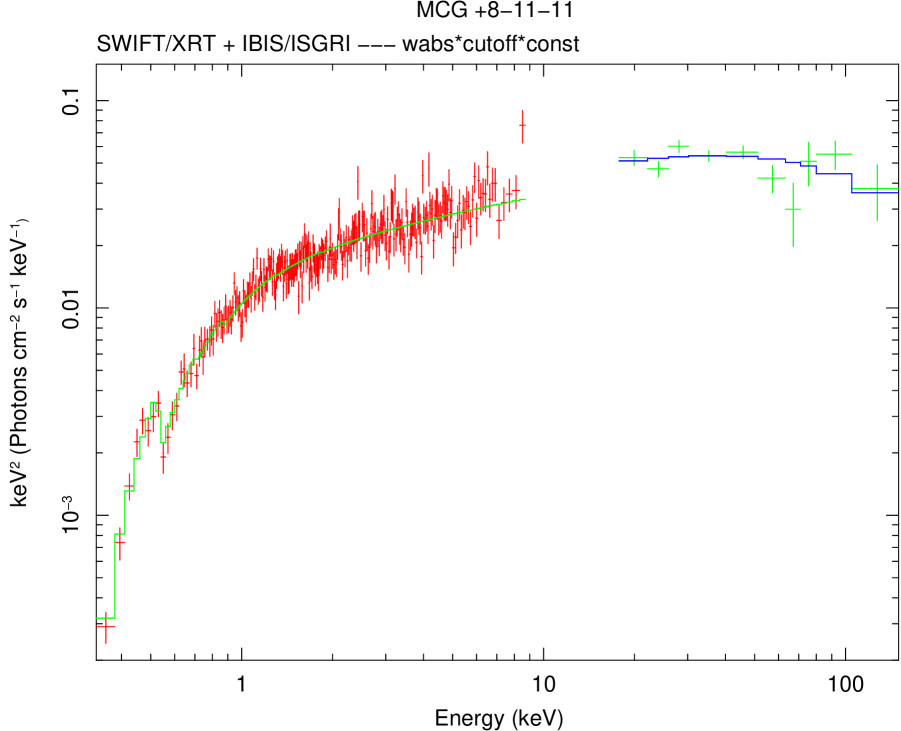
A more detailed analysis has been carried out on the spectra with the highest-signal-to-noise, using a more complex model in order to test the presence of Comptonisation signatures, e.g. a high-energy cut-off and a Compton reflection hump. Therefore, we fitted the IBIS/ISGRI spectra of August and October 2009 with the respective quasi-simultaneous SWIFT/XRT data, and the total ISGRI spectrum spanning 7 years of the INTEGRAL mission together with the average XRT spectrum. Preliminary results indicate that while the October 2009 spectrum is best fitted with a simple absorbed power law (, 174 d.o.f.), the August 2009 spectrum shows a prominent curvature, best modeled with the addition of a cut-off at , and resulting in a significant improvement of the reduced (, 126 d.o.f., F-test probability = ). Similarly, the total spectrum requires the addition of a cut-off at (, 265 d.o.f., F-test probability = ; Fig. 3). A summary of the best parameters obtained fitting these three ISGRI spectra with an absorbed cut-off power law model is provided in Table 1222A cross-calibration factor has been added to all fitting models, and left free to vary. This factor has been found to assume values of for the ISGRI spectra with respect to the XRT ones.. Only a 3 upper limit could be derived for the amount of Compton reflection present in the source (, when applying a pexrav model to the total spectrum) and for the flux of the Fe K line (, when fixing the rest frame line energy and the line width at and , respectively; [5]). We tried to fit the spectra with a more physical model, i.e. compps, but it was not possible to significantly constrain its parameters. A more complete and detailed analysis of MCG 81111 combining INTEGRAL, SWIFT, XMM-Newton, RXTE and Suzaku data and using the compps model is ongoing [6] and its preliminary results are in agreement with those presented here.

3.3 The 112 keV line
An emission line at 112 keV was detected in the spectrum of MCG 81111 during a balloon flight of the HEAT telescope in July 1995 with a flux of [7]. As simultaneously the veto system of the telescope registered a strong gamma-ray flux, Perotti et al. have suggested that the 112 keV line could be due to double-Compton scattering of a 511 keV line source incident on an external cloud. Later CGRO/OSSE observations did not detect the line with an upper limit flux of [8] implying that the line, if present, is variable. In the ISGRI data presented here, we do not detect any line at 112 keV. We provide a 3 upper limit of for the line flux, when fixing the position and the width of the line to and [7]. This upper limit is 4 times lower than the flux reported by Perotti et al. and consistent with the upper limit found with OSSE. The source was not detected by SPI and, in any case, due to its sensitivity and spectral resolution, ISGRI is a better instrument than SPI to detect a rather broad line at energies below 200 keV.
| ISGRI obs. | ISGRI exp. | |||||
|---|---|---|---|---|---|---|
| period | [ks] | [keV] | ||||
| August 2009 | 135 | 0.21 0.03 | 1.61 0.08 | |||
| October 2009 | 173 | 0.18 0.02 | 1.69 0.06 | |||
| All data | 477 | 0.19 0.01 | 1.63 0.05 |
4 Discussion and conclusions
With a black hole mass of [9, 10], an X-ray luminosity of and assuming a twice as large bolometric luminosity, MCG 811 11 shows an Eddington ratio of , placing it among the most efficient hard X-ray selected Seyfert galaxies [11].
Some of the past studies of MCG 81111 reported the presence of a strong reflection component [5, 8, 12, 13]. Yet, a good statistical constrain was only obtained with XMM-Newton data but limited at energies below 10 keV [5] or combined with low effective exposure ISGRI data ([13], corresponding to the first point in Fig. 2), until Suzaku together with SWIFT/BAT observations provided a high signal-to-noise, broad band coverage between 0.6 and 150 keV [1]. The latter work finds that when the broad band spectrum is fitted, the reflection fraction drops to values of , marginally consistent with the upper limit we find in INTEGRAL data.
During observations at hard X-rays with CGRO/OSSE [8], BeppoSAX [12], Suzaku + Swift/BAT [1] and in early INTEGRAL/ISGRI data [13], MCG 81111 showed a somewhat steeper spectrum () and a cut-off at higher energies (, but still consistent within the uncertainties with the value found here for the August 2009 spectrum. A cut-off energy at corresponds to an electron plasma temperature of , towards the lower end of typical values found in Seyfert galaxies [14]. INTEGRAL data seem to indicate that the position of the high-energy cut-off varies on month time scale, while the spectral slope and the flux did not significantly change during the same period. Yet, it is important to keep in mind the uncertainties of the cut-off determination, due to the fact that the source is detected up to only 120 keV in these ISGRI data.
Past studies suggest that the hard X-ray emission of Seyfert galaxies is indeed observed to vary, and the variations can be complex and very different from object to object. For instance, in some cases no spectral variations are observed to accompany different flux levels [15] whereas in some other cases variations of the spectral slope are correlated with the flux [16], suggesting the superposition of a constant reflection component and a variable (in flux and shape) power law continuum. On the other hand, NGC 4151 presents no changes in the slope of the underlying continuum for different X-ray fluxes but a significant variation of the temperature of the Comptonising plasma is observed [14]. For other objects, a clear variability pattern has not been recognized yet and equivalent flux levels can present significantly different spectral slopes (NGC 4388 [17], NGC 7172 [18]) or different cut-off energies (this work and IC 4329A [19]).
Acknowledgments
S.S. acknowledges the Centre National d’Etudes Spatiales (CNES) for financial support. Part of the present work is based on observations with INTEGRAL, an ESA project with instruments and science data centre funded by ESA member states with the participation of Russia and the USA. We thank Peter Kretschmar for providing the script to draw the contour plot.
References
- [1] Bianchi S., De Angelis I., Matt G., et al. 2010, A&A, 522, A64
- [2] Winkler C., Gehrels N., Schönfelder, V., et al. 2003, A&A, 411, 349
- [3] Gehrels N., Chincarini G., Giommi P., et al. 2004, ApJ, 611, 1005
- [4] Lebrun F., Leray J. P., Lavocat P., et al. 2003, A&A, 411, 141
- [5] Matt G., Bianchi S., De Rosa A., Grandi P., Perola G. C. 2006, A&A 445, 451
- [6] Lubiński P., Beckmann V., Paltani S., et al. in preparation
- [7] Perotti F., Mattaini E., Quadrini E., et al. 1997, ApJ 475, L89
- [8] Grandi P., Haardt F., Ghisellini G., et al. 1998, ApJ 498, 22
- [9] Bian W. & Zhao Y. 2003, MNRAS 343, 164
- [10] Middleton M., Done C., Schurch N. 2008, MNRAS 383, 1501
- [11] Beckmann V., Soldi S., Ricci C., et al. 2009, A&A, 505, 417
- [12] Perola G.C., Matt G., Fiore F., et al., 2000, A&A 358, 117
- [13] Molina M., Bassani L., Malizia A., et al. 2009, MNRAS 399, 1293
- [14] Lubiński P., Zdziarski A. A., Walter R., et al. 2010, MNRAS 408, 1851
- [15] Guainazzi M., Perola G. C., Matt G., et al. 1999, A&A 346, 407
- [16] Papadakis I.E., Sobolewska M., Arevalo P., et al. 2009, A&A 494, 905
- [17] Fedorova E.V., Beckmann V., Neronov A., Soldi S. 2011, PoS(INTEGRAL2010)075
- [18] Guainazzi M., Matt G., Antonelli L.A., et al. 1998, A&A 298, 824
- [19] Soldi S., Ponti G., Beckmann V., Lubiński P. 2009, PoS(extremesky2009)031
- [20] Paltani S., Petrucci P.O., Lubiński P., et al. 2011, PoS(INTEGRAL2010)009
- [21] Beckmann V., Courvoisier T. J.-L., Lubiński P., et al. 2008, A&A, 492, 93
- [22] Beckmann V., Jean P., Lubiński P., Soldi S., Terrier R. 2011, submitted to A&A
- [23] Soldi S., Beckmann V., Bassani L., et al. 2005, A&A 444, 431
- [24] Beckmann V. & Do Cao O. 2011, PoS(INTEGRAL2010)081