A third H i 21-cm absorption system in the sight-line of MG J0414+0534: A redshift for Object X?
Abstract
We report the detection of a third H i 21-cm absorber in the sight-line towards the quasar MG J0414+0534 (4C +05.19). In addition to the absorption at the host redshift and in the gravitational lens, we find, through a decimetre-wave spectral scan towards this source, strong absorption at . We believe this may be associated with “Object X”, an additional feature apparent in the field of the lensing galaxy and lensed images, on the basis of its close proximity to the quasar images and the possible detection of the [O iii] doublet in a published optical spectrum. If real, the strength of the [O iii] emission would suggest the presence of an active galactic nucleus, or a gas-rich galaxy undergoing rapid star formation, either of which is consistent with the strong outflows apparent in the 21-cm spectrum. Although this is the strongest intervening 21-cm absorber yet found (a column density of , for a modest K), simultaneous observations failed to detect any of the 18-cm OH lines at the 21-cm redshift. This suggests that, as for the lensing galaxy, this is not the primary location of the intervening material responsible for the very red colour of MG J0414+0534.
keywords:
galaxies: active – quasars: absorption lines – radio lines: galaxies – galaxies: high redshift – galaxies: ISM – galaxies: individual (MG J0414+0534)1 Introduction
Radio-band observations of absorption systems along the sight-lines to distant quasars provide a powerful probe of the cool atomic and molecular gas at high redshift. This gas constitutes the reservoir of raw material which forms stars, planets and all other non-diffuse structures in the early Universe. As well as giving insight into how the contents of present day galaxies came to be, redshifted H i 21-cm and OH 18-cm absorption lines have the potential to be very useful in determining whether the fundamental constants of nature have changed since these large look-back times (see Curran, Kanekar & Darling 2004 and references therein).
Unfortunately, such absorption is currently rare, with only 76 H i 21-cm absorbers known at , 41 of which are due to intervening systems (summarised in Curran 2010)111With the addition of one new intervening absorber reported in Srianand et al. (2010)., with 35 being associated with the quasar/quasar host providing the background illumination (summarised in Curran & Whiting 2010)222With the addition of three new associated absorbers, two reported in Curran et al. (2011a) and one in cwwa11.. OH 18-cm absorption is rarer still, with only five systems known (Chengalur et al., 1999; Kanekar & Chengalur, 2002; Kanekar et al., 2003, 2005), three of which are intervening and two being associated with the background source.
All of the OH and 80% of detected H i absorption occurs at . Much of this bias is due to the limited availability of interference free bands at low frequencies, although there are additional effects contributing to lower detection rates at high redshift: For the intervening, systems the 21-cm detection rates (61% at cf. 33% at , Curran 2010) can be attributed to the geometry effects introduced by a flat expanding Universe, causing the coverage of the background flux to be systematically lower at higher redshift (Curran & Webb, 2006; Curran et al., 2010). For associated systems, the rates (39% at cf. 17% at ) are biased by the traditional optical selection of targets, where only the most ultra-violet luminous sources are known at high redshift, since the intense UV flux from the near-by active galactic nucleus ionises/excites the cool gas beyond detection (Curran et al., 2008). Although both of these effects are present in some cases at , although they are always present for the high redshift sources.
Optical selection effects further compound the detection of OH absorption in that, despite much searching of objects in the millimetre-band, where four of the five OH absorbers were originally discovered, millimetre-wave absorption has yet to be found in an optically selected target (see Curran et al. 2004). Curran et al. (2006) suggest that this is due to the optical brightness of these objects selecting against the dustier, and thus most molecular friendly absorbers. This is demonstrated through the optically selected damped Lyman- absorption systems (DLAs) having optical–near infrared colours of and molecular fractions of , whereas the radio absorbers have and (see figure 3 of Curran et al. 2009).
This is strong evidence that the background quasar light is reddened by the dust in the foreground absorber, which protects the molecular gas from the harsh UV environment. Thus, in order to increase the number of redshifted OH (and H i) absorbers known, we should target the reddest objects333This prediction was verified through the detection of OH at in the gravitational lens intervening PKS 0132–097 (Kanekar et al., 2005): With the detection of 21-cm absorption (Kanekar & Briggs, 2003) and an optical–near-infrared colour of along this sight-line (Gregg et al., 2002), this was a prime target. On this basis, we ourselves attempted to detect OH with both the Giant Metrewave Radio Telescope (GMRT) and the Westerbork Synthesis Radio Telescope in February 2005. However, severe RFI at 945 MHz ruined both observations.. However, due to their very faintness, optical spectra are not generally available and so we do not have a redshift to which to tune the telescope. We have therefore embarked on a programme of wide-band (200 & 800 MHz) spectral scans of very red () radio-loud objects with the Green Bank Telescope (GBT) in search of the dust and molecular gas responsible for the obscuration.
In this letter we report the detection of very strong 21-cm absorption at towards the quasar MG J0414+0534 (4C +05.19), where we have previously detected 21-cm in the gravitational lens (Curran et al., 2007a). With an optical–near-infrared colour of , this is the reddest of our targets, and, although 21-cm has also been detected in the lens, as well as in the host galaxy (Moore et al., 1999), OH remains undetected at either of these three redshifts.
2 Target selection and observations
As mentioned above, all of our targets were selected on the basis of their large optical–near-infrared colours () and high radio fluxes ( Jy). Being a database of bright and generally compact objects, with comprehensive optical photometry (Francis et al., 2000), these were taken from the Parkes Half-Jansky Flat-spectrum Sample (PHFS, Drinkwater et al. 1997), which, with the above conditions, gave five sources which could be scanned for both H i and OH by the GBT. However, given the very wide band-widths required for the full spectral scans, much of the data are subject to severe radio frequency interference (RFI), with only limited parts of the band being useful (Tanna et al., in prep). Nevertheless, we are able to obtain enough useful data on MG J0414+0534 to reveal a clear, strong detection of neutral hydrogen.
The 0.91–1.23 GHz range of the J0414+0534 observations were performed on 23 January 2007 using the PF2 receiver and the autocorrelation spectrometer over a 200 MHz wide bandpass (with 16 384 lags), centred on 1.0 GHz in two orthogonal linear polarisations. This band was observed for a total of two hours in 5 min position-switched scans, and the removal RFI affected scans left 44 minutes of good data, with a mean system temperature of K and an r.m.s. noise level of mJy per 3.56 (at 1030 MHz) channel in the clear parts of the bandpass.
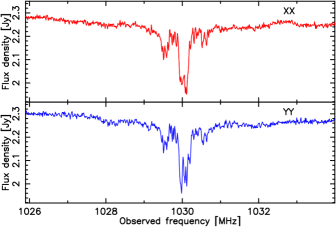
The data were calibrated, flagged and averaged using the gbtidl package and, as seen in each of the polarisations, an absorption feature was detected close to 1030 MHz (Fig. 1). Due to the structure of the line and the strength of the main component (a velocity integrated optical depth of ), we believe that the feature is due to 21-cm absorption at a redshift of .
3 Results and discussion
3.1 The H i 21-cm absorption
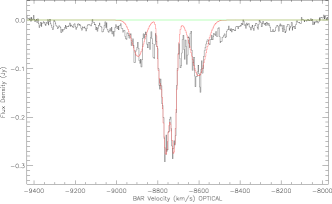
In each polarisation (Fig. 1) it is clear that the absorption is comprised of several components and in Fig. 2 we show the Gaussian fits to the profile and summarise these in Table 1.
| Line | FWHM | Depth | [] | |||||
|---|---|---|---|---|---|---|---|---|
| 1 | –8895 | |||||||
| 2 | –8793 | |||||||
| 3 | –8760 | |||||||
| 4 | –8721 | |||||||
| 5 | –8601 |
A single Gaussian fit to the main component gives , i.e. for the redshift of the absorber. This, in addition to the separate Gaussian fits to the blue and redshifted features (see below), gives a velocity integrated optical depth of . This is the strongest intervening 21-cm absorber yet found (see table 1 of Curran et al. 2007b and figure 12 of Curran et al. 2010), the next being at towards B0235+164 with (Roberts et al., 1976). The line strength gives a neutral hydrogen column density of , where is the spin temperature of the gas and the coverage of the background flux by the absorber. Given that K is the minimum typical value of this degeneracy (see Curran et al. 2005, 2010), it is clear that the neutral hydrogen column density in this absorber is large, , which is in the top 2% of Sloan Digital Sky Survey Data Release 5 DLAs (Prochaska & Wolfe, 2009). The largest is , a value which is exceeded by the absorber for K .
In addition to the main component, there is a strong red-shifted and a weaker blue-shifted component, offset at and , respectively. These features have absorption line strengths which are % and % of the main profile ( ), the redshifted feature being as strong as any of those in the main profile (Table 1). We interpret these as being due to outflows from the nucleus of the galaxy, which contain a significant portion of the absorbing gas. This is reminiscent of the Circinus galaxy, a near-by Seyfert in which the outflowing molecular gas mass is comparable with that in the disk (Curran et al., 1999).
If the disk of the galaxy intervenes most of the background flux, as may be evident from the large optical depth, the relatively narrow full-width half maximum of the main profile (FWHM ) may suggest a low to intermediate inclination for the galactic disk. Thus, this may have an axis direction similar to that of the outflow, which we believe is directed close to the line-of-sight, since it must intercept much of the flux from J0414+0534.444The diameter of the background emission is at 1.4 GHz (Katz et al., 1997), which is 26 kpc at ( km s-1 Mpc-1, and ). However, this is not a necessity, as the galactic disk (in which the absorption occurs) need not be coplanar with the circumnuclear torus, invoked by unified schemes of active galactic nuclei, which collimates the outflow (Curran & Whiting 2010 and references therein).
3.2 The OH 18-cm absorption
Since the purpose of our spectral scans is to find the intervening molecular gas responsible for the reddening of the background quasar, the frequencies covering the four 18 cm OH lines were observed simultaneously in separate IFs. Given the redshift of the 21-cm absorption, we expect the OH transitions to occur at 1169.15 (1612), 1207.71 (1665), 1209.13 (1667) and 1247.69 MHz (1720 MHz). Examining the data which contain these frequencies (Fig. 3), we see that there may indeed be two features coincident with the 1665 () and 1667 MHz () transitions (OH1667 panel), although, even after removal of the worst RFI, the bandpass is somewhat bumpy. From a Gaussian fit to the higher frequency feature, we obtain a centroid of MHz, which is where the transition would occur at a redshift of implying that the should be redshifted to MHz. However, this is observed at , which in conjunction with the fact that is out of the range of any of the H i features (Table 1), leads us to conclude that these are artifacts of an unstable bandpass.
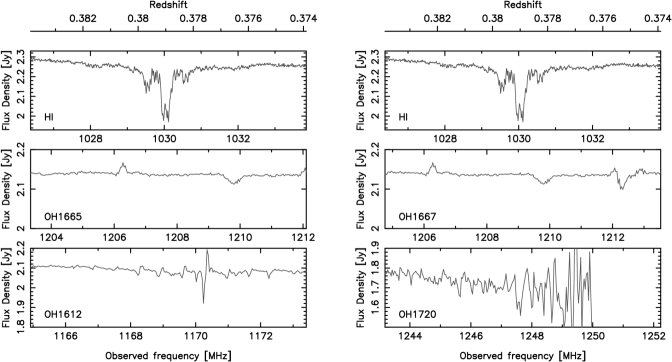
Since the 1665 MHz band is the cleanest over the 21-cm redshift, we use this transition to obtain an optical depth limit. Curran et al. (2007a) found a correlation between the H i and OH profile widths for the five known redshifted OH absorbers and so we resample the r.m.s. noise level of 1.8 mJy per 10 to the FWHM of the main 21-cm absorption profile. This gives a limit of per 86 or , where is the excitation temperature of the gas. Normalising this by the line strength of the main 21-cm profile gives , which is five times more sensitive than our previous limit in the gravitational lens (Fig. 4).
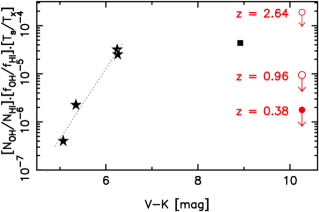
If the molecular abundance is correlated with the red colour of the background quasar (Curran et al., 2011a)), it is apparent that none of the two known intervening 21-cm absorbing systems towards J0414+0534 is the cause of the reddening. Furthermore, from OH observations at the host galaxy redshift (Curran et al., in prep.), we have obtained a limit of per 5 from the transition.555The redshifted frequencies of the other three transitions were completely dominated by RFI. Rescaling this to the FWHM of for the 21-cm profile (Moore et al., 1999), gives , or a normalised line strength of , which may not rule out strong OH absorption in the host galaxy (Fig. 4). Note that the low HCN abundance ( cm-2, for K) found by Moore et al. (1999) may not rule out a large molecular abundance either, on the basis that Kanekar et al. (2005) detect strong OH, but no HCO+, absorption towards PKS 0132–097, which Curran et al. (2007a) suggest is due to differences in the coverage of the millimetre and decimetre-wave emission. Given that three H i absorption systems are now known towards this source, however, it is feasible that the red colour of the background quasar arises from an accumulation of systems, rather than a single dusty intervening galaxy.
3.3 The origin of the absorption
Having discovered the absorption, the question of its origin arises. There have been a number of optical/near-infrared studies of J0414+0534 (Schechter & Moore, 1993; Angonin-Willaime et al., 1994; Falco et al., 1997), and these show, in addition to the four quasar images (A1, A2, B & C) and the lensing galaxy, a feature often referred to as “Object X” (Fig. 5).
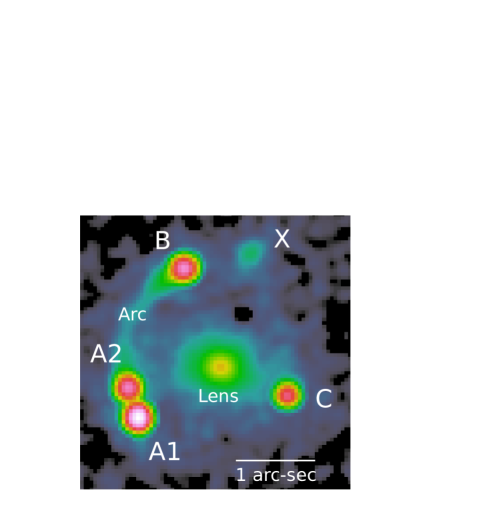
It is located about 1 arc-sec west of component ’B’, giving impact parameters of between 5–15 kpc (for ) and 8–25 kpc (for ) to the four quasar images. HST photometry (Falco et al., 1997) gives and , thus having a different colour to the quasar images, while probably being slightly redder than the lensing galaxy.
We note that the spectrum of Tonry & Kochanek (1999) shows tantalising evidence of peaks approximately where the [O iii] Å doublet would be located for the H i absorption redshift of (observed wavelengths of and Å). The slit position, as indicated in their figure 1, would indeed lie directly across Object X and large [O iii] emission line fluxes would be expected from an AGN or gas-rich galaxy undergoing rapid star-formation, either of which are consistent with the observation of rapid outflows of H i in each direction.
4 Summary
As part of an ongoing project, scanning the entire redshift space towards highly reddened radio sources, in search for the object responsible for the obscuration of the optical light, we have detected a second intervening 21-cm absorber at towards the quasar MG J0414+0534. The other intervening absorber arises in the gravitational lens (Curran et al., 2007a) and, combined with the absorption found at the host redshift (Moore et al., 1999), gives a total of three H i absorbers so far detected along this sight-line.
Although we cannot determine the degeneracy for any of the three 21-cm absorbers, thus deriving the column densities, the 21-cm line strength in this new absorber is by far the strongest detected along this sight-line, being four times stronger than in the host galaxy [ ] and 19 times stronger than in the lens [ ]. In fact, the strongest intervening 21-cm absorber found to date.
Despite the H i absorption strength and the very red colour of this source (), OH remains undetected to very strong limits [], inferring that this new absorber is not the primary cause of the red colour. OH is also undetected in the lens and the host galaxy, although the latter is to relatively weak limits not allowing us to rule out that this is where much of the reddening occurs.
We suggest that the absorption may be associated with the feature known as Object X in the optical field of J0414+0534: This could be spatially coincident with the spectrum of Tonry & Kochanek (1999), of which the and Å features are consistent with the expected wavelengths for the [O iii] doublet at the redshift of the 21-cm absorption feature. Not being a companion of the lensing galaxy would have implications for the current lens models (e.g. Trotter et al. 2000; Kochanek & Dalal 2004).
This is the fourth only of the (now) 42 known redshifted intervening 21-cm absorbers, which have been discovered through 21-cm absorption, the others being at towards B0809+483 (Brown & Mitchell, 1983), towards B1328+307 (Brown & Roberts, 1973) and towards B2351+456 (Darling et al., 2004). The vast majority have been found by tuning the receiver to a frequency based upon the redshift of an a priori detected absorber (Mgii or Lyman-). Being optically selected, this traditional method biases against the more dust obscured systems and the discovery of two intervening 21-cm absorbers from spectral scans towards J0414+0534, suggests that future surveys with Square Kilometre array may uncover a large population of faint, dusty high redshift galaxies.
Acknowledgements
We would like to thank Jeremy Darling who provided Fig. 5. This research has made use of the NASA/IPAC Extragalactic Database (NED) which is operated by the Jet Propulsion Laboratory, California Institute of Technology, under contract with the National Aeronautics and Space Administration. This research has also made use of NASA’s Astrophysics Data System Bibliographic Services.
The National Radio Astronomy Observatory is a facility of the National Science Foundation operated under cooperative agreement by Associated Universities, Inc.
References
- Angonin-Willaime et al. (1994) Angonin-Willaime M.-C., Vanderriest C., Hammer F., Magain P., 1994, A&A, 281, 388
- Brown & Mitchell (1983) Brown R. L., Mitchell K. J., 1983, ApJ, 264, 87
- Brown & Roberts (1973) Brown R. L., Roberts M. S., 1973, ApJ, 184, L7
- Chengalur et al. (1999) Chengalur J. N., de Bruyn A. G., Narasimha D., 1999, A&A, 343, L79
- Curran (2010) Curran S. J., 2010, MNRAS, 402, 2657
- Curran et al. (2007a) Curran S. J., Darling J. K., Bolatto A. D., Whiting M. T., Bignell C., Webb J. K., 2007a, MNRAS, 382, L11
- Curran, Kanekar & Darling (2004) Curran S. J., Kanekar N., Darling J. K., 2004, Science with the Square Kilometer Array, New Astronomy Reviews 48. Elsevier, Amsterdam, pp 1095–1105
- Curran et al. (2004) Curran S. J., Murphy M. T., Pihlström Y. M., Webb J. K., Bolatto A. D., Bower G. C., 2004, MNRAS, 352, 563
- Curran et al. (2005) Curran S. J., Murphy M. T., Pihlström Y. M., Webb J. K., Purcell C. R., 2005, MNRAS, 356, 1509
- Curran et al. (1999) Curran S. J., Rydbeck G., Johansson L. E. B., Booth R. S., 1999, A&A, 344, 767
- Curran et al. (2010) Curran S. J., Tzanavaris P., Darling J. K., Whiting M. T., Webb J. K., Bignell C., Athreya R., Murphy M. T., 2010, MNRAS, 402, 35
- Curran et al. (2007b) Curran S. J., Tzanavaris P., Murphy M. T., Webb J. K., Pihlström Y. M., 2007b, MNRAS, 381, L6
- Curran & Webb (2006) Curran S. J., Webb J. K., 2006, MNRAS, 371, 356
- Curran et al. (2011a) Curran S. J., Whiting M., Murphy M. T., et al., 2011a, MNRAS, in press (arXiv:1012.1972)
- Curran et al. (2006) Curran S. J., Whiting M., Murphy M. T., Webb J. K., Longmore S. N., Pihlström Y. M., Athreya R., Blake C., 2006, MNRAS, 371, 431
- Curran & Whiting (2010) Curran S. J., Whiting M. T., 2010, ApJ, 712, 303
- Curran et al. (2009) Curran S. J., Whiting M. T., Webb J. K., 2009, Proceedings of Science, 89, Chap. 11
- Curran et al. (2011) Curran S. J., Whiting M. T., Webb J. K., Athreya A., 2011b, MNRAS, submitted
- Curran et al. (2008) Curran S. J., Whiting M. T., Wiklind T., Webb J. K., Murphy M. T., Purcell C. R., 2008, MNRAS, 391, 765
- Darling et al. (2004) Darling J., Giovanelli R., Haynes M. P., Bower G. C., Bolatto A. D., 2004, ApJ, 613, L101
- Drinkwater et al. (1997) Drinkwater M. J., Webster R. L., Francis P. J., Condon J. J., Ellison S. L., Jauncey D. L., Lovell J., Peterson B. A., Savage A., 1997, MNRAS, 284, 85
- Falco et al. (1997) Falco E. E., Lehár J., Shapiro I. I., 1997, AJ, 113, 540
- Francis et al. (2000) Francis P. J., Whiting M. T., Webster R. L., 2000, PASA, 17, 56
- Gregg et al. (2002) Gregg M. D., Lacy M., White R. L., Glikman E., Helfand D., Becker R. H., Brotherton M. S., 2002, ApJ, 564, 133
- Kanekar & Briggs (2003) Kanekar N., Briggs F. H., 2003, A&A, 412, L29
- Kanekar et al. (2005) Kanekar N., Carilli C. L., Langston G. I., et al., 2005, PhRvL, 95, 261301
- Kanekar & Chengalur (2002) Kanekar N., Chengalur J. N., 2002, A&A, 381, L73
- Kanekar et al. (2003) Kanekar N., Chengalur J. N., de Bruyn A. G., Narasimha D., 2003, MNRAS, 345, L7
- Katz et al. (1997) Katz C. A., Moore C. B., Hewitt J. N., 1997, ApJ, 475, 512
- Kochanek & Dalal (2004) Kochanek C. S., Dalal N., 2004, ApJ, 610, 69
- Kochanek et al. (1999) Kochanek C. S., Falco E. E., Impey C. D., Léhar J., McLeod B. A., Rix H.-W., 1999, in Holt S., Smith E., eds, After the Dark Ages: When Galaxies were Young (the Universe at ) Vol. 470 of American Institute of Physics Conference Series, Results from the CASTLES Survey of Gravitational Lenses. p. 163
- Moore et al. (1999) Moore C. B., Carilli C. L., Menten K. M., 1999, ApJ, 510, L87
- Prochaska & Wolfe (2009) Prochaska J. X., Wolfe A. M., 2009, ApJ, 696, 1543
- Roberts et al. (1976) Roberts M. S., Brown R. L., Brundage W. D., Rots A. H., Haynes M. P., Wolfe A. M., 1976, AJ, 81, 293
- Schechter & Moore (1993) Schechter P. L., Moore C. B., 1993, AJ, 105, 1
- Srianand et al. (2010) Srianand R., Gupta N., Petitjean P., Noterdaeme P., Ledoux C., 2010, MNRAS, p. 1888
- Tonry & Kochanek (1999) Tonry J. L., Kochanek C. S., 1999, AJ, 117, 2034
- Trotter et al. (2000) Trotter C. S., Winn J. N., Hewitt J. N., 2000, ApJ, 535, 671