Subaru and Gemini High Spatial Resolution Infrared 18 m Imaging Observations of Nearby Luminous Infrared Galaxies
Abstract
We present the results of a ground-based, high spatial resolution infrared 18 m imaging study of nearby luminous infrared galaxies (LIRGs), using the Subaru 8.2-m and Gemini South 8.1-m telescopes. The diffraction-limited images routinely achieved with these telescopes in the -band (17–23 m) allow us to investigate the detailed spatial distribution of infrared emission in these LIRGs. We then investigate whether the emission surface brightnesses are modest, as observed in starbursts, or are so high that luminous active galactic nuclei (AGNs; high emission surface brightness energy sources) are indicated. The sample consists of 18 luminous buried AGN candidates and starburst-classified LIRGs identified in earlier infrared spectroscopy. We find that the infrared 18 m emission from the buried AGN candidates is generally compact, and the estimated emission surface brightnesses are high, sometimes exceeding the maximum value observed in and theoretically predicted for a starburst phenomenon. The starburst-classified LIRGs usually display spatially extended 18 m emission and the estimated emission surface brightnesses are modest, within the range sustained by a starburst phenomenon. The general agreement between infrared spectroscopic and imaging energy diagnostic methods suggests that both are useful tools for understanding the hidden energy sources of the dusty LIRG population.
Subject headings:
galaxies: active — galaxies: nuclei — galaxies: Seyfert — galaxies: starburst — infrared: galaxies1. INTRODUCTION
A large number of bright galaxies that emit most of their radiation in the infrared (8–1000 m; ), peaking at 60 m, were found with the IRAS infrared sky survey (Soifer et al., 1987). These are called luminous infrared galaxies (LIRGs) or ultraluminous infrared galaxies (ULIRGs) if the infrared luminosity exceeds LIR 1012L⊙ (Sanders et al., 1988a; Sanders & Mirabel, 1996). The strong infrared emission means that powerful energy sources are present, hidden behind dust, which absorbs most of the primary energetic radiation; the heated dust grains re-emit this energy as infrared thermal radiation. These energy sources can be starbursts (energy release by nuclear fusion reactions inside stars), or activity within an active galactic nucleus (AGN; energy conversion from gravitational energy generated by a mass-accreting supermassive black hole to radiative energy), or some combination of the two. Once the primary energetic radiation is converted to heat, identifying the original energy source becomes an observational challenge.
An effective method of investigating the energy sources of LIRGs is to measure their emission surface brightnesses. In a starburst, the radiative energy generation efficiency of nuclear fusion is only 0.5% of Mc2, where M is the mass of material used in the nuclear fusion reaction, and c is the speed of light. The emission surface brightness of a starburst is modest and cannot exceed a certain threshold (1013L⊙ kpc-2), as determined observationally (Werner et al., 1976; Meurer et al., 1997; Soifer et al., 2000; Riechers et al., 2009) and predicted theoretically (Elmegreen, 1999; Thompson et al., 2005; Younger et al., 2008). In contrast, the radiative energy generation efficiency of an AGN is much higher, at 6–42% of Mc2, where M is the mass of accreting material (Bardeen 1970; Thorne 1974). In an AGN, high luminosity can be generated from a very compact area around a mass-accreting supermassive black hole, producing a very high emission surface brightness with 1013L⊙ kpc-2.
For the dusty LIRG population, high spatial resolution imaging observations in the infrared are a suitable choice to constrain the emission surface brightnesses of energy sources, because dust absorbs most of the primary energetic radiation, infrared dust re-radiation dominates the observed spectral energy distribution, and so traces the intrinsic energetic radiation luminosities in LIRGs. For a galaxy with given infrared luminosity, when the emission is spatially unresolved, a higher spatial resolution image can constrain the size of the emission region more strongly, and can provide a more stringent lower limit for the emission surface brightness of an energy source. Ground-based 8-m class telescopes are better suited for this purpose than space-based infrared satellites with small apertures, as the former provides better spatial resolution than the latter. To investigate the spatial distribution of infrared emission of LIRGs from the ground, -band (8–13 m) and -band (17–23 m) Earth atmospheric windows are possible choices. Higher sensitivity can be achieved in the -band than -band, due to a smaller background level from Earth’s atmosphere. Thus, -band observations are more suitable for probing the overall morphology of infrared emission of LIRGs, including both nuclear compact and diffuse extended components, to a fainter flux level (Soifer et al., 2001; Alonso-Herrero et al., 2006; Diaz-Santos et al., 2008; Siebenmorgen et al., 2008). However, for the purpose of constraining the emission surface brightnesses of energy sources in LIRG’s nuclei, we believe that -band observations are more powerful, for the following reasons. First, the long wavelengths of the -band are significantly less affected by turbulence in the Earth’s atmosphere than shorter-wavelength bands. Thus, in the -band, diffraction-limited image sizes (05) are readily achievable using ground-based 8-m class telescopes under even modestly good weather conditions. Hence, the point spread function (PSF) at is stable over time, and the investigation of the intrinsic spatial extent of compact emission in LIRGs is very reliable. Second, in the -band, (1) the contribution from polycyclic aromatic hydrocarbons (PAH) emission features, originating in star-forming activity, can be strong, relative to dust continuum emission, and (2) infrared emission powered by an obscured energy source can be highly flux-attenuated by the strong 9.7 m silicate dust absorption feature (Armus et al., 2007; Imanishi et al., 2007a; Imanishi, 2009; Veilleux et al., 2009; Imanishi et al., 2010a). Suppose the case that 90% of the total infrared (8–1000 m) luminosity of a LIRG is dominated by a compact, highly-obscured buried AGN, with a small (10%) contribution from spatially-extended star-forming activity. While the -band emission from the buried AGN can be highly flux-attenuated, spatially-extended PAH emission is unattenuated. If we observe such a LIRG in the -band, the fraction of the spatially-extended emission component, relative to the compact one, can be substantially higher than the actual energetic contribution to the total infrared luminosity, possibly misidentifying such a source as starburst-important. This possible ambiguity is largely overcome, if we observe the LIRG in the -band, because (1) the contribution from PAH emission features is much reduced, compared to the -band, and (2) the 18 m silicate dust absorption feature is significantly weaker than the 9.7 m feature. We thus choose the -band for our infrared imaging observations.
With the advent of high-sensitivity -band imaging cameras attached to 8-m class telescopes at good astronomical observing sites, -band high spatial resolution imaging observations of LIRGs have now become technically feasible. We have therefore performed such observations, using the Subaru 8.2-m telescope located on Mauna Kea, Hawaii, and the Gemini South 8.1-m telescope located at Cerro Pachon, Chile. Throughout this paper, H0 75 km s-1 Mpc-1, = 0.3, and = 0.7 are adopted.
2. TARGETS
Due to the strong Earth atmospheric background emission in the -band (17–23 m), sensitivity is still limited even with 8-m class telescopes. Therefore, we chose nearby LIRGs that are bright in the -band as our main targets. As LIRGs have highly concentrated nuclear gas and dust (Sanders & Mirabel, 1996; Soifer et al., 2000), many of the putative AGNs are likely to be obscured along virtually all directions at the inner regions and deeply buried. Such buried AGNs lack the narrow line regions at the 10–1000 pc scale, photoionized by the AGN radiation, and so optical spectroscopy fails to discover AGN (Seyfert) signatures. Our primary scientific goal is to search for such optically elusive buried AGNs in optically non-Seyfert LIRGs, through the detection of high emission surface brightness energy sources. In fact, high spatial resolution -band imaging, as a tool for quantitatively estimating the emission surface brightnesses of energy sources, is particularly effective at picking up buried AGNs with a dust covering factor of about unity, because almost all primary energetic radiation is converted to dust re-radiation, which can be probed with infrared observations. We selected LIRGs with luminous buried AGN signatures in X-ray, infrared, or millimeter spectra, as well as starburst-classified LIRGs (without buried AGN signatures) and optical Seyfert 2s (= obscured by torus-shaped dusty medium) of interest for comparison. A few very nearby well-studied galaxies with LIR 1011L⊙ were also included in our sample, because their proximity allows us to investigate the infrared emission morphology in more detail on a physical scale. Table 1 tabulates the 18 observed objects. The sample is heterogeneous. Our scientific goals are (1) to strengthen any buried AGN signatures suggested in previously obtained data, and (2) to determine if the emission surface brightnesses of energy sources in starburst-classified galaxies are indeed below the maximum limit sustained by a starburst phenomenon (1013L⊙ kpc-2), as widely argued.
3. OBSERVATIONS AND DATA ANALYSIS
3.1. -band Observations
Gemini -band (17–23 m) imaging observations were made using T-ReCS (Thermal-Region Camera Spectrograph; Telesco et al. 1998) on the Gemini South 8.1-m telescope, at Cerro Pachon, Chile. T-ReCS uses a Raytheon 320 240 pixel Si:As IBC array, with a pixel scale of 009. The field-of-view is 288 216. The detector was read out in correlated quadruple sampling (CQS) mode (Sako et al. 2003). The filter (18.3 m; 17.6–19.1 m) was used to trace the 18 m emission from LIRGs. The standard chop-nod technique (telescope nodding and secondary mirror chopping) was employed to subtract the background emission from Earth’s atmosphere and the telescope. Object signals were taken at four different positions: (Nod, Chop) = (1, A), (1, B), (2, A), and (2, B). However, for T-ReCS data, only one chop position was guided, and compact, diffraction-limited-images were obtained. At another chop position, the telescope was unguided, and stellar images were clearly degraded and spatially extended. Only the data taken at the guided chop position were used for our analysis, to investigate the intrinsic spatial distribution of the infrared 18 m emission in a reliable manner. The chop and nod throw was 15”. For some sources with spatially extended structures, the position angle of T-ReCS was arranged to simultaneously cover the emission from these interesting regions. The frame rate was 25.8 ms, and total on-source exposure time was 15–31 minutes. Table 2 summarizes our detailed observing log. Weather conditions were very good (low background level) in 2008 and 2009, but during the 2010 observing runs, a high Earth atmospheric background level allowed us to observe only bright sources.
Subaru -band imaging observations were made using COMICS (Kataza et al., 2000; Okamoto et al., 2003) on the Subaru 8.2-m telescope (Iye et al., 2004) atop Mauna Kea, Hawaii, under clear weather conditions. The details are shown in Table 2. The precipitable water vapor value was as low as 1 mm during the 2008 observing run, and 3–4 mm during the 2009 run. The (17.7 m; 17.25–18.15 m) filter was used to study the 18 m emission from LIRGs. COMICS employs a 320 240 Si:As IBC detector for imaging observations. The pixel scale is 013, providing a field of view of 42” 32”, if the full array is used. However, as the background emission was large for -band imaging observations, we used a partial-readout mode, to avoid saturating the array. Only 50–120 rows were read out, depending on weather conditions, particularly on the precipitable water vapor value. The standard chop-nod technique was employed to subtract background emission. The frame rate was 16–31 ms, depending on the actual background level at the time of observations, and the total on-source exposure time ranged from 16 to 60 minutes.
Our Gemini T-ReCS data were reduced using the IRAF-based analysis tool provided by the Gemini observatory 111http://www.gemini.edu/sciops/instruments/t-recs/data-format-and-reduction?q=node/10145. After inspecting individual frames to confirm that no bad frames were included, the task “mireduce” was used to combine frames to improve the signal-to-noise ratios. For some frames, a stripe-pattern noise was recognizable. We used the task “miclean” to correct for this noise pattern.
The Subaru COMICS data were analyzed using the IRAF-based software package provided by the COMICS team 222 http://canadia.ir.isas.ac.jp/comics/open/rbin/rbin.html. First, a flat-field image was created from frames with no object signals, and then individual frames were divided by the flat image. Bad pixels and pixels hit by cosmic rays were identified, and signal values in these pixels were interpolated from the signals of the surrounding pixels. The frames were summed to improve the signal-to-noise ratios.
For both Gemini South T-ReCS and Subaru COMICS data, flux calibrations were made by comparing the signals of the targets with those of nearby bright standard stars compiled by Cohen 333 http://www.gemini.edu/sciops/instruments/mir/Cohen_list.html. The estimated flux levels of the target objects with sufficient signal at different nod/chop positions agreed to within 0.1 mag. Thus, the adopted choice for the absolute flux level of standard stars may represent the largest uncertainty when compared with other flux measurements reported in the literature.
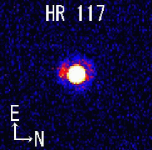
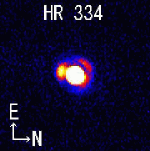
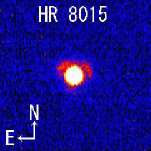
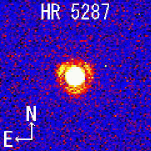
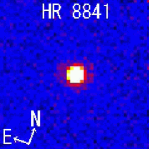
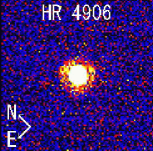
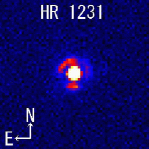
The observed nearby bright standard stars were also used to estimate the point spread function (PSF) at the observed wavelengths, at the time close to the target observations, in a sky direction similar to the targets. The standard star images in the -band (18.3 m) taken with Gemini South T-ReCS generally showed diffraction ring patterns around bright central peaks. Those in the -band taken with Subaru COMICS often showed the so-called Mitsubishi-pattern (three diamonds around central bright cores). Both of these observed features strongly suggest that nearly diffraction-limited image sizes were routinely achieved at 18 m for both the Gemini South and Subaru telescopes.
Standard stars were observed before and after the targets. The FWHM values differed slightly between the two datasets. Although the effects of seeing (Earth atmospheric turbulence) at 18 m are much smaller than at shorter wavelengths, all images can obviously suffer from a non-negligible amount of seeing-originated PSF broadening. Thus, it is reasonable to assume that the smallest FWHM is the most representative of the intrinsic PSF (Radomski et al., 2008). As standard stars are bright, we can estimate the FWHM by dividing the combined final frame into individual frames. We adopted the smallest FWHM values found in some individual frames as the PSF at 18 m (FWHMPSF).
The PSFs of standard stars were estimated using the IRAF task imexamine, a. Following Radomski et al. (2008), the Moffat function (Moffat, 1969) was basically adopted, but direct FWHM estimates were sometimes considered as a consistency check. In general, both values agreed for the data with sufficiently strong signals.
For Gemini South T-ReCS data, Radomski et al. (2008) measured the FWHM = 053 0039 at the same -band. Our adopted FWHM values for the standard star (FWHMPSF) ranged from 0515 to 0565, consistent with the measurements by Radomski et al. (2008). The Superantennae galaxy is at declination 72∘, and is very far south even for the Gemini South telescope site, resulting in a larger air mass, even at the meridian, than other LIRGs. The FWHM of HR 7383, the standard star of Superantennae, was actually slightly larger than the FWHMs of other standard stars, possibly because of the telescope primary mirror misalignment caused by a larger air mass. For Subaru COMICS data, the adopted FWHM values for the standard star PSFs fell in the 041–045 range. Thus, it is important to use the FWHM of a standard star observed at an air mass similar to the air mass of each target.
As our target objects, LIRGs, are generally fainter than bright standard stars, it was difficult to measure the FWHM values in individual frames in a reliable manner, due to the low signal-to-noise ratios. Thus, the FWHM values were reliably measurable only in the combined final frames. For the Gemini South T-ReCS LIRG data, one final dataset consisted of a 15-min combined exposure, and one or two such datasets were taken. For moderately bright LIRGs, we inspected individual frames in each dataset, but no obvious continuous image drift was detected. Therefore, we measured the FWHM values in the final dataset. For objects with two such datasets, a smaller FWHM value was adopted.
For Subaru COMICS data of LIRGs, one dataset consisted of 4-minute exposures, in which we could identify object signals and roughly measure the object peak positions. For some LIRGs, the peak position continuously shifted along one direction at a maximum distance of a few pixels. Since the air mass changed as observations proceeded, this could be explained by the differences in refraction between the optical (guiding camera) and mid-infrared light (COMICS camera) due to the Earth’s atmosphere. We corrected for this shift manually at both the pixel scale (using the IRAF task imshift) and the sub-pixel scale (using the IRAF task imshift and imalign). We then produced a final combined frame, and measured the FWHM values. The sub-pixel scale shift often provided larger FWHM values than the pixel scale shift, possibly because of the signal split into surrounding pixels during the sub-pixelization process. We adopted the smaller FWHM values as the 18 m emission sizes of LIRGs (FWHMLIRG).
The intrinsic 18 m emission sizes of LIRGs (FWHMintrinsic) were estimated using the formula FWHMintrinsic2 = FWHMLIRG2 FWHMPSF2. While the FWHM values for the standard stars were derived from individual short exposure frames, those for LIRGs were obtained from combined frames with longer exposure times. The FWHM values in the final combined frames are inevitably larger than the smallest FWHM values found in some individual short exposure frames, due to possible telescope tracking error (drift) and/or possible inclusion of poorer seeing data in some fraction of individual frames than the remaining majority of frames. Thus, the FWHMintrinsic2 values for LIRGs estimated in this way are conservative upper limits, or the estimated emission surface brightnesses (= flux divided by size) of LIRGs are conservative lower limits. However, our main conclusions are robust to this ambiguity because the presence of a luminous AGN is considered only if the lower limit of the emission surface brightness of the energy source in the LIRG substantially exceeds the maximum allowed value for a starburst phenomenon (see 5).
Finally, as mentioned by Radomski et al. (2008), spectral energy distributions differ between LIRGs and standard stars, in such a way that standard stars are generally bluer than LIRGs. Hence, the effective wavelength in the observed filters can be slightly different (i.e., shorter for standard stars), possibly providing different PSFs between LIRGs and standard stars. However, the widths of the (Gemini South T-ReCS) and (Subaru COMICS) filters used are so narrow that this effect is practically negligible (Radomski et al., 2008). Even if it were non-negligible, this effect would result in a slightly larger PSF for LIRGs (red) than bluer standard stars, providing upper limits (lower limits) for the emission size (emission surface brightnesses) of LIRGs. Again, this ambiguity does not alter our conclusions (see 5).
3.2. 10 m Observations
When precipitable water vapor values were high (3 mm) during Subaru COMICS observing runs, we performed -band (8–13 m) imaging observations of bright sources, mostly unobscured quasars (QSOs), as a backup program. The (8.4–9.2 m) or (11.2–12.1 m) filters were used, because meaningful data could be obtained for bright sources in these filters (compared to the filter) even under high precipitable water conditions. It is interesting to measure the emission surface brightnesses of these QSOs (i.e., known luminous unobscured AGNs), based on the 10 m observations. Table 3 shows our observing log.
For the 2006 observing run, only 160 rows were read out. The standard chop-nod technique was employed to subtract the background emission. The exposure times were 41–100 ms, and the total on-source exposure time ranged from 13 to 53 minutes. For the 2009 observing run of the LIRG Mrk 266, observations were made only at the nod-1 position, using the full array, to simultaneously cover both the northern and southern nuclei with a separation of 10”.
The FWHMs of standard stars and target objects were derived in the same way as outlined for the 18 m observations. The IRAF task imexamine was used, and the Moffat function was basically assumed. For bright standard stars, data were divided into individual frames, and the smallest FWHM value was adopted as the intrinsic PSF because any unexpected factors (tracking errors or sudden seeing degradation during parts of the exposure time) work to increase the FWHM values. As the QSOs were relatively bright, FWHM values were derivable in individual frames (100-s exposure). The smallest FWHM value was adopted. As the exposure time of individual frames was longer for QSOs (100 s) than standard stars (5 s), this procedure still provides conservative upper limits for the intrinsic spatial extent of 10 m emission of QSOs. The 10 m emission of QSOs was dominated by compact components. The LIRG Mrk 266 displayed a spatially extended emission, compared to the adopted PSF.
3.3. Spitzer IRS Spectroscopy
The presence of spatially extended, faint fuzzy emission, undetectable with our ground-based 18 m imaging observations, can be investigated by comparing our data with the spectra taken by Spitzer IRS LL2 (14.0–21.3 m) (Houck et al., 2004), if available. The aperture size of IRS LL2 with 105 is sufficiently large to cover any extended diffuse infrared 18 m emission. As our targets are well-studied LIRGs, Spitzer IRS LL2 spectra at 18 m are available for many of them (Brandl et al., 2006; Roussel et al., 2006; Armus et al., 2007; Imanishi et al., 2007a; Wu et al., 2009). However, to our knowledge, the flux-calibrated Spitzer IRS LL2 spectra have not been published for IRAS 205514250 and VV 114 E, although LL2 observations have been performed according to the Spitzer observing log. We have analyzed archival spectra of these sources. For IRAS 15250+3609 and NGC 1377, strong 18 m silicate dust absorption features were found in the flux-calibrated LL2 spectra (Armus et al., 2007; Roussel et al., 2006). We re-analyzed the IRS spectra to estimate the optical depth of the 18 m silicate dust absorption feature based on our method (Imanishi et al., 2007a; Imanishi, 2009; Imanishi et al., 2010a), which is required for dust extinction correction to the AGN emission (5.1). For NGC 5253, Spitzer IRS SH high-resolution (R 600) spectrum at 18 m, with spectral mapping mode (total covered area is 222 334) is available (Beirao et al., 2006). This is used for the flux comparison at 18 m. For ESO 602G025, NGC 7592, and Arp 193, we find no record of Spitzer IRS spectroscopic observations at 18 m.
The Spitzer IRS observing log of the sources analyzed in this study is shown in Table 4. All four modules, SL2 (5.2–7.7 m), SL1 (7.4–14.5 m), LL2 (14.0–21.3 m), and LL1 (19.5–38.0 m) were used. We analyzed all data to obtain the full 5–35 m low-resolution (R 100) spectra.
Data analysis was performed in a standard manner, using methods similar to those employed by Imanishi et al. (2007a), Imanishi (2009), and Imanishi et al. (2010a). The latest pipeline-processed data products available at the time of our analysis were used. Frames taken at position A were subtracted from those taken at position B to remove background emission, consisting mostly of zodiacal light. The spectra extracted for the A and B positions were then summed. Wavelength and flux calibrations were made on the basis of the Spitzer pipeline-processed data. For the SL1 spectra, data at 14.5 m in the observed frame are invalid (Infrared Spectrograph Data Handbook, version 1.0), and were therefore removed. For the LL1 spectra, data at 35 m were not used due to excessive noise levels. These data are not necessary for our scientific discussion. When flux discrepancies between SL1 and LL2 were discernible in such a way that the LL2 flux (105 wide slit) was larger than the SL1 flux (37), we adjusted the SL1 (and SL2) flux to match the LL2 flux.
4. RESULTS
4.1. Imaging
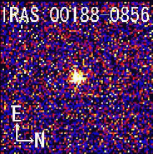
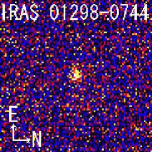
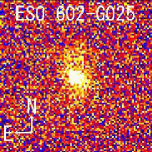
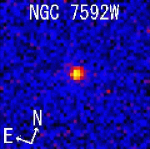
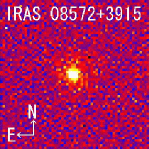
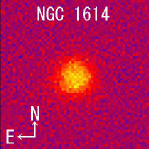
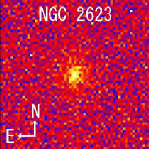
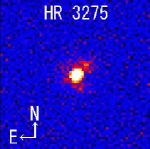
Figures 1 and 2 show the infrared 18 m images of LIRGs obtained with Gemini-South T-ReCS -band (18.3 m) and Subaru COMICS -band (17.7 m) observations, respectively. Photometric measurements are summarized in Table 5.
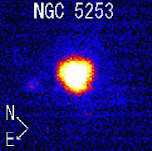
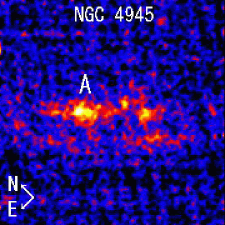
Most of the bright standard stars show clear signatures of a diffraction ring or partial ring, strongly suggesting that diffraction-limited images were routinely obtained at 18 m under the normally good, frequently achievable weather conditions at the Gemini-South and Subaru telescopes. Hence, at 18 m, the PSF is stable, and the possible spatial extents of LIRGs can be investigated in a reliable manner, with the data only minimally affected by the time variation of the PSF. For LIRGs, only VV 114 E, ESO 602G025, NGC 4945, NGC 1614, and Arp 193 display clearly detectable spatially extended structures. The 18 m emission of NGC 5253 is spatially compact but resolvable. The remaining sources are dominated by spatially compact emission, which is not clearly distinguishable from the PSFs of standard stars.
For VV 114 E, the two faint knots below the E-2 nucleus in Figure 1 were not recognizable in the low spatial resolution 15 m image taken with ISO, but similar structures were seen at 1.1 m (Le Floc’h et al., 2002), suggesting that they are starburst knots situated between the VV 114 E and W merging nuclei.
4.2. Spectroscopy
Figure 3 shows the final Spitzer IRS spectra. IRAS 15250+3609, IRAS 205114250, and NGC 1377 show clearly detectable 18 m silicate dust absorption features, while the feature is weak in VV 114 E. The estimated optical depths, based on our method (Imanishi et al., 2007a) are 0.6, 0.7, and 0.85 for IRAS 15250+3609, IRAS 205114250, and NGC 1377, respectively.
5. DISCUSSION
5.1. Intrinsic Emission Surface Brightnesses of Energy Sources
5.1.1 Comparison of the 18 m Flux Levels
Our ground-based 18 m imaging observations may not be particularly sensitive to spatially extended diffuse emission outside the detected compact cores. To test the presence of a possible fuzzy component, we compare our 18 m fluxes for the core components with 18 m fluxes measured with Spitzer IRS spectra (105 aperture or even larger for spectral mapping mode; 3.3) in Table 5. Given the 20% flux uncertainties of Spitzer spectra (Spitzer Infrared Spectrograph Data Handbook, version 1.0), we see significantly (20%) smaller fluxes in our measurements only in VV 114 E and NGC 4945, both of which clearly display spatially extended emission structures. Therefore, we find no strong evidence that the contribution from spatially extended diffuse emission outside the compact core component is important, but is simply missed with our ground-based imaging observations, in the majority of the observed LIRGs.
For IRAS 08572+3915 and 15250+3609, our fluxes are slightly (100 mJy) smaller than Spitzer IRS measurements, although the discrepancy is close to the possible flux calibration uncertainty of Spitzer IRS. Even if this residual flux with 100 mJy at 18 m were due to spatially extended diffuse starburst emission below our detection limit, the expected 60 m flux is 1 Jy, if we adopt typical spectral energy distributions of starburst galaxies at 17–30 m (Brandl et al., 2006), and IRAS 60-m to 25-m flux ratios for the prototypical starburst galaxy, M82 (4). The expected 60 m flux for the possible extended starburst component is a factor of 7 smaller than the measured IRAS 60 m fluxes of IRAS 08572+3915 and 15250+3609 (Table 1), suggesting that any undetected spatially extended starburst emission cannot dominate the large infrared luminosities of these LIRGs.
For VV 114 E, the sum of the 18 m fluxes for the compact components (E-1 and E-2) measured with our ground-based observations are 30 lower than the Spitzer IRS measurement. Thus, a substantial amount of diffuse, faint emission component may be present in VV 114 E.
For NGC 4945, the nuclear 18 m flux (18 18 region of the brightest point A in Figure 1) is 200 mJy. When signals in the region of discernible emission (89 36) are integrated, the 18 m flux becomes 1000 mJy. These fluxes are still smaller than the Spitzer IRS 18 m flux of 1500 mJy (105 aperture), suggesting that low surface brightness diffuse emission may exist, and which is not detectable with our ground-based 18 m imaging observations in NGC 4945.
5.1.2 Size and Emission Surface Brightness
The sizes of the 18 m emission in apparent and physical scales, as estimated by the method described in 3.1, are summarized in Table 6. For LIRGs whose core emission is clearly extended (VV 114 E, ESO 602G025, NGC 5253, NGC 1614, and Arp 193), the actual values are adopted for the emission size. However, for the remaining LIRGs, image sizes are only marginally larger than the PSFs of the corresponding standard stars. Part of this effect may be artificially induced by the longer exposures time of LIRGs compared to standard stars (3.1). For LIRGs whose 18 m image sizes are not clearly distinguishable from the PSFs, upper limits are shown for the sizes of the 18 m emission regions. The emission surface brightnesses are estimated by dividing the 18 m continuum luminosity (Lν) with the physical scales of the 18 m emitting regions (Table 6).
For sources for which only -band imaging observations were performed under high precipitable water vapor conditions (3.2), we estimated the sizes of the 10 m emission regions and emission surface brightnesses from the -band data, using methods similar to those outlined above. Table 7 summarizes the results.
5.1.3 Flux-attenuation Correction of 18 m Continuum Emission
For LIRGs with clear 18 m silicate dust absorption features, it is suggested that the 17–18 m continuum emission in the rest-frame (outside the 18 m silicate dust absorption feature) is obscured and flux-attenuated by foreground absorbing dust. Proper correction of this flux attenuation is necessary to estimate the intrinsic, extinction-corrected luminosities of the dust-obscured energy sources from the 18 m observations.
As a dust extinction curve as long as 18 m is not well-constrained observationally, we combine the theoretical dust extinction curve at 7 m with the observed extinction curve at shorter wavelengths. We adopt the following relations.
- 1.
- 2.
- 3.
-
4.
A17μm/A7μm 1.03 (Draine & Lee, 1984)
From these relations, we obtain A17μm = 1.3 . For example, for a source with = 1, the 17–18 m continuum flux is attenuated by a factor of 3.3. By adopting the values based on our estimate (Imanishi et al. 2007a; 4.2 of this paper), the corrected emission surface brightnesses are derivable for LIRGs that exhibit clear 18 m silicate dust absorption features. The corrected values are shown in Table 6.
5.1.4 Dust Covering Factor Correction
Infrared observations can probe only emission absorbed by dust. For buried AGNs embedded in dust in virtually all directions, or starbursts whose individual stellar energy sources are surrounded by local dust with a covering factor close to unity, the intrinsic luminosities of primary energetic radiation can reasonably be estimated from the infrared 18 m observations. However, for AGNs with a dust covering factor significantly smaller than unity, a large amount of energetic radiation escapes without being absorbed by dust. Such unabsorbed emission cannot be probed through infrared observations. PG QSOs are unobscured Seyfert 1 AGNs, meaning that at least the direction along our line-of-sight is dust-free, in which case infrared observations can provide only lower limits for the intrinsic emission surface brightnesses of energy sources. Following Risaliti et al. (2010), we apply a factor of 5 correction for unobscured Seyfert 1 AGNs. Namely, the intrinsic emission surface brightnesses of the energy sources are 5 times larger than those estimated from infrared 10 m observations. These corrected values are also summarized in Table 7.
5.1.5 Do the 18 m Observations Precisely Trace the Spatial Distribution of 60 m Emission?
LIRGs usually show an infrared emission peak at 60 m, and their total infrared luminosities are dominated by emission from big dust grains in thermal equilibrium with radiation (Sanders & Mirabel, 1996). In the Galactic diffuse inter-stellar medium, emission from PAHs and very small grains, which are transiently-heated and not in thermal equilibrium, contributes importantly to the infrared 18 m radiation (Desert et al., 1990). Then, a question may arise whether our 18 m observations indeed probe the spatial distribution of dust in thermal equilibrium heated by the dominant energy sources in LIRGs. We, however, believe that the 18 m observations are a good method to investigate the spatial distribution of 60 m emission in LIRG’s nuclei, for the following reasons.
First, in the case of a normal starburst, it is very likely that PAHs, very small grains, and big dust grains are spatially well mixed with stellar energy sources, and are heated and/or excited by the stellar radiation field. The spatial distribution of the emission from PAHs, very small grains, and big dust grains at LIRG’s cores should not change dramatically on a few 100 pc scale.
Next, in the case of an AGN, PAHs are largely destroyed by strong X-rays, so that PAH contribution to the observed infrared radiation becomes negligible (Voit, 1992). Furthermore, high radiation density around an AGN (1) heats big dust grains in thermal equilibrium to high temperature, and (2) destroys very small grains selectively, both of which make the contribution from big dust grains dominant to the infrared 18 m radiation.
Finally, in a buried AGN, the energy source (= a mass-accreting supermassive blackhole) is more centrally-concentrated than the surrounding dust, so that dust temperature is higher at the inner part, closer to the central energy source, than the outer part. Assuming approximately blackbody radiation, emission at a shorter infrared wavelength comes from more inside than that at a longer infrared wavelength (Figure 2 of Imanishi et al. 2007a). Namely, the 18 m emission size is intrinsically smaller than the 60 m emission size, around a buried AGN with centrally-concentrated energy source geometry. The same situation could occur, if an exceptionally centrally-concentrated, extreme starburst is considered (Figure 1e of Imanishi et al. 2007a). However, even for a luminous energy source with 1012L⊙, the intrinsic size difference between the 18 m and 60 m emitting regions should appear on a physical scale much smaller than 100 pc, and should not be discernible in our spatial resolution of a few 100 pc physical scale for the majority of the observed LIRGs.
Summarizing, the spatial extent of the 18 m emission is taken to be representative of that of the 60 m emission at LIRG’s cores on our physical resolution scale. The emission surface brightnesses estimated from our 18 m imaging observations can put important constraints on the nature of energy sources at LIRG’s cores.
5.2. Individual Sources
In Tables 6 and 7, sources are categorized into three groups: (1) The lower limit for the emission surface brightness of the energy source is 1013L⊙ kpc-2, the maximum value achieved by a starburst phenomenon. (2) The actual value is substantially smaller than the starburst upper limit. (3) The lower limit is smaller than the starburst upper limit. We discuss these results on an individual source basis, by comparison with other data reported in the literature.
5.2.1 Nearby Sources with Energetically Important AGNs
The following five sources at 0.1 are diagnosed to be AGN-important through infrared 2.5–35 m spectroscopy: NGC 1377, IRAS 08572+3915, IRAS 15250+3609, Superantennae, and IRAS 205514250 (Table 1, column 10). The estimated emission surface brightnesses of the energy sources exceed 1013L⊙ kpc-2 (the maximum value of a starburst phenomenon) by a factor of 3 for IRAS 08572+3915 and 15250+3609 (Table 6), supporting the presence of luminous buried AGNs in these sources. For Superantennae, IRAS 205514250, and NGC 1377, the lower limits of the emission surface brightnesses only barely exceed 1013L⊙ kpc-2. As Superantennae is classified optically as a Seyfert 2 (Table 1), the dust covering factor around that AGN could be smaller than the other buried AGN candidates (IRAS 205514250 and NGC 1377), so that the intrinsic emission surface brightness could be higher than our estimate in Table 6. In these three sources, although the presence of a luminous AGN is a possibility, the identity of the energy sources is not strongly constrained from our 18 m imaging observations.
5.2.2 Distant Sources with Energetically Important AGNs
The five ULIRGs, IRAS 000910736, 001880856, 010042237, 012980744, and 041032838 are also classified into buried-AGN-important galaxies through infrared 2.5–35 m spectroscopy, but their redshifts are larger than 0.1 (Table 1). The lower limits of the emission surface brightnesses are below or only barely larger than 1013L⊙ kpc-2, so that the constraints on the energy sources based on our infrared imaging methods are weak. Observational constraints on the size of emission regions are practically limited by the apparent spatial extent of the infrared emission, which corresponds to a larger physical scale for more distant sources. Higher spatial resolution imaging observations at 18 m, using a proposed 30-m class extremely large telescope (Tokunaga et al., 2010; Okamoto et al., 2010) will be required to better constrain the energy sources of ULIRGs at 0.1.
5.2.3 Unobscured AGNs
In Table 7, the emission surface brightnesses of five PG QSOs (= unobscured Seyfert 1 AGNs) are estimated from 10 m imaging data, and their lower limits are close to or barely exceed 1013L⊙ kpc-2. Although these results are consistent with the AGN-dominated picture of these PG QSOs, further quantitative discussions are difficult because of (1) the uncertainty of the dust covering factor correction, and (2) the possibly lower PSF stability of the 10 m imaging data compared to our 18 m results (1).
5.2.4 Starburst and AGN Co-existing Sources
In four LIRGs, NGC 2623, NGC 7592 W, VV 114 E, and Mrk 266 N, the presence of an obscured AGN is suggested, but starburst activity is also strong (Table 1, column 10). The estimated lower limits for the emission surface brightnesses are far below 1013L⊙ kpc-2, and so our data do not provide evidence for energetically important AGNs.
NGC 4945 also belongs to this class. Due to its proximity (distance 4.0 Mpc), the nuclear region is spatially resolved at small physical scales (1” corresponds to 20 pc). The bright region, denoted “A” in Figure 1, is observed as an elongated peak in the infrared -band (3.5 m) and -band (10 m) (Moorwood et al., 1996; Marconi et al., 2000), but at 18 m, it is barely resolved into two distinct peaks with a separation of 05, possibly because of reduced dust extinction at 18 m. The left (NE) peak is even brighter; this might be the location of the putative buried AGN suggested from X-ray observations at 10 keV (Iwasawa et al., 1993; Done et al., 1996; Guainazzi et al., 2000). Two fainter distinct emission components are seen at the SW of nucleus A. A similar pattern is seen in the high spatial resolution infrared -band (2.2 m) image (Marconi et al., 2000). This is likely due to starburst knots.
5.2.5 Starburst-dominant Sources
Three LIRGs, NGC 1614, Arp 193, and ESO 602G025, have no obvious luminous AGN signatures in any observational data obtained to date, and are consistent with a starburst-dominant picture. These LIRGs were observed as a control sample to determine whether these starburst-classified galaxies show spatially extended structures and emission surface brightnesses within the starburst range. As expected, spatially extended emission structures and low emission surface brightnesses are confirmed. Thus, for these LIRGs, our 18 m imaging data support a starburst-dominant nature.
NGC 5253 is a very nearby galaxy (distance 3.9 Mpc), dominated by a nuclear super star cluster (Gorjian et al., 2001; Vanzi & Sauvage, 2004; Alonso-Herrero et al., 2004). We observed this galaxy to determine whether emission surface brightness can substantially exceed the maximum value for a starburst phenomenon (1013L⊙ kpc-2), if only a super star cluster region is extracted. The 18 m emission is spatially compact, but is resolved. The emission surface brightness estimated based on our 18 m image is 1.5 1013L⊙ kpc-2, roughly comparable to the maximum allowed value by a starburst phenomenon.
5.3. Energy Sources
A natural explanation for the energy sources with emission surface brightnesses considerably higher than 1013L⊙ kpc-2 is an AGN, because (1) AGN activity can have high radiative energy generation efficiency (1) and (2) even a super star cluster produces only 1013L⊙ kpc-2 (5.2.5). In fact, high emission surface brightnesses are preferentially indicated for LIRGs with luminous AGN signatures in other observational data, such as infrared 2.5–35 m spectroscopy and/or X-ray observations at E 2 keV (Table 1, column 10).
Thompson (2009) argued that the emission surface brightness of a starburst phenomenon can exceed 1013L⊙ kpc-2, if the average dust temperature is T 200K. Theoretically, the maximum surface brightness of a starburst phenomenon is determined by the balance of stellar radiation pressure to dust and gravitational boundaries (Thompson et al., 2005). Under high stellar radiation density, dust and gas (collisionally coupled with dust) are expelled away, and further star formation activity is suppressed (Thompson et al., 2005). At a high average dust temperature, T 200K, some fraction of small, fragile dust can be sublimated, decreasing the total dust opacity to stellar radiation, and possibly increasing the maximum allowed emission surface brightness of a starburst. If this were the case in many LIRGs, the constraint of emission surface brightnesses of 1013L⊙ kpc-2 would not serve as a strong AGN signature.
Observationally, the spectral energy distributions of local LIRGs usually show peaks at 60 m, indicating typical dust temperatures of T 50 K (Clements et al., 2010). For dust temperatures of T 200 K, the infrared emission should peak at 15 m, but no such sources are found in our sample (Table 1). Riechers et al. (2009) also calculated that the maximum dust temperature for a starburst is T 88K. At present, the proposed starburst with T 200 K is not strongly supported from the observational point of view.
The only way to reconcile the T 200 K starburst scenario and the observed infrared spectral energy distribution in LIRGs is that the T 200 K starbursts are occurring only in the centrally concentrated regions of LIRG’s nuclei, and are surrounded by large amounts of nuclear dust (similar to buried AGN geometry; Figure 1e of Imanishi et al. 2007a). In this geometry, the original T 200 K starburst emission is once absorbed by the surrounding nuclear dust, and the re-emitted infrared dust emission indicates cooler temperatures, as observed in actual LIRGs. However, LIRG’s nuclear regions are known to contain large amounts of high-density molecular gas, sufficient to trigger star formation (Gao & Solomon, 2004; Imanishi et al., 2007b; Wilson et al., 2008; Imanishi et al., 2009). Thus, it seems reasonable for star formation to occur in the large volumes of LIRG’s nuclear regions occupied by high-density gas, and it is not clear why stars are formed only in the centrally concentrated regions of LIRG’s nuclei. Therefore, we consider that high emission surface brightness energy sources at LIRG’s cores are good signatures of AGNs, if not definitive AGN evidence.
6. SUMMARY
The results of ground-based, high spatial resolution infrared 18 m imaging observations of nearby LIRGs were presented. The intrinsic size of the infrared 18 m emitting regions was estimated by comparison with the PSFs of standard stars, using (close to) diffraction-limited images. Emission surface brightnesses were then constrained. We drew the following conclusions from our observations:
-
1.
LIRGs with luminous AGN signatures seen in previous infrared spectroscopy and/or X-ray observations at 2 keV tended to show compact 18 m emission, while starburst-classified LIRGs with no obvious AGN signatures in previous observations displayed spatially extended morphologies with low emission surface brightnesses. For some fraction of the former LIRGs at 0.1, the lower limits of the emission surface brightnesses were constrained to 1013L⊙ kpc-2, higher than the maximum value sustained by a starburst phenomenon, as argued theoretically and actually observed. A luminous AGN is a natural energy source that can produce such a high emission surface brightness.
-
2.
For distant LIRGs at 0.1, classified as AGN important through previous observations, 18 m emission was generally spatially compact. However, the lower limits of the emission surface brightness were below or only barely exceed the upper limit expected from a starburst phenomenon. We could not place strong constraints on the presence of luminous AGNs for these distant sources, simply because the spatial resolution of ground-based 8-m class telescopes is still insufficient at 18 m.
-
3.
We estimated the emission surface brightness of the super star cluster in the very nearby galaxy NGC 5253 to be 1013L⊙ kpc-2. This did not support the possibility that the emission surface brightness could be 1013L⊙ kpc-2 if only a super star cluster region is extracted.
References
- Alonso-Herrero et al. (2004) Alonso-Herrero, A., Takagi, T., Baker, A. J., Rieke, G. H., Rieke, M. J., Imanishi, M., & Scoville, N. 2004, ApJ, 612, 222
- Alonso-Herrero et al. (2006) Alonso-Herrero, A., Colina, L., Packham, C., Diaz-Santos, T., Rieke, G. H., Radomski, J. T., & Telesco, C. M. 2006, ApJ, 652, L83
- Armus et al. (2007) Armus, L., et al. 2007, ApJ, 656, 148
- Bardeen (1970) Bardeen, J. M. 1970, Nature, 226, 64
- Beirao et al. (2006) Beirao, P., Brandl, B. R., Devost, D., Smith, J. D., Hao, L., & Houck, J. R. 2006, ApJ, 643, L1
- Bergman et al. (1992) Bergman, P., Aalto, S., Black, J. H., & Rydbeck, G. 1992, A&A, 265, 403
- Braito et al. (2003) Braito, V. et al. 2003, A&A, 398, 107
- Braito et al. (2009) Braito, V., Reeves, J. N., Della Ceca, R., Ptak, A., Risaliti, G., & Yaqoob, T. 2009, A&A, 504, 53
- Brandl et al. (2006) Brandl, B. R., et al. 2006, ApJ, 653, 1129
- Chiar & Tielens (2006) Chiar, J. E., & Tielens, A. G. G. M. 2006, ApJ, 637, 774
- Clements et al. (2010) Clements, D. L., Dunne, L., & Eales, S. 2010, MNRAS, 403, 274
- Conti (1991) Conti, P. S. 1991, ApJ, 377, 115
- Desert et al. (1990) Desert, F. -X., Boulanger, F., & Puget, J. L. 1990, A&A, 237, 215
- Diaz-Santos et al. (2008) Diaz-Santos, T., Alonso-Herrero, A., Colina, L., Packham, C., Radomski, J. T., & Telesco, C. M. 2008, ApJ, 685, 211
- Done et al. (1996) Done, C., Madejski, G. M., & Smith, D. A. 1996, ApJ, 463, L63
- Draine & Lee (1984) Draine, B. T., & Lee, H. M. 1984, ApJ, 285, 89
- Duc et al. (1997) Duc, P. -A., Mirabel, I. F., & Maza, J. 1997, A&AS, 124, 533
- Dudley & Wynn-Williams (1997) Dudley, C. C., & Wynn-Williams, C. G. 1997, ApJ, 488, 720
- Elmegreen (1999) Elmegreen, B. G. 1999, ApJ, 517, 103
- Evans et al. (2008) Evans, A. S. et al. 2008, ApJ, 675, L69
- Franceschini et al. (2003) Franceschini, A. et al. 2003, MNRAS, 343, 1181
- Gao & Solomon (2004) Gao, Y., & Solomon, P. M. 2004, ApJS, 152, 63
- Gorjian et al. (2001) Gorjian, V., Turner, J. L., & Beck, S. C. 2001, ApJ, 554, L29
- Guainazzi et al. (2000) Guainazzi, M., Matt, G., Brandt, W. N., Antonelli, L. A., Barr, P., & Bassani, L. 2000, A&A, 356, 463
- Heckman et al. (1990) Heckman, T. M., Armus, L., & Miley, G. K. 1990, ApJS, 74, 833
- Houck et al. (2004) Houck, J. R., et al. 2004, ApJS, 154, 18
- Imanishi (2006) Imanishi, M. 2006, AJ, 131, 2406
- Imanishi (2009) Imanishi, M. 2009, ApJ, 694, 751
- Imanishi & Dudley (2000) Imanishi, M., & Dudley, C. C. 2000, ApJ, 545, 701
- Imanishi et al. (2006) Imanishi, M., Dudley, C. C., & Maloney, P. R. 2006, ApJ, 637, 114
- Imanishi et al. (2007a) Imanishi, M., Dudley, C. C., Maiolino, R., Maloney, P. R., Nakagawa, T., & Risaliti, G. 2007a, ApJS, 171, 72
- Imanishi et al. (2010a) Imanishi, M., Maiolino, R., & Nakagawa, T. 2010a, ApJ, 709, 801
- Imanishi et al. (2008) Imanishi, M., Nakagawa, T., Ohyama, Y., Shirahata, M., Wada, T., Onaka, T., & Oi, N. 2008, PASJ, 60, S489
- Imanishi et al. (2010b) Imanishi, M., Nakagawa, T., Shirahata, M., Ohyama, Y., & Onaka, T. 2010b, ApJ, 721, 1233
- Imanishi et al. (2007b) Imanishi, M., Nakanishi, K., Tamura, Y., Oi, N., & Kohno, K. 2007b, AJ, 134, 2366
- Imanishi et al. (2009) Imanishi, M., Nakanishi, K., Tamura, Y., & Peng, C. -H. 2009, AJ, 137, 3581
- Itoh et al. (2008) Itoh, T., 2008, PASJ, 60, S251
- Iwasawa et al. (1993) Iwasawa, K., Koyama, K., Awaki, H., Kunieda, H., Makishima, K., Tsuru, T., Ohashi, T., & Nakai, N. 1993, ApJ, 409, 155
- Iye et al. (2004) Iye, M. et al., 2004, PASJ, 56, 381
- Kataza et al. (2000) Kataza, H., Okamoto, Y., Takubo, S., Onaka, T., Sako, S., Nakamura, K., Miyata, T., & Yamashita, T. 2000, Proc. SPIE, 4008, 1144
- Kim & Sanders (1998) Kim, D. -C., & Sanders, D. B., 1998, ApJS, 119, 41
- Le Floc’h et al. (2002) Le Floc’h, E., Charmandaris, V., Laurent, O., Mirabel, I. F., Gallais, P., Sauvage, M., Vigroux, L., & Cesarsky, C. 2002, A&A, 391, 417
- Lutz et al. (1996) Lutz, D. et al. 1996, A&A, 315, L269
- Maiolino et al. (2003) Maiolino, R. et al. 2003, MNRAS, 344, L59
- Marconi et al. (2000) Marconi, A., Oliva, E., van der Werf, P. P., Maiolino, R., Schreier, E. J., Macchetto, F., & Moorwood, A. F. M. 2000, A&A, 357, 24
- Mauersberger et al. (1997) Mauersberger, R., Henkel, C., Whiteoak, J. B., Chin, Y. -N., & Tieftrunk, A. R. 1996, A&A, 309, 705
- Meurer et al. (1997) Meurer, G. R., Heckman, T. M., Lehnert, M. D., Leitherer, C., & Lowenthal, J. 1997, AJ, 114, 54
- Mirabel et al. (1991) Mirabel, I. F., Lutz, D., & Maza, J. 1991, A&A, 243, 367
- Moffat (1969) Moffat, A. F. J. 1969, A&A, 3, 455
- Moorwood & Glass (1982) Moorwood, A. F. M., Glass, I. S. 1982, A&A, 115, 84
- Moorwood et al. (1996) Moorwood, A. F. M., van der Werf, P. P., Kotilainen, J. K., Marconi, A., & Oliva, E. 1996, A&A, 308, L1
- Nardini et al. (2010) Nardini, E., Risaliti, G., Watabe, Y., Salvati, M., & Sani, E. 2010, MNRAS, 405, 2505
- Nishiyama et al. (2008) Nishiyama, S., Nagata, T., Tamura, M., Kandori, R., Hatano, H., Sato, S., & Sugitani, K. 2008, ApJ, 680, 1174
- Nishiyama et al. (2009) Nishiyama, S., Tamura, M., Hatano, H., Kato, D., Tanabe, T., Sugitani, K., & Nagata, T. 2009, ApJ, 696, 1407
- Okamoto et al. (2003) Okamoto, Y. K., Kataza, H., Yamashita, T., Miyata, T., Sako, S., Takubo, S., Honda, M., & Onaka, T. 2003, Proc. SPIE, 4841, 169
- Okamoto et al. (2010) Okamoto, Y. K. et al. 2010, SPIE, 7735, 187
- Radomski et al. (2008) Radomski, J. T. et al. 2008, ApJ, 681, 141
- Riechers et al. (2009) Riechers, D. A., et al. 2009, ApJ, 703, 1338
- Rieke & Lebofsky (1985) Rieke, G. H., & Lebofsky, M. J. 1985, ApJ, 288, 618
- Risaliti et al. (2003) Risaliti, G., et al. 2003, ApJ, 595, L17
- Risaliti et al. (2006) Risaliti, G., et al. 2006, MNRAS, 365, 303
- Risaliti et al. (2010) Risaliti, G., Imanishi, M., & Sani, E. 2010, MNRAS, 401, 197
- Roche & Aitken (1984) Roche P. F., & Aitken D. K. 1984, MNRAS, 208, 481
- Roche & Aitken (1985) Roche P. F., & Aitken D. K. 1985, MNRAS, 215, 425
- Roussel et al. (2006) Roussel, H., et al. 2006, ApJ, 646, 841
- Sako et al. (2003) Sako, S., et al. 2003, PASP, 115, 1407
- Sanders & Mirabel (1996) Sanders, D. B., & Mirabel, I. F. 1996, ARA&A, 34, 749
- Sanders et al. (1988a) Sanders, D. B., Soifer, B. T., Elias, J. H., Madore, B. F., Matthews, K., Neugebauer, G., & Scoville, N. Z. 1988a, ApJ, 325, 74
- Sanders et al. (2003) Sanders, D. B., Mazzarella, J. M., Kim, D. -C., Surace, J. A., & Soifer, B. T. 2003, ApJ, 126, 1607
- Sanders et al. (1988b) Sanders, D. B., Soifer, B. T., Elias, J. H., Neugebauer, G., & Matthews, K. 1988b, ApJ, 328, L35
- Sani et al. (2008) Sani, E., et al. 2008, ApJ, 675, 96
- Schmidt & Green (1983) Schmidt, M., & Green, R. F. 1983, ApJ, 269, 352
- Siebenmorgen et al. (2008) Siebenmorgen, R., et al. 2008, A&A, 488, 83
- Soifer et al. (1987) Soifer, B. T., Sanders, D. B., Madore, B. F., Neugebauer, G., Danielson, G. E., Elias, J. H., Lonsdale, C. J., & Rice, W. L. 1987, ApJ, 320, 238
- Soifer et al. (2000) Soifer, B. T. et al. 2000, AJ, 119, 509
- Soifer et al. (2001) Soifer, B. T. et al. 2001, AJ, 122, 1213
- Telesco et al. (1998) Telesco, C. M., Pina, R. K., Hanna, K. T., Julian, J. A., Hon, D. B., & Kisko, T. M. 1998, Proc. SPIE, 3354, 534
- Teng et al. (2008) Teng, S. H., Veilleux, S., Wilson, A. S., Young, A. J., Sanders, D. B., & Nagar, N. M. 2008, ApJ, 674, 133
- Thim et al. (2003) Thim, F., Tammann, G. A., Saha, A., Dolphin, A., Sandage, A., Tolstoy, E., & Labhardt, L. 2003, ApJ, 590, 256
- Thompson et al. (2005) Thompson, T. A., Quataert, E., & Murray, N. 2005, ApJ, 630, 167
- Thompson (2009) Thompson, T. A. 2009, in ASP Conf. Ser. 408, The Starburst-AGN Connection, ed. W. Wang, Z. Yang, Z. Luo, and Z. Chen (San Francisco: Astronomical Society of the Pacific), 128 (arXiv:0908.1756)
- Thorne (1974) Thorne, K. S. 1974, ApJ, 191, 507
- Tokunaga et al. (2010) Tokunaga, Y. et al. 2010, SPIE, 7735, 79
- Vanzi & Sauvage (2004) Vanzi, L. & Sauvage, M. 2004, A&A, 415, 509
- Veilleux et al. (1995) Veilleux, S., Kim, D. -C., Sanders, D. B., Mazzarella, J. M., & Soifer, B. T. 1995, ApJS, 98, 171
- Veilleux et al. (1999) Veilleux, S., Kim, D. -C., & Sanders, D. B. 1999, ApJ, 522, 113
- Veilleux et al. (2009) Veilleux, S., et al. 2009, ApJS, 182, 628
- Voit (1992) Voit, G. M. 1992, MNRAS, 258, 841
- Walsh & Roy (1987) Walsh, J. R., & Roy, J-R. 1987, ApJ, 319, L57
- Werner et al. (1976) Werner, M. W., Gatley, I., Becklin, E. E., Harper, D. A., Loewenstein, R. F., Telesco, C. M., & Thronson, H. A. 1976, ApJ, 204, 420
- Wilson et al. (2008) Wilson, C. D., et al. 2008, ApJ, 178, 189
- Wu et al. (2009) Wu, Y., Charmandaris, V., Huang, J., Spinoglio, L., & Tommasin, S. 2009, ApJ, 701, 658
- Younger et al. (2008) Younger, J. D. et al. 2008, ApJ, 688, 59
| Object | Redshift | f12 | f25 | f60 | f100 | log LIR | f25/f60 | Optical | Buried |
|---|---|---|---|---|---|---|---|---|---|
| (Jy) | (Jy) | (Jy) | (Jy) | L⊙ | Class | AGN | |||
| (1) | (2) | (3) | (4) | (5) | (6) | (7) | (8) | (9) | (10) |
| IRAS 000910738 | 0.118 | 0.07 | 0.22 | 2.63 | 2.52 | 12.2 | 0.08 (C) | HII | a,b,c |
| IRAS 001880856 | 0.128 | 0.12 | 0.37 | 2.59 | 3.40 | 12.3 | 0.14 (C) | LI | a,b,c,d |
| IRAS 010042237 | 0.118 | 0.11 | 0.66 | 2.29 | 1.79 | 12.3 | 0.29 (W) | HII | a,b,c |
| IRAS 012980744 | 0.136 | 0.12 | 0.19 | 2.47 | 2.08 | 12.3 | 0.08 (C) | HII | a,b,c |
| IRAS 041032838 | 0.118 | 0.08 | 0.54 | 1.82 | 1.71 | 12.2 | 0.30 (W) | LI | a,b,e |
| IRAS 085723915 | 0.058 | 0.32 | 1.70 | 7.43 | 4.59 | 12.1 | 0.23 (W) | LI | a,b,c,d,f,g,h,i,j |
| IRAS 152503609 | 0.055 | 0.16 | 1.31 | 7.10 | 5.93 | 12.0 | 0.18 (C) | LI | b,c,h,k |
| Superantennae (IRAS 192547924) | 0.062 | 0.22 | 1.24 | 5.48 | 5.79 | 12.1 | 0.23 (W) | Sy2 | j,l,m,n |
| IRAS 205514250 | 0.043 | 0.28 | 1.91 | 12.78 | 9.95 | 12.0 | 0.15 (C) | LI (HII) | c,k,o,p,q |
| NGC 1377 | 0.006 | 0.56 | 1.93 | 7.43 | 5.95 | 10.1 | 0.26 (W) | Unc | r,s,t |
| NGC 1614 | 0.016 | 1.38 | 7.50 | 32.12 | 34.32 | 11.6 | 0.23 (W) | HII | |
| NGC 2623 | 0.018 | 0.21 | 1.81 | 23.74 | 25.88 | 11.5 | 0.08 (C) | Unc | u,v |
| NGC 7592 | 0.024 | 0.26 | 0.97 | 8.05 | 10.58 | 11.3 | 0.12 (C) | Sy2 (W),HII (E) | k |
| Arp 193 | 0.023 | 0.25 | 1.42 | 17.04 | 24.38 | 11.6 | 0.08 (C) | LI | |
| ESO 602G025 (IRAS 222871917) | 0.025 | 0.27 | 0.91 | 5.42 | 9.64 | 11.3 | 0.17 (C) | LI | |
| VV 114 E | 0.020 | 1.03 AAEmission from the eastern (VV 114 E) and western (VV 114 W) nuclei combined. | 3.65 AAEmission from the eastern (VV 114 E) and western (VV 114 W) nuclei combined. | 22.93 AAEmission from the eastern (VV 114 E) and western (VV 114 W) nuclei combined. | 31.55 AAEmission from the eastern (VV 114 E) and western (VV 114 W) nuclei combined. | 11.7 AAEmission from the eastern (VV 114 E) and western (VV 114 W) nuclei combined. | 0.16 (C) AAEmission from the eastern (VV 114 E) and western (VV 114 W) nuclei combined. | HII | i,w |
| NGC 4945 | 3.9 Mpc BBAdopted from Bergman et al. (1992) and Mauersberger et al. (1997). | 3.95 | 14.45 | 359.3 | 620.5 | 10.2 | 0.04 (C) | HII/LI | x,y,z,aa |
| NGC 5253 | 4.0 Mpc CCAdopted from Mauersberger et al. (1997) and Thim et al. (2003). | 2.61 | 11.96 | 30.51 | 29.36 | 9.3 | 0.39 (W) | HII (WR) |
Note. — Col.(1): Object name. ULIRGs are listed first, and then LIRGs are placed. The two very nearby galaxies, NGC 4945 and 5253 are put last. Col.(2): Redshift. For the two very nearby sources, NGC 4945 and 5253, distances are shown in Mpc. Col.(3)–(6): f12, f25, f60, and f100 are IRAS fluxes at 12 m, 25 m, 60 m, and 100 m, respectively, taken from Kim & Sanders (1998), Sanders et al. (2003), or IRAS FSC catalog. Col.(7): Decimal logarithm of infrared (81000 m) luminosity in units of solar luminosity (L⊙), calculated with D(Mpc)2 (13.48 + 5.16 + ) ergs s-1 (Sanders & Mirabel, 1996). Col.(8): IRAS 25-m to 60-m flux ratio. LIRGs with f25/f60 0.2 and 0.2 are classified as cool and warm sources (denoted as “C” and “W”), respectively, (Sanders et al., 1988b). Col.(9): Optical spectral classification. “HII”, “LI”, “Sy2”, and “Unc” mean HII-region, LINER, Seyfert 2, and optically unclassified, respectively. For most sources, the classification is based on Veilleux et al. (1995) and Veilleux et al. (1999). For Superantennae and IRAS 205514250, the classification by Mirabel et al. (1991) and Duc et al. (1997), respectively, is adopted. For NGC 4945, we adopt the classification by Heckman et al. (1990) and Moorwood et al. (1996). For NGC 5253, the classification is from Conti (1991) and Walsh & Roy (1987), and “WR” means a Wolf Rayet galaxy. For NGC 7592, “W” and “E” indicate the western and eastern nuclei, respectively. Col.(10): Buried (obscured) AGN signatures and references. (a): Imanishi et al. (2007a). (b) Veilleux et al. (2009). (c): Nardini et al. (2010). (d): Imanishi et al. (2006). (e): Teng et al. (2008). (f): Dudley & Wynn-Williams (1997). (g): Imanishi & Dudley (2000). (h): Armus et al. (2007). (i): Imanishi et al. (2007b). (j): Imanishi et al. (2008). (k): Imanishi et al. (2010b). (l): Risaliti et al. (2003). (m): Braito et al. (2003). (n): Braito et al. (2009). (o): Franceschini et al. (2003). (p): Risaliti et al. (2006). (q): Sani et al. (2008). (r): Roussel et al. (2006). (s): Imanishi (2006). (t): Imanishi et al. (2009). (u): Maiolino et al. (2003). (v): Evans et al. (2008). (w): Le Floc’h et al. (2002). (x): Iwasawa et al. (1993). (y): Done et al. (1996). (z): Guainazzi et al. (2000). (aa): Itoh et al. (2008).
| Object | Date | Integration time [min] | Telescope/instrument |
|---|---|---|---|
| (1) | (2) | (3) | (4) |
| Superantennae (1) | 2008 Sep 10 | 15.5 | Gemini-S/T-ReCS |
| IRAS 205514250 | 2008 Sep 10 | 15.5 | Gemini-S/T-ReCS |
| IRAS 010042237 | 2008 Sep 10 | 31 | Gemini-S/T-ReCS |
| IRAS 041032838 | 2008 Sep 10 | 31 | Gemini-S/T-ReCS |
| VV 114 E | 2008 Sep 10 | 15.5 | Gemini-S/T-ReCS |
| NGC 1377 | 2008 Sep 10 | 15.5 | Gemini-S/T-ReCS |
| Superantennae (2) | 2009 Sep 8 | 15.5 | Gemini-S/T-ReCS |
| IRAS 000910738 | 2009 Sep 8 | 31 | Gemini-S/T-ReCS |
| IRAS 001880856 | 2009 Sep 8 | 31 | Gemini-S/T-ReCS |
| IRAS 012980744 | 2009 Sep 8 | 31 | Gemini-S/T-ReCS |
| ESO 602G025 | 2009 Sep 8 | 15.5 | Gemini-S/T-ReCS |
| NGC 4945 | 2010 May 31 | 15.5 | Gemini-S/T-ReCS |
| NGC 5253 | 2010 May 31 | 15.5 | Gemini-S/T-ReCS |
| NGC 7592 | 2010 Aug 30 | 15.5 | Gemini-S/T-ReCS |
| IRAS 085723915 (1) | 2008 Jan 24 | 32 | Subaru/COMICS |
| NGC 1614 | 2008 Jan 24 | 16 | Subaru/COMICS |
| NGC 2623 | 2008 Jan 24 | 40 | Subaru/COMICS |
| IRAS 085723915 (2) | 2009 Apr 7 | 32 | Subaru/COMICS |
| IRAS 152503609 | 2009 Apr 7 | 60 | Subaru/COMICS |
| Arp 193 | 2009 Apr 7 | 56 | Subaru/COMICS |
Note. — Col.(1): Object name. The observed sources are sorted based on the telescope used and observing date. Sources above and below the horizontal solid line were observed with Gemini-South and Subaru, respectively. Superantennae and IRAS 08572+3915 were observed twice. Col.(2): Observing date in UT. Col.(3): Net on-source integration time in minutes. Col.(4): Telescope and instrument.
| Object | Redshift | Type | Date | Filter | Integration |
|---|---|---|---|---|---|
| Time [min] | |||||
| (1) | (2) | (3) | (4) | (5) | (6) |
| I Zw 1 (PG 0050124) | 0.061 | Sy1 a | 2006 Oct 4 | N11.7 | 26.7 |
| Mrk 1014 (PG 0157001) | 0.164 | Sy1 a,b | 2006 Oct 4 | N11.7 | 26.7 |
| PG 0844349 | 0.064 | Sy1 a | 2006 Oct 4 | N11.7 | 53.3 |
| PG 2130099 | 0.061 | Sy1 a | 2006 Oct 4 | N11.7 | 13.3 |
| PG 2214139 | 0.067 | Sy1 a | 2006 Oct 4 | N11.7 | 33.3 |
| Mrk 266 (NGC 5256) | 0.028 | Sy2 (N) + HII (S) b | 2009 Apr 7 | N8.8 | 13 |
Note. — Col.(1): Object name. Col.(2): Redshift. Col.(3): Optical spectral classification. a: Schmidt & Green (1983). b: Veilleux et al. (1999). For the LIRG Mrk 266, “N” and “S” denote the northern and southern nuclei, respectively. Col.(4): Observing date in UT. Col.(5): Filter used for the -band observation. (8.4–9.2 m) or (11.2–12.1 m). Col.(6): Net on-source integration time in minutes.
| Object | PID | Date | Integration time [sec] | |||
|---|---|---|---|---|---|---|
| [UT] | SL2 | SL1 | LL2 | LL1 | ||
| (1) | (2) | (3) | (4) | (5) | (6) | (7) |
| IRAS 152503609 | 105 | 2004 Mar 4 | 84 | 84 | 120 | 120 |
| IRAS 205514250 | 105 | 2004 May 14 | 56 | 56 | 56 | 56 |
| NGC 1377 | 159 | 2005 Feb 18 | 252 aaIRS spectral mapping mode was employed. | 252 aaIRS spectral mapping mode was employed. | 600 aaIRS spectral mapping mode was employed. | 600 aaIRS spectral mapping mode was employed. |
| VV 114 E | 21 | 2004 Jun 28 | 210 bbIRS spectral mapping mode was employed. Total exposure time covering the E-nucleus was extracted. | 210 bbIRS spectral mapping mode was employed. Total exposure time covering the E-nucleus was extracted. | 180 bbIRS spectral mapping mode was employed. Total exposure time covering the E-nucleus was extracted. | 180 bbIRS spectral mapping mode was employed. Total exposure time covering the E-nucleus was extracted. |
Note. — Col.(1): Object name. Col.(2): PID number: 105 (PI = J. Houck), 159 (PI = R. Kennicutt), and 21 (PI = J. Houck). Col.(3): Observing date in UT. Col.(4)–(7): Net on-source integration time for SL2, SL1, LL2, and LL1 spectroscopy, respectively, in seconds.
| Object | Flux (This work) | Flux (Spitzer IRS) | Standard star | Std flux |
|---|---|---|---|---|
| (mJy) | (Jy) | |||
| (1) | (2) | (3) | (4) | (5) |
| Superantennae (1) | 595 | 600 | HR 7383 | 2.4 |
| IRAS 205514250 | 485 | 470 | HR 7869 | 6.1 |
| IRAS 010042237 | 330 | 270 | HR 400 | 2.9 |
| IRAS 041032838 | 290 | 250 | HR 1231 | 34.6 |
| VV 114 E-1 | 245 | 1000 (45261 aaMeasurement at 17.9 m by Soifer et al. (2001) for VV 114 E.) | HR 334 | 6.1 |
| VV 114 E-2 | 390 | 1000 (45261 aaMeasurement at 17.9 m by Soifer et al. (2001) for VV 114 E.) | HR 334 | 6.1 |
| NGC 1377 | 590 | 500 | HR 1231 | 34.6 |
| Superantennae (2) | 640 | 600 | HR 7383 | 2.4 |
| IRAS 000910738 | 50 | 50 | HR 117 | 2.6 |
| IRAS 001880856 | 85 | 70 | HR 117 | 2.6 |
| IRAS 012980744 | 55 | 45 | HR 334 | 6.1 |
| ESO 602G025 | 155 | HR 8015 | 2.0 | |
| NGC 5253 | 5400 | 6000 (5500539 bbMeasurement at 17.4 m (5500539 mJy; Moorwood & Glass 1982). A small 18.7 m flux measurement (2900 mJy) by Gorjian et al. (2001) was commented by Vanzi & Sauvage (2004).) | HR 5287 | 7.3 |
| NGC 7592 W ccBoth the western (W) and eastern (E) nuclei were observed simultaneously, but the E nucleus was too faint to allow meaningful discussion. | 210 | HR 8841 | 2.6 | |
| NGC 4945 A (1.8” 1.8”) | 200 | 1500 | HR 4906 | 4.8 |
| NGC 4945 (3.6” 8.9”) | 1000 | 1500 | HR 4906 | 4.8 |
| IRAS 085723915 (1) | 420 | 490 (55246 ddMeasurement by Soifer et al.(2000) at 17.7 m, using IRAS flux for a standard star.) | HR 3275 | 8.7 |
| NGC 1614 | 2970 | 2000 | HR 1231 | 36.8 |
| NGC 2623 | 260 | 300 | HR 3275 | 8.7 |
| IRAS 085723915 (2) | 390 | 490 (55246 ddMeasurement by Soifer et al.(2000) at 17.7 m, using IRAS flux for a standard star.) | HR 3705 | 25.1 |
| IRAS 152503609 | 210 | 300 | HR 5763 | 4.7 |
| Arp 193 | 275 | HR 5219 | 13.4 |
Note. — Col.(1): Object name. The horizontal solid line separates sources observed with Gemini-South (above the line) and Subaru (below the line). Superantennae and IRAS 08572+3915 were observed twice, and two flux measurements are shown separately. Col.(2): Flux measurement in this work in mJy. Col.(3): Spitzer IRS flux at 18 m. References are Roussel et al. (2006), Brandl et al. (2006), Beirao et al. (2006), Imanishi et al. (2007a), Wu et al. (2009), and this paper (Figure 3). Col.(4): Standard star used for flux calibration. Col.(5): Adopted standard star flux at the observed wavelength in Jy.
| Object | PSF standard | Size | Physical size | Surface brightness | |
|---|---|---|---|---|---|
| (arcsec) | (pc) | (L⊙ kpc-2) | |||
| (1) | (2) | (3) | (4) | (5) | (6) |
| Superantennae (1) | HR 7383 | 0.14 | 160 | 1.01013 | |
| IRAS 205514250 | HR 7869 | 0.15 | 120 | 0.721013 1.61013 | 0.7 |
| IRAS 010042237 | HR 400 | 0.13 | 255 | 0.891013 | |
| IRAS 041032838 | HR 1231 | 0.09 | 165 | 1.81013 | |
| VV 114 E-1 | HR 334 | 0.19 | 70 | 0.201013 | |
| VV 114 E-2 | HR 334 | 0.78 | 295 | 0.021013 | |
| NGC 1377 | HR 1231 | 0.14 | 16 | 0.921013 2.51013 | 0.85 |
| Superantennae (2) | HR 7383 | 0.19 | 210 | 0.671013 | |
| IRAS 000910736 | HR 117 | 0.18 | 350 | 0.071013 0.241013 | 1.05 |
| IRAS 001880856 | HR 117 | 0.10 | 215 | 0.391013 0.751013 | 0.55 |
| IRAS 012980744 | HR 334 | 0.18 | 400 | 0.081013 0.301013 | 1.1 |
| ESO 602G025 | HR 8015 | 0.4 | 185 | 0.031013 | |
| NGC 5253 | HR 5287 | 0.32 | 6.3 | 1.51013 | |
| NGC 7592 W | HR 8841 | 0.19 | 85 | 0.201013 | |
| IRAS 085723915 (1) | HR 3275 | 0.12 aaSoifer et al. (2000) constrained to be 022. | 125 | 1.11013 3.31013 | 0.9 |
| NGC 1614 | HR 1231 | 1.9 | 580 | 0.021013 | |
| NGC 2623 | HR 3275 | 0.34 | 115 | 0.071013 | |
| IRAS 085723915 (2) | HR 3705 | 0.18 aaSoifer et al. (2000) constrained to be 022. | 190 | 0.451013 1.31013 | 0.9 |
| IRAS 152503609 | HR 5763 | 0.05 | 50 | 3.41013 7.01013 | 0.6 |
| Arp 193 | HR 5219 | 1.0 | 420 | 0.0091013 |
Note. — Col.(1): Object name. The horizontal solid line separates sources observed with Gemini-South (above the line) and Subaru (below the line). Col.(2): PSF standard star. Col.(3): Spatial extent of LIRG 18 m emission in apparent size in arcsec. Col.(4): Spatial extent of LIRG 18 m emission in physical size in pc. Col.(5): Emission surface brightness in L⊙ kpc-2 estimated from the 18 m flux (luminosity) and measured size for the 18 m emission regions. Values after correction for the 18 m flux-attenuation are also shown for LIRGs that display clearly detectable 18 m silicate dust absorption features. No estimate is attempted for NGC 4945 because of its complex morphology. Col.(6): Optical depth of the 18 m silicate dust absorption feature for detected sources, estimated based on our method (Imanishi et al. 2007a; 4.2 of this paper).
| Object | Flux (This work) | Standard | Std flux | Size | Physical size | Surface brightness |
|---|---|---|---|---|---|---|
| (mJy) | star | (Jy) | (arcsec) | (pc) | (L⊙ kpc-2) | |
| (1) | (2) | (3) | (4) | (5) | (6) | (7) |
| I Zw1 | 380 | HR 106 | 4.35 | 0.21 | 220 | 0.521013 2.61013 |
| Mrk 1014 | 80 | HR 500 | 5.15 | 0.14 | 360 | 0.331013 1.61013 |
| PG 0844349 | 50 | HR 3275 | 20.3 | 0.10 | 110 | 0.291013 1.41013 |
| PG 2130099 | 135 | HR 8287 | 3.90 | 0.28 | 300 | 0.101013 0.51013 |
| PG 2214139 | 75 | HR 8287 | 3.90 | 0.17 | 190 | 0.161013 0.81013 |
| Mrk 266 N | 92 | HR 5219 | 46.54 | 0.56 | 300 | 0.021013 0.11013 |
| Mrk 266 S | 20 | HR 5219 | 46.54 |
Note. — Col.(1): Object name. Col.(2): Flux measurement at 10 m ( or ) in mJy. Col.(3): Standard star used for flux and PSF calibration. Col.(4): Adopted standard star flux at the observed wavelength in Jy. Col.(5): Spatial extent at 10 m in apparent size in arcsec. Col.(6): Spatial extent at 10 m in physical size in pc. Col.(7): Emission surface brightness in L⊙ kpc-2 estimated from the observed 11.7 m (or 8.8 m) flux (luminosity) and the physical size of emission regions. Values after correction for the infrared-unprobed emission (= fraction of energetic radiation unabsorbed by dust) are also added for sources classified optically as Seyferts (5.1.4). Mrk 266 S is barely detected at 10 m, but is too faint to estimate the spatial extent and emission surface brightness in a reliable manner.
![[Uncaptioned image]](/html/1102.4854/assets/x1.png)
![[Uncaptioned image]](/html/1102.4854/assets/x2.png)
![[Uncaptioned image]](/html/1102.4854/assets/x3.png)
![[Uncaptioned image]](/html/1102.4854/assets/x4.png)
![[Uncaptioned image]](/html/1102.4854/assets/x5.png)
![[Uncaptioned image]](/html/1102.4854/assets/x6.png)
![[Uncaptioned image]](/html/1102.4854/assets/x7.png)
![[Uncaptioned image]](/html/1102.4854/assets/x8.png)
![[Uncaptioned image]](/html/1102.4854/assets/x9.png)
![[Uncaptioned image]](/html/1102.4854/assets/x10.png)
![[Uncaptioned image]](/html/1102.4854/assets/x11.png)
![[Uncaptioned image]](/html/1102.4854/assets/x12.png)
![[Uncaptioned image]](/html/1102.4854/assets/x13.png)
![[Uncaptioned image]](/html/1102.4854/assets/x14.png)
![[Uncaptioned image]](/html/1102.4854/assets/x15.png)
![[Uncaptioned image]](/html/1102.4854/assets/x16.png)