Comparative study of the phonons in non-superconducting BaC6 and superconducting CaC6 using inelastic x-ray scattering
Abstract
The low energy phonons of two different graphite intercalation compounds (GICs) have been measured as a function of temperature using inelastic x-ray scattering (IXS). In the case of the non-superconductor BaC6, the phonons observed are significantly higher (up to 20%) in energy than those predicted by theory, in contrast to the reasonable agreement found in superconducting CaC6. Additional IXS intensity is observed below 15 meV in both BaC6 and CaC6. It has been previously suggested that this additional inelastic intensity may arise from defect or vacancy modes not predicted by theory (d’Astuto et al, Phys. Rev. B 81 104519 (2010)). Here it is shown that this additional intensity can arise directly from the polycrystalline nature of the available samples. Our results show that future theoretical work is required to understand the relationship between the crystal structure, the phonons and the superconductivity in GICs.
pacs:
71.20.Tx,63.20.kd,74.25.Kc,63.20.kg,78.70.CkI Introduction
Since the discovery of superconductivity in YbC6 ( K) and CaC6 ( K) at temperatures over an order of magnitude higher than previously found in graphite intercalation compounds (GICs) T. E. Weller, M. Ellerby, S. S. Saxena, R. P. Smith and N. T. Skipper (2005); N. Emery, C. Hérold, M. d’Astuto, V. Garcia, Ch. Bellin, J. F. Marê ché, P. Lagrange, and G. Loupias (2005), the properties of this family of GICs have been extensively studied by a variety of different experimental techniques R. Cubitt, J. S. White, M. Laver, M. R. Eskildsen, C. D. Dewhurst, D. McK. Paul, A. J. Crichton, M. Ellerby, C. Howard, Z. Kurban, and F. Norris (2007); A. Gauzzi, N. Bendiab, M. d’Astuto, B. Canny, M. Calandra, F. Mauri, G. Loupias, N. Emery, C. Hérold, P. Lagrange, M. Hanfland and M. Mezouar (2008); J. S. Kim, L. Boeri, J. R. O’Brien, F. S. Razavi, and R. K. Kremer (2007); D. G. Hinks, D. Rosenmann, H. Claus, M.S. Bailey and J. D. Jorgenson (2007); R. S. Gonnelli, D. Daghero, D. Delaude, M. Tortello, G. A. Ummarino, V. A. Stepanov, J. S. Kim, R. K. Kremer, A. Sanna, G. Profeta, and S. Massidda (2008); T. Valla, J. Camacho, Z-H. Pan, A. V. Fedorov, A. C. Walters, C. A. Howard and M. Ellerby (2009). Although initially an exotic superconducting mechanism was proposed involving acoustic plasmons G. Csányi, P. B. Littlewood, A. H. Nevidomskyy, C. J. Pickard and B. D. Simons (2005), subsequent density functional theory (DFT) studies described the superconductivity via a more orthodox electron-phonon (e-ph) coupling mechanism with s-wave symmetry M. Calandra and F. Mauri (2005, 2006); A. Sanna, G. Profeta, A. Floris, A. Marini, E. K. U. Gross and S. Massidda (2007); M. Calandra, G. Profeta, F. Mauri (2010). These DFT descriptions predict that the e-ph coupling is approximately equal for phonons associated with vibration of the carbon atoms and for phonons associated with movement of the intercalant calcium.
At present there are experimental studies in the literature which give conflicting viewpoints concerning the nature of the e-ph coupling in GICs. A large Ca isotope effect ((Ca) 0.5) has been measured in CaC6 D. G. Hinks, D. Rosenmann, H. Claus, M.S. Bailey and J. D. Jorgenson (2007), which, if viewed within the BCS description of superconductivity, suggests that only the phonons due to the vibration of calcium are involved in the electron pairing. In contrast, angle-resolved photoemission spectroscopy (ARPES) measurements on CaC6 T. Valla, J. Camacho, Z-H. Pan, A. V. Fedorov, A. C. Walters, C. A. Howard and M. Ellerby (2009) have found that the e-ph coupling to graphite-like high-energy phonons is so strong that it can explain the superconducting transition temperature alone, without any additional coupling to calcium phonons. These discrepancies point to the need for a detailed study of the phonons in GICs, to both test the DFT description and to look for direct evidence for e-ph coupling involving specific phonons. Moreover, phonon studies in graphitic systems in general are important as the electron-phonon interactions in these systems are under much scrutiny Pisana et al. (2007); Lazzeri and Mauri (2006); M. P. M. Dean, C. A. Howard, S. S. Saxena and M. Ellerby (2010).
Superconductivity in GICs is directly linked to the graphite layer separation, with the superconducting transition temperature increasing as the graphite layer separation is reduced. This trend is supported both by the observed values of in a variety of GICs J. S. Kim, L. Boeri, J. R. O’Brien, F. S. Razavi, and R. K. Kremer (2007) and by measurements of as a function of pressure in CaC6 A. Gauzzi, S. Takashima, N. Takeshita, C. Terakura, H. Takagi, N. Emery, C. Hérold, P. Lagrange and G. Loupias (2007) and YbC6 R. P. Smith, A. Kusmartseva, Y. T. C. Ko, S. S. Saxena, A. Akrap, L. Forr , M. Laad, T. E. Weller, M. Ellerby, and N. T. Skipper (2006). Indeed in BaC6 the graphite layer separation is so large that superconductivity appears to be suppressed entirely, with no superconducting transition observed down to 0.080 K S. Nakamae, A. Gauzzi, F. Ladieu, D. L’Hôte, N. Eméry, C. Hérold, J.F. Marêché, P. Lagrange, G. Loupias (2008). It is therefore instructive to study the superconductivity in GICs by studying GICs with different intercalants, since by changing the intercalant one changes and therefore tunes .
In this paper we present the low energy phonon dispersions in non-superconducting BaC6 and superconducting CaC6 as measured using inelastic x-ray scattering (IXS). These data represent the first momentum-resolved phonon measurements on BaC6. We find a substantial discrepancy between experiment and theory in the phonon energies of BaC6, in contrast to the good agreement in the case of CaC6. Like many other layered materials, GICs are difficult to synthesise as high-quality single crystals. We demonstrate here that the details of the preferred orientation (texture) of the crystallites in these GIC samples can lead to the observation of phonons which, because of their polarization, are theoretically forbidden to be observed. Our work highlights the importance of accounting for these effects in phonon studies of textured polycrystalline samples and calls for the need for single crystal GIC samples to address the role of the electron-phonon coupling in these materials.
The low energy phonons in CaC6 have been measured previously M. H. Upton, A. C. Walters, C. A. Howard, K. C. Rahnejat, M. Ellerby, J. P. Hill, D. F. McMorrow, A. Alatas, B. M. Leu and W. Ku (2007) and found to be in good overall agreement with the published DFT calculations. Subsequent to this work two momentum-resolved phonon studies have been made on CaC6, an inelastic neutron scattering (INS) study, which concentrates primarily on the high energy graphite-like phonon modes M. P. M. Dean, A. C. Walters, C. A. Howard, T. E. Weller, M. Calandra, F. Mauri, M. Ellerby, S. S. Saxena, A. Ivanov and D. F. McMorrow (2010), and a study of the low energy phonons in CaC6 performed using both IXS and INS M. d’Astuto, M. Calandra, N. Bendiab, G. Loupias, F. Mauri, S. Zhou, J. Graf, A. Lanzara, N. Emery, C. Hérold, P. Lagrange, D. Petitgrand, M. Hoesch (2010). While in Ref. M. P. M. Dean, A. C. Walters, C. A. Howard, T. E. Weller, M. Calandra, F. Mauri, M. Ellerby, S. S. Saxena, A. Ivanov and D. F. McMorrow (2010) good agreement was found with the calculated DFT phonon dispersions by taking account of the polycrystalline nature of the sample, in Ref. M. d’Astuto, M. Calandra, N. Bendiab, G. Loupias, F. Mauri, S. Zhou, J. Graf, A. Lanzara, N. Emery, C. Hérold, P. Lagrange, D. Petitgrand, M. Hoesch (2010) it was suggested that an additional phonon mode exists in CaC6 of uncertain origin. Here we propose an alternative explanation: that the additional IXS intensity arises from the weak crystallographic texture in the polycrystalline GIC samples.
II Experimental methods
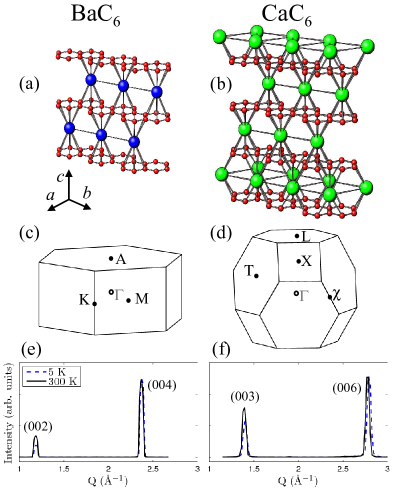
The GIC samples were made using ZYA grade highly orientated pyrolytic graphite (HOPG) platelets purchased from GE Advanced Ceramics. The BaC6 sample was made using the vapour transport method M. S. Dresselhaus and G. Dresselhaus (2002). An HOPG platelet was outgassed at 500∘C and then sealed into a quartz tube along with the barium metal (purity 99.99%) under high vacuum ( mbar). The tube was then heated to 490∘C and maintained at this temperature for 4 weeks. The CaC6 samples used were prepared by immersing a HOPG platelet in a Li-Ca alloy for 10 days, as described elsewhere S. Pruvost, C. Hérold, A. Hérold, and P. Lagrange (2004). CaC6 samples made from the same batch were found to have a sharp superconducting transition at 11.5 K from magnetic susceptibility measurements. The very high purity of the samples ( 99% pure in both cases) can be seen in the (00) diffraction shown in Figure 1 (e) and 1 (f), where there are no visible Bragg peaks from any impurities.
The starting graphite (HOPG) is composed of small crystallites ( 1 m) which have a strong preferred orientation (strong texture) perpendicular to the graphene planes (out-of-plane), giving a (00) mosaic with full-width half-maximum (FWHM) as low as 0.2∘. However within the graphene planes (in-plane), the crystallites are orientated randomly M. S. Dresselhaus and G. Dresselhaus (2002). After intercalation the crystallites are still oriented randomly in-plane, but out-of-plane the orientation of the crystallites is more random, with the GICs studied here having (00) mosaics of 5∘. This means that the texture is weaker in the GIC samples than in HOPG, since a weaker texture means that the samples are more like a perfect powders, which have zero texture.
CaC6 has the structure , which can be described using a rhombohedral or a hexagonal basis N. Emery, C. Hérold, M. d’Astuto, V. Garcia, Ch. Bellin, J. F. Marê ché, P. Lagrange, and G. Loupias (2005). The calcium atoms are arranged in three different ways in different intercalant layers (called AAA stacking, where the Roman letters define graphite layers and the Greek letters intercalant layers). The unit cell of CaC6 in the hexagonal basis is shown in Figure 1(b), and the shape of the first Brillouin zone is shown in Figure 1(d). Here we define the reciprocal lattice directions using the hexagonal basis, meaning that the out-of-plane direction is the (00) direction. This convention aids comparison with the BaC6 data, as BaC6 has the space group , which is normally described within the hexagonal basis. The stacking in BaC6 is AA, as shown in Figure 1(a). The first Brillouin zone of BaC6 is presented in Figure 1(c). The lattice parameters of CaC6 are Å and ÅN. Emery, C. Hérold, P. Lagrange (2005), giving a graphite layer separation of Å, and in BaC6 the lattice parameters are Å and Å with ÅD. Guerard, M.Chaabouni, P.Lagrange, M.El Makrini and A. Hérold (1980).
The IXS measurements were performed at 3-ID at the Advanced Photon Source, Argonne National Laboratory, with an incident x-ray energy of 21.657 keVT. S. Toellner, A. Alatas, A. Said, D. Shu, W. Sturhahn and J. Zhao (2006), providing an energy resolution between 2.2 and 2.4 meV, depending on the specific analyzer. The spectrometer has four analyzers, allowing energy scans to be done at different momentum transfers simultaneously. The momentum resolution in all cases was 0.072 Å-1 in the scattering plane and 0.183 Å-1 perpendicular to it. The phonon peaks were fitted with pseudo-Voigt functions, which were appropriately scaled by the Bose factor. The phonon dispersions were produced by plotting the peak positions as a function of the phonon wavevector , defined within the equation , where is the nearest reciprocal lattice vector and the momentum transfer.
In order to model the effect of the crystallographic texture in the GIC samples on the phonon spectra, simulations of the IXS data were produced by summing hundreds of simulated IXS intensities, each of which was performed at a specific momentum transfer. The crystallographic texture was described by performing simulations over a volume in reciprocal space expressed in spherical polar coordinates (,,), where has its rotation axis out-of-plane. For the 2D powder simulations, the momentum transfers were selected using Lorentzian sampling of with a FWHM of 5∘ and allowing to take any value. For the 3D powder simulations both and were allowed to take any value. The summed IXS spectra were then convolved with the momentum and energy resolution of the IXS spectrometer. This method was also used in our recent INS study of CaC6 M. P. M. Dean, A. C. Walters, C. A. Howard, T. E. Weller, M. Calandra, F. Mauri, M. Ellerby, S. S. Saxena, A. Ivanov and D. F. McMorrow (2010).
The two-dimensionality of these GICs, together with the significant difference in mass between the intercalant and carbon, means that the phonon modes can be separated, to a good approximation, into four groups: Ixy, Iz, Cxy and Cz, where Ixy describes phonon modes purely due to vibrations of intercalant atoms in-plane, Iz the intercalant phonons out-of-plane, and Cxy(z) the equivalent carbon in-plane (out-of-plane) phonons.
III Inelastic x-ray scattering measurements
III.1 Phonons in BaC6
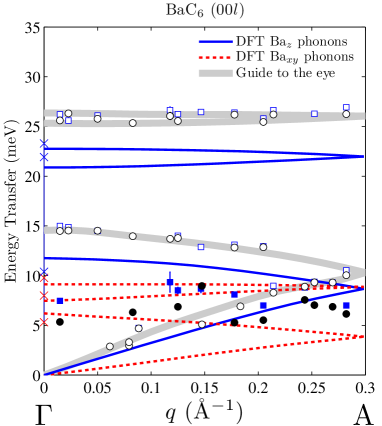
The (00) phonon dispersions of BaC6 measured at both 5 K and 300 K are plotted in Figure 2, together with calculated dispersions M. Calandra and F. Mauri (2006). The measured Baz phonon branches are significantly higher in energy than the theoretical values: near the edge of the Brillouin zone, at symmetry point A, the measured phonon energy for the optic Baz mode is almost larger than that predicted. In addition, in all of the measured IXS energy scans on BaC6 there is additional intensity observed below 10 meV, plotted with full symbols, which is not predicted by theory.
So what is the origin of this discrepancy between experiment and theory in BaC6? We consider a number of possibilities. The DFT calculations were performed using a different structure to the structure experimentally determined, which may have affected their results. In addition, the charge transfer from the Ba atoms to the graphene planes may be inaccurately predicted by theory. Finally, the calculations do not account for the polycrystallinity of the real samples, so part of the disagreement may be due to their crystallographic texture.
The published calculations for BaC6 use lattice parameters equivalent to Å and ÅM. Calandra and F. Mauri (2006) which are significantly different to the values found via x-ray diffraction ( Å and Å) D. Guerard, M.Chaabouni, P.Lagrange, M.El Makrini and A. Hérold (1980). In addition, the space group of CaC6 (3̄) is used for BaC6 in the calculation, rather than the experimentally found . To determine whether the observed discrepancy arises because of these structural differences, we performed an additional phonon calculation at the point using the experimental structure and lattice parameters, as shown in Figure 2 (crosses). This calculation gives phonon energies in approximate agreement with the previous calculation, showing that the calculations are largely insensitive to small changes in both the lattice parameters and the space group. Therefore the incorrect structure used in the initial calculations can be eliminated as a cause of the discrepancies.
Another possibility is that the charge transfer from the Ba atoms to the graphite has been underestimated theoretically. If there is less charge than predicted in the graphitic bands, then the bonds should be stronger than predicted, since filling the anti-bonding band destablizes the bonds. Stronger bonds lead directly to higher phonon energies. The effect of charge transfer on phonons in GICs has been predicted theoretically L. Boeri, G. B. Bachelet, M. Giantomassi and O. K. Andersen (2007) and observed using Raman scattering M. P. M. Dean, C. A. Howard, S. S. Saxena and M. Ellerby (2010). This would explain why the phonons are higher in energy than predicted, but cannot explain why additional intensity is observed below 10 meV.
The additional phonon intensity can be explained as a result of the crystallographic texture of the GIC samples. Here we argue that this signal arises from the excitation of Ixy phonons over a large volume in reciprocal space due to the weak crystallographic texture. For an ideal single crystal, and perfect instrumental resolution, the Ixy phonons are disallowed (their intensity is zero) when is completely out-of-plane due to the term in the IXS phonon cross-section, where is the eigenvector of the phonon with wavevector Burkel (2000). However in the case of the polycrystalline GIC samples studied, the weak crystallographic texture provides an explanation for the observation of the Ixy phonons. Even if the nominal momentum is entirely out-of-plane, the large reciprocal space volume integrated over in each measurement due to the weak preferred orientation of the crystallites will include many values of which have a significant component in-plane. This effect is discussed further in Section IV.
III.2 Phonons in CaC6
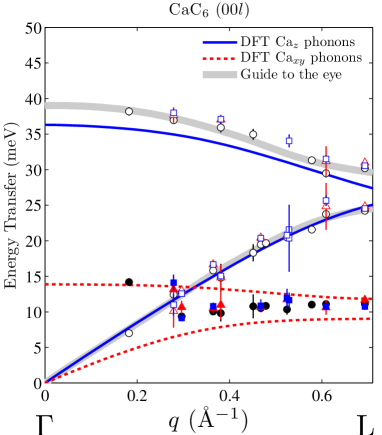
Figure 3 presents the (00) phonon dispersion in CaC6 at 5 K, 50 K and 300 K. A subset of the CaC6 data has already been published M. H. Upton, A. C. Walters, C. A. Howard, K. C. Rahnejat, M. Ellerby, J. P. Hill, D. F. McMorrow, A. Alatas, B. M. Leu and W. Ku (2007), but the scope of the data presented here is much more extensive. The additional phonon intensity below 15 meV again results from the large mosaic of the sample and is discussed at length in Section IV. The phonon dispersions calculated using DFT are plotted on the same figure M. Calandra and F. Mauri (2005). The two Caz modes are well described by the DFT calculations over the whole range sampled, especially in the case of the acoustic Caz mode. The higher energy mode which disperses between 30 and 40 meV (the optic Caz mode) is about 2 meV higher in energy than predicted, but the character of the dispersion is reasonably well described.
In both CaC6 and BaC6 the energies of the Iz modes are slightly hardened ( 1 meV) upon cooling from 300 K to 5 K, but there is no observable difference in CaC6 between the data measured above and below . The small temperature dependence most likely results from the reduction in the lattice parameter upon cooling, visible in the diffraction presented in Figure 1(e) and 1(f).
IV Modelling the crystallographic texture in BaC6 and CaC6
In Figures 4 and 5 a selection of phonon spectra measured at 300 K in the (00) direction in BaC6 and CaC6 are presented. In both cases two phonons are observed in the raw IXS data (the acoustic and optic Iz branches), as well as additional IXS intensity at low energies. In each of the panels two IXS simulations are plotted. The first simulation models the sample as a 2D powder: that is, the crystallites have no preferred orientation in-plane, but have a Lorentzian mosaic of FWHM = 5∘ out-of-plane, consistent with our x-ray diffraction. The second simulation models the sample with no preferred orientation (no texture): i.e. as a 3D powder. Both simulations are added to the experimental elastic intensity.
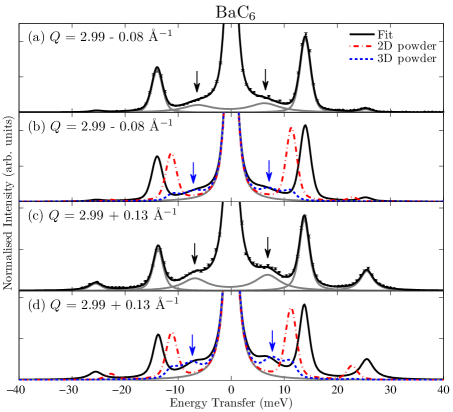
In the case of BaC6, plotted in Figure 4, the overall agreement is better with the 2D powder model than with the 3D powder model, especially in the ratio between the acoustic and optic Baz phonons. However in the 2D powder model the IXS intensity due to the Baxy phonons is much smaller than measured. The additional features predicted by the 3D powder model are similar to those observed, but there the intensities of the Baz phonons are underestimated. These observations suggest that perhaps the crystallographic texture of the BaC6 samples is weaker than expected from our x-ray diffraction, lying somewhere between the 2D and 3D powder models.
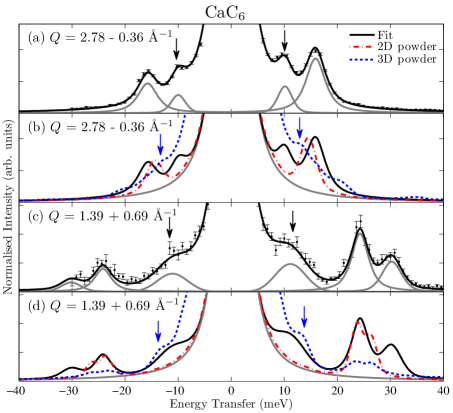
In the CaC6 data in Figure 5, the low energy IXS features look qualitatively similar to the Caxy features predicted by the 3D powder model. However the 3D powder description of CaC6 is once again not a satisfactory description, as the intensity of the Caz phonons is underestimated in most cases and the IXS intensity at low energies is significantly overestimated BaC . The measured CaC6 data appear to lie somewhere between the 2D and 3D powder simulations, similar to the BaC6 data, though the CaC6 appears to be more like the 3D powder than BaC6. This suggests that the distribution of intercalant atoms in CaC6 is rather random, which is consistent with the behavior of CaC6 under pressure as studied with x-ray diffraction, where the Ca atoms are found to be very mobile A. Gauzzi, N. Bendiab, M. d’Astuto, B. Canny, M. Calandra, F. Mauri, G. Loupias, N. Emery, C. Hérold, P. Lagrange, M. Hanfland and M. Mezouar (2008). More theoretical and experimental work is required in order to understand the complicated crystallographic texture of GICs, with more extensive x-ray diffraction being a natural starting point.
A recent IXS and INS study by d’Astuto et al. M. d’Astuto, M. Calandra, N. Bendiab, G. Loupias, F. Mauri, S. Zhou, J. Graf, A. Lanzara, N. Emery, C. Hérold, P. Lagrange, D. Petitgrand, M. Hoesch (2010) on CaC6 suggested that the additional inelastic intensity was due to an interaction with the acoustic Caz mode, causing an avoided crossing, or anti-crossing, which is seen as a splitting in the acoustic Caz mode. Their work was supplemented by INS data, which allowed them to more easily access momenta nearer to the point. The study concluded that the additional inelastic intensity could be due to a defect or vacancy mode. Although we cannot exclude this hypothesis, our simulations suggest that if the orientation of the crystallites in these samples is more random than previously thought, the weak crystallographic texture can account for the anomalous features without recourse to such a mode.
V Conclusions
To summarise, the dispersions of the low-energy phonons in BaC6 and CaC6 have been measured as a function of temperature using inelastic x-ray scattering. In BaC6 the experimental and DFT-calculated phonon dispersions M. Calandra and F. Mauri (2006) disagree, with measured phonon energies up to 20% higher than predicted. We suggest that this large discrepancy may result from an underestimation of the charge transfer from the Ba atoms to the graphite sheets in the theory. Our work motivates further study on BaC6 in order to examine the underlying reasons for this disagreement. In contrast, reasonable agreement with theory is found in CaC6 for the Caz phonons. This consistency between theory and experiment provides indirect supporting evidence for the DFT description M. Calandra and F. Mauri (2005) of the superconductivity in CaC6.
No signatures of electron-phonon coupling are observed in the phonon dispersions or the phonon widths in either non-superconducting BaC6 or superconducting CaC6, despite the drastically different superconducting transitions of these related compounds. In both BaC6 and CaC6 there is a small ( 1 meV) hardening of the Iz phonons as the temperature is decreased, but this is likely due to a reduction in the lattice parameter and is unaffected by the presence of superconductivity in CaC6 below 11.5 K. The largest source of phonon broadening experimentally is very likely the weak crystallographic texture inherent in the GIC samples.
Finally, the IXS simulations presented here show that weak crystallographic texture in polycrystalline GIC samples may lead to additional inelastic intensity from Ixy phonons. Such additional intensity has been observed recently in CaC6 M. H. Upton, A. C. Walters, C. A. Howard, K. C. Rahnejat, M. Ellerby, J. P. Hill, D. F. McMorrow, A. Alatas, B. M. Leu and W. Ku (2007); M. d’Astuto, M. Calandra, N. Bendiab, G. Loupias, F. Mauri, S. Zhou, J. Graf, A. Lanzara, N. Emery, C. Hérold, P. Lagrange, D. Petitgrand, M. Hoesch (2010) and YbC6 M. H. Upton, T. R. Forrest, A. C. Walters, C. A. Howard, M. Ellerby, A. H. Said, D. F. McMorrow (2010), but also in older INS studies on RbC24S. Funahashi, T. Kondow and M. Iizumi (1983) and KC24A. Magerl, H. Zabel, J. J. Rush (1983). This work provides a timely reminder that the crystallographic texture inherent in many graphitic systems may give rise to unexpected experimental effects.
Acknowledgements.
We would like to thank Matteo d’Astuto and Michael Krisch for illuminating discussions. A. C. W. would like to thank Ian Wood and Richard Thanki for their assistance and the EPSRC and STFC for funding. Calculations were performed at the IDRIS supercomputing center (project 081202). The work at Brookhaven is supported in part by the US DOE under contract No. DEAC02-98CH10886 and in part by the Center for Emergent Superconductivity, an Energy Frontier Research Center funded by the US DOE, Office of Basic Energy Sciences. The work at the Advanced Photon Source was supported by the US DOE, Office of Basic Energy Sciences, under contract No. DE-AC02-06CH11357.References
- T. E. Weller, M. Ellerby, S. S. Saxena, R. P. Smith and N. T. Skipper (2005) T. E. Weller, M. Ellerby, S. S. Saxena, R. P. Smith and N. T. Skipper, Nature Physics 1, 39 (2005).
- N. Emery, C. Hérold, M. d’Astuto, V. Garcia, Ch. Bellin, J. F. Marê ché, P. Lagrange, and G. Loupias (2005) N. Emery, C. Hérold, M. d’Astuto, V. Garcia, Ch. Bellin, J. F. Marê ché, P. Lagrange, and G. Loupias, Physical Review Letters 95, 087003 (2005).
- R. Cubitt, J. S. White, M. Laver, M. R. Eskildsen, C. D. Dewhurst, D. McK. Paul, A. J. Crichton, M. Ellerby, C. Howard, Z. Kurban, and F. Norris (2007) R. Cubitt, J. S. White, M. Laver, M. R. Eskildsen, C. D. Dewhurst, D. McK. Paul, A. J. Crichton, M. Ellerby, C. Howard, Z. Kurban, and F. Norris, Physical Review B 75, 140516(R) (2007).
- A. Gauzzi, N. Bendiab, M. d’Astuto, B. Canny, M. Calandra, F. Mauri, G. Loupias, N. Emery, C. Hérold, P. Lagrange, M. Hanfland and M. Mezouar (2008) A. Gauzzi, N. Bendiab, M. d’Astuto, B. Canny, M. Calandra, F. Mauri, G. Loupias, N. Emery, C. Hérold, P. Lagrange, M. Hanfland and M. Mezouar, Physical Review B 78, 064506 (2008).
- J. S. Kim, L. Boeri, J. R. O’Brien, F. S. Razavi, and R. K. Kremer (2007) J. S. Kim, L. Boeri, J. R. O’Brien, F. S. Razavi, and R. K. Kremer, Physical Review Letters 99, 027001 (2007).
- D. G. Hinks, D. Rosenmann, H. Claus, M.S. Bailey and J. D. Jorgenson (2007) D. G. Hinks, D. Rosenmann, H. Claus, M.S. Bailey and J. D. Jorgenson, Physical Review B 75, 014509 (2007).
- R. S. Gonnelli, D. Daghero, D. Delaude, M. Tortello, G. A. Ummarino, V. A. Stepanov, J. S. Kim, R. K. Kremer, A. Sanna, G. Profeta, and S. Massidda (2008) R. S. Gonnelli, D. Daghero, D. Delaude, M. Tortello, G. A. Ummarino, V. A. Stepanov, J. S. Kim, R. K. Kremer, A. Sanna, G. Profeta, and S. Massidda, Physical Review Letters 100, 207004 (2008).
- T. Valla, J. Camacho, Z-H. Pan, A. V. Fedorov, A. C. Walters, C. A. Howard and M. Ellerby (2009) T. Valla, J. Camacho, Z-H. Pan, A. V. Fedorov, A. C. Walters, C. A. Howard and M. Ellerby, Physical Review Letters 102, 107007 (2009).
- G. Csányi, P. B. Littlewood, A. H. Nevidomskyy, C. J. Pickard and B. D. Simons (2005) G. Csányi, P. B. Littlewood, A. H. Nevidomskyy, C. J. Pickard and B. D. Simons, Nature Physics 1, 42 (2005).
- M. Calandra and F. Mauri (2005) M. Calandra and F. Mauri, Physical Review Letters 95, 237002 (2005).
- M. Calandra and F. Mauri (2006) M. Calandra and F. Mauri, Physical Review B 74, 094507 (2006).
- A. Sanna, G. Profeta, A. Floris, A. Marini, E. K. U. Gross and S. Massidda (2007) A. Sanna, G. Profeta, A. Floris, A. Marini, E. K. U. Gross and S. Massidda, Physical Review B 75, 020511 (2007).
- M. Calandra, G. Profeta, F. Mauri (2010) M. Calandra, G. Profeta, F. Mauri, Physical Review B 82, 165111 (2010).
- Pisana et al. (2007) S. Pisana, M. Lazzeri, C. Casiraghi, K. S. Novoselov, A. K. Geim, A. C. Ferrari, and F. Mauri, Nature Materials 6, 198 (2007).
- Lazzeri and Mauri (2006) M. Lazzeri and F. Mauri, Physical Review Letters 97, 266407 (2006).
- M. P. M. Dean, C. A. Howard, S. S. Saxena and M. Ellerby (2010) M. P. M. Dean, C. A. Howard, S. S. Saxena and M. Ellerby, Physical Review B 81, 045405 (2010).
- A. Gauzzi, S. Takashima, N. Takeshita, C. Terakura, H. Takagi, N. Emery, C. Hérold, P. Lagrange and G. Loupias (2007) A. Gauzzi, S. Takashima, N. Takeshita, C. Terakura, H. Takagi, N. Emery, C. Hérold, P. Lagrange and G. Loupias, Physical Review Letters 98, 067002 (2007).
- R. P. Smith, A. Kusmartseva, Y. T. C. Ko, S. S. Saxena, A. Akrap, L. Forr , M. Laad, T. E. Weller, M. Ellerby, and N. T. Skipper (2006) R. P. Smith, A. Kusmartseva, Y. T. C. Ko, S. S. Saxena, A. Akrap, L. Forr , M. Laad, T. E. Weller, M. Ellerby, and N. T. Skipper, Physical Review B 74, 024505 (2006).
- S. Nakamae, A. Gauzzi, F. Ladieu, D. L’Hôte, N. Eméry, C. Hérold, J.F. Marêché, P. Lagrange, G. Loupias (2008) S. Nakamae, A. Gauzzi, F. Ladieu, D. L’Hôte, N. Eméry, C. Hérold, J.F. Marêché, P. Lagrange, G. Loupias, Solid State Communications 145, 493 (2008).
- M. H. Upton, A. C. Walters, C. A. Howard, K. C. Rahnejat, M. Ellerby, J. P. Hill, D. F. McMorrow, A. Alatas, B. M. Leu and W. Ku (2007) M. H. Upton, A. C. Walters, C. A. Howard, K. C. Rahnejat, M. Ellerby, J. P. Hill, D. F. McMorrow, A. Alatas, B. M. Leu and W. Ku, Physical Review B 76, 220501(R) (2007).
- M. P. M. Dean, A. C. Walters, C. A. Howard, T. E. Weller, M. Calandra, F. Mauri, M. Ellerby, S. S. Saxena, A. Ivanov and D. F. McMorrow (2010) M. P. M. Dean, A. C. Walters, C. A. Howard, T. E. Weller, M. Calandra, F. Mauri, M. Ellerby, S. S. Saxena, A. Ivanov and D. F. McMorrow, Physical Review B 82, 014533 (2010).
- M. d’Astuto, M. Calandra, N. Bendiab, G. Loupias, F. Mauri, S. Zhou, J. Graf, A. Lanzara, N. Emery, C. Hérold, P. Lagrange, D. Petitgrand, M. Hoesch (2010) M. d’Astuto, M. Calandra, N. Bendiab, G. Loupias, F. Mauri, S. Zhou, J. Graf, A. Lanzara, N. Emery, C. Hérold, P. Lagrange, D. Petitgrand, M. Hoesch, Physical Review B 81, 104519 (2010).
- M. S. Dresselhaus and G. Dresselhaus (2002) M. S. Dresselhaus and G. Dresselhaus, Advances in Physics 51, 1 (2002).
- S. Pruvost, C. Hérold, A. Hérold, and P. Lagrange (2004) S. Pruvost, C. Hérold, A. Hérold, and P. Lagrange, Carbon 42, 1825 (2004).
- N. Emery, C. Hérold, P. Lagrange (2005) N. Emery, C. Hérold, P. Lagrange, Journal of Solid State Chemistry 178, 2947 (2005).
- D. Guerard, M.Chaabouni, P.Lagrange, M.El Makrini and A. Hérold (1980) D. Guerard, M.Chaabouni, P.Lagrange, M.El Makrini and A. Hérold, Carbon 18, 257 (1980).
- T. S. Toellner, A. Alatas, A. Said, D. Shu, W. Sturhahn and J. Zhao (2006) T. S. Toellner, A. Alatas, A. Said, D. Shu, W. Sturhahn and J. Zhao, Journal of Synchrotron Radiation 13, 211 (2006).
- L. Boeri, G. B. Bachelet, M. Giantomassi and O. K. Andersen (2007) L. Boeri, G. B. Bachelet, M. Giantomassi and O. K. Andersen, Physical Review B 76, 064510 (2007).
- Burkel (2000) E. Burkel, Reports on Progress in Physics 63, 171 (2000).
- (30) The large IXS intensity at low energy transfer in the CaC6 ‘3D powder’ simulations arises from the low energy phonons predicted around the X point in the Brillouin zone (shown in Figure 1(d)), which are intense because the IXS cross-section is inversely proportional to energy transfer.
- M. H. Upton, T. R. Forrest, A. C. Walters, C. A. Howard, M. Ellerby, A. H. Said, D. F. McMorrow (2010) M. H. Upton, T. R. Forrest, A. C. Walters, C. A. Howard, M. Ellerby, A. H. Said, D. F. McMorrow, Physical Review B 82, 134515 (2010).
- S. Funahashi, T. Kondow and M. Iizumi (1983) S. Funahashi, T. Kondow and M. Iizumi, Physica B 120, 305 (1983).
- A. Magerl, H. Zabel, J. J. Rush (1983) A. Magerl, H. Zabel, J. J. Rush, Synthetic Metals 7, 339 (1983).