Spectral components in the bright, long GRB 061007: properties of the photosphere and the nature of the outflow
Abstract
We present a time-resolved spectral analysis of the bright, long GRB 061007 () using Swift BAT and Suzaku WAM data. We find that the prompt emission of GRB 061007 can be equally well explained by a photospheric component together with a power law as by a Band function, and we explore the implications of the former model. The photospheric component, which we model with a multicolour blackbody, dominates the emission and has a very stable shape throughout the burst. This component provides a natural explanation for the hardness-intensity correlation seen within the burst and also allows us to estimate the bulk Lorentz factor and the radius of the photosphere. The power-law component dominates the fit at high energies and has a nearly constant slope of . We discuss the possibility that this component is of the same origin as the high-energy power laws recently observed in some Fermi LAT bursts.
keywords:
gamma-rays: bursts – radiation mechanisms: general1 Introduction
The prompt emission of gamma-ray bursts (GRBs) is usually well modelled by a smoothly broken power law (Band et al. 1993), peaking in the 100–1000 keV energy range. The physical origin of this emission is still unclear, and the situation has recently become even more puzzling, with the Fermi satellite revealing that at least some bright bursts have additional power-law components extending well into the GeV energy range (Abdo et al. 2009; Ackermann et al. 2010; Granot et al. 2010). For a long time synchrotron emission has been considered the most promising candidate for explaining the Band component of the spectra. Although this model can explain many aspects of the emission, it also suffers from some significant problems. In particular, many bursts are observed to have harder low-energy spectra than predicted by standard synchrotron models (Crider et al. 1997; Preece et al. 1998; Ghirlanda et al. 2003).
An alternative model that is able to account for the hard low-energy spectra is photospheric emission (Mészáros & Rees 2000; Mészáros et al. 2002; Rees & Mészáros 2005; Pe’er et al. 2006). Such a model also has the advantage of providing a natural explanation for the observed correlations between the peak energy and luminosity within/between bursts (Golenetskii et al. 1983; Borgonovo & Ryde 2001; Yonetoku et al. 2004). Fits to observational data also support this picture, with blackbody models (often in combination with an additional non-thermal component) providing excellent descriptions of many bursts (Ghirlanda et al. 2003; Ryde 2004; Ryde & Pe’er 2009). However, in spite of its successes, it seems clear that single, narrow blackbody components do not significantly contribute to the prompt emission of most bursts (Ghirlanda et al. 2007; Bellm 2010).
This does not necessarily rule out a photospheric origin for the emission. In fact, there are many reasons to expect the photospheric emission to deviate from a simple Planck function, and several authors have recently considered models that give rise to photospheric emission with a broad, Band-like spectrum (Pe’er et al. 2006; Beloborodov 2010; Lazzati & Begelman 2010; Mizuta et al. 2010). A broadened photospheric component is also to be expected from the simple fact that the observed spectrum is most likely composed of emission arising from different regions in space. As a result, the angle dependence of the optical depth and the Doppler shift, as well as possible angle-dependent density and Lorentz-factor profiles, may all contribute to create the broadening (Pe’er et al. 2007; Pe’er & Ryde 2010).
Here we analyse the bright, long burst GRB 061007 with the aim of exploring models in which the emission is dominated by a photospheric component. The prompt emission of GRB 061007 was caught by both Swift and Suzaku (Ohno et al. 2009) as well as Konus-Wind (Golenetskii et al. 2006). With an isotropic energy release of erg in the 1-10 000 keV energy band (Ohno et al. 2009) this burst is among the most energetic GRBs ever observed, comparable to the brightest bursts detected by the Fermi LAT (e.g. Cenko et al. 2010). A very bright afterglow was observed by Swift and several ground-based telescopes (Mundell et al. 2007; Schady et al. 2007), and the redshift was measured to be (Osip et al. 2006, Jakobsson et al. 2006).
Due to its brightness and the wide energy band offered by the combined Swift and Suzaku observations, GRB 061007 is an ideal candidate for detailed time-resolved studies of the gamma-ray emission. The Suzaku and Swift data were previously analysed by Ohno et al. (2009), who carried out a time-resolved spectral analysis on a 1-s time-scale. Modelling the spectra with a Band function, the authors found that the time-resolved spectra follow the same relation as the time-averaged spectra of other bursts (Yonetoku et al. 2004), but also noted that the initial rising phases of the pulses may be outliers to this relation.
Here we find that that an alternative interpretation in terms of photospheric emission is possible, and explore the consequences of this in terms of the evolution of the fireball properties. In addition to a thermal component, our best-fitting spectral model also requires the presence of a power law. We discuss the properties of this component in view of recent Fermi results. This paper is organized as follows. We describe the observations in section 2 and present the time-resolved analysis in section 3. We then explore the properties of the relativistic outflow as derived from our spectral fits in section 4. A discussion and our conclusions are presented in section 5.
2 Observations and data reduction
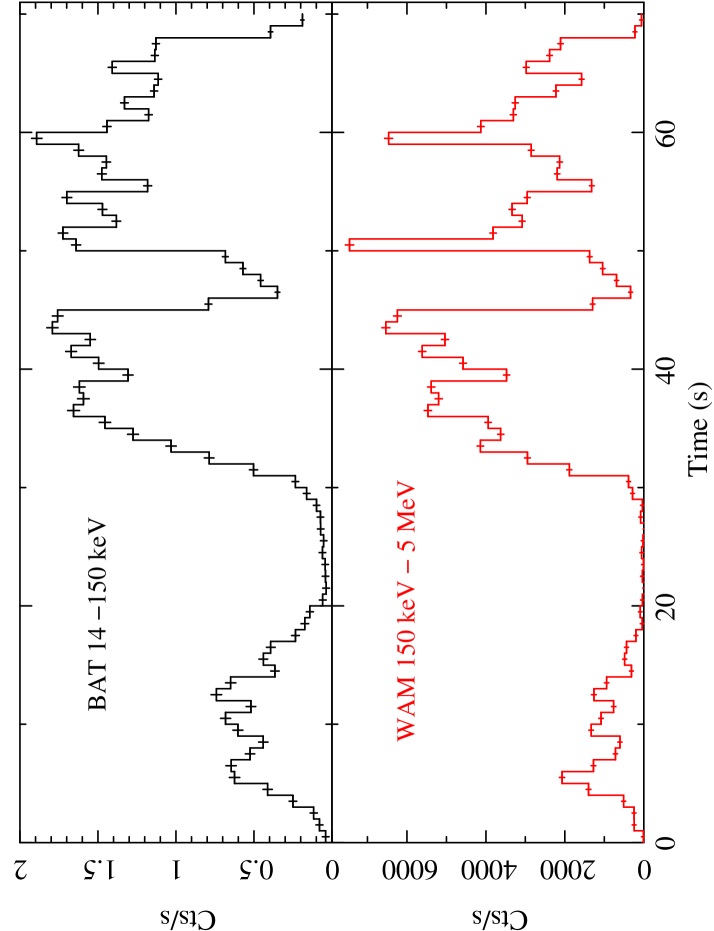
GRB 061007 was observed with the Suzaku WAM and the Swift BAT detectors. The duration was measured to be 59 s in the 50–5000 keV WAM energy range (Yamaoka et al. 2006) and 75 s in the 150–500 keV BAT energy range (Schady et al. 2007). The observations are described in detail in Ohno et al. (2009), and for this work we also follow the data reduction procedure described in that paper. For the WAM analysis we thus use the WAM-3 detector, in which the burst was most strongly detected. For both the WAM and the BAT we extract science products on a 1 s time-scale, as this corresponds to the temporal resolution of the transient class WAM data.
3 Time-resolved spectral analysis
Fig. 1 shows the WAM and BAT light curves of GRB 061007 on a 1 s time-scale. The light curve covers 70 seconds and three main pulses can clearly be identified in both energy bands. The time bins shown in the light curve are also used for the spectral analysis, excluding the first and last bins as well as the time between 19 and 28 seconds, due to the low count rates during these times. This leaves us with a total of 58 spectra with 1-s duration for the analysis.
The spectra were fitted over the 14–150 keV (BAT) and 150–5000 keV (WAM) energy ranges, with the cross-normalization between the two detectors left as a free parameter (as in Ohno et al. 2009). Fixing the cross-normalization at the value obtained from the time-averaged spectra only changes the results marginally, as discussed in section 3.4. All fits were performed using XSPEC12, assuming a standard cosmology with and . Errors on model parameters and error bars in plots represent the one sigma confidence level for one interesting parameter, unless otherwise stated.
3.1 Identification of a photospheric component
As a first step we investigate whether the spectra can be fitted with a model in which the peak of the emission is provided by a single Planck function. To account for any non-thermal emission we also include a second component in our models. We consider two forms for this component, a power law and cutoff power law. For the majority of the spectra the blackbody+power-law model does not provide an acceptable fit. Replacing the power law with a cutoff power law results in excellent fits, but we note that in this case the contribution from the blackbody is very small. This still holds if the energy of the blackbody is constrained in order to correspond to the peak of the spectra. We thus conclude that the prompt emission of this burst is not dominated by a single blackbody component.
As mentioned in section 1, another, more realistic, possibility is that the photospheric emission is broadened. We model this scenario with a multicolour blackbody, using the XSPEC model diskpbb. This model was developed to describe emission from an accretion disc, but the parameters can also be interpreted in the general case of multicolour blackbody emission. The free parameters of the model are the shape of the blackbody (described by the parameter ), the maximum blackbody temperature () and the normalization. More specifically, the parameter describes the temperature profile of an accretion disc giving rise to multicolour blackbody emission. Since this is irrelevant in the case of GRBs, we instead introduce the parameter , which relates to the fitted parameter as . Using we can express the relationship between the flux and the temperature of the single blackbody components (which together make up the multicolour blackbody) as
| (1) |
where is the flux of the Planck function at . As we approach the case of a single blackbody. We note that the same parameter is used to describe the multicolour-blackbody model in Ryde et al. (2010). We also use (1) to define the average temperature of the multicolour blackbody
| (2) |
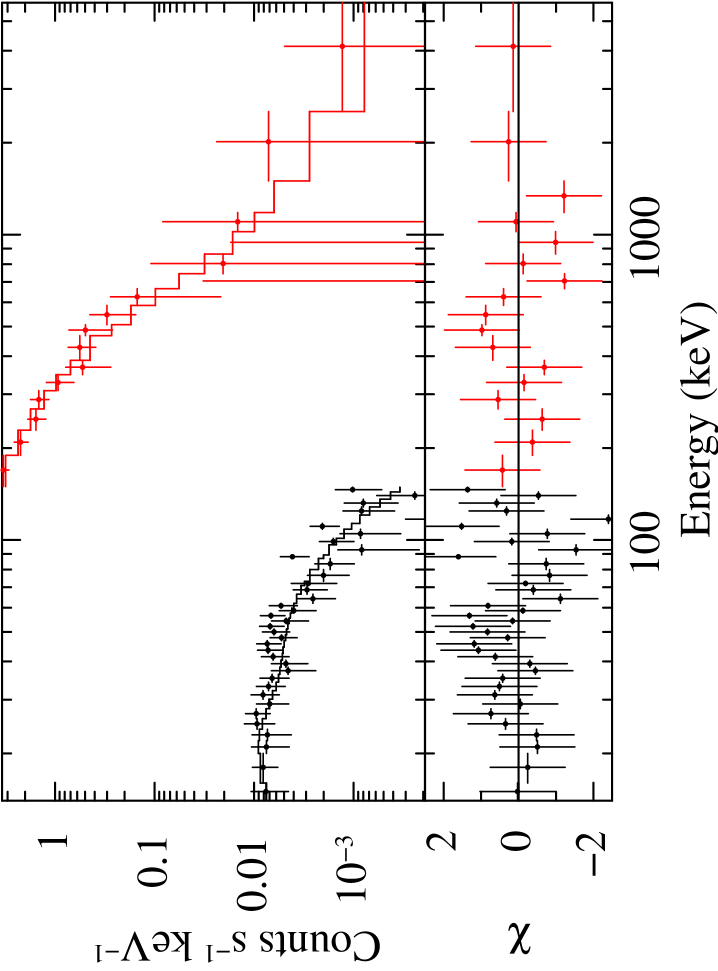
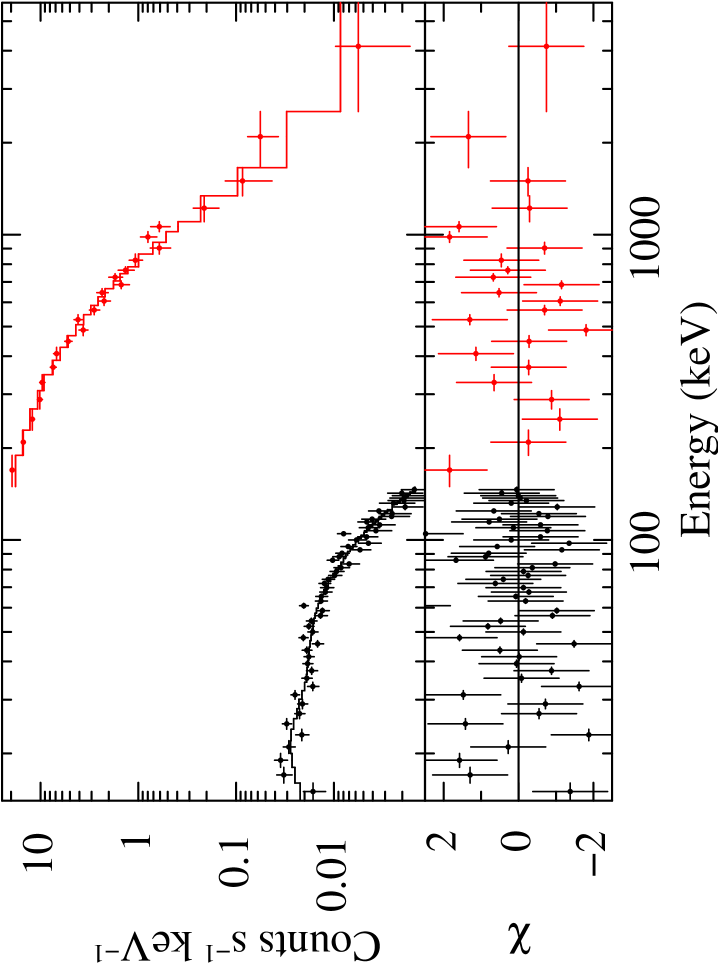
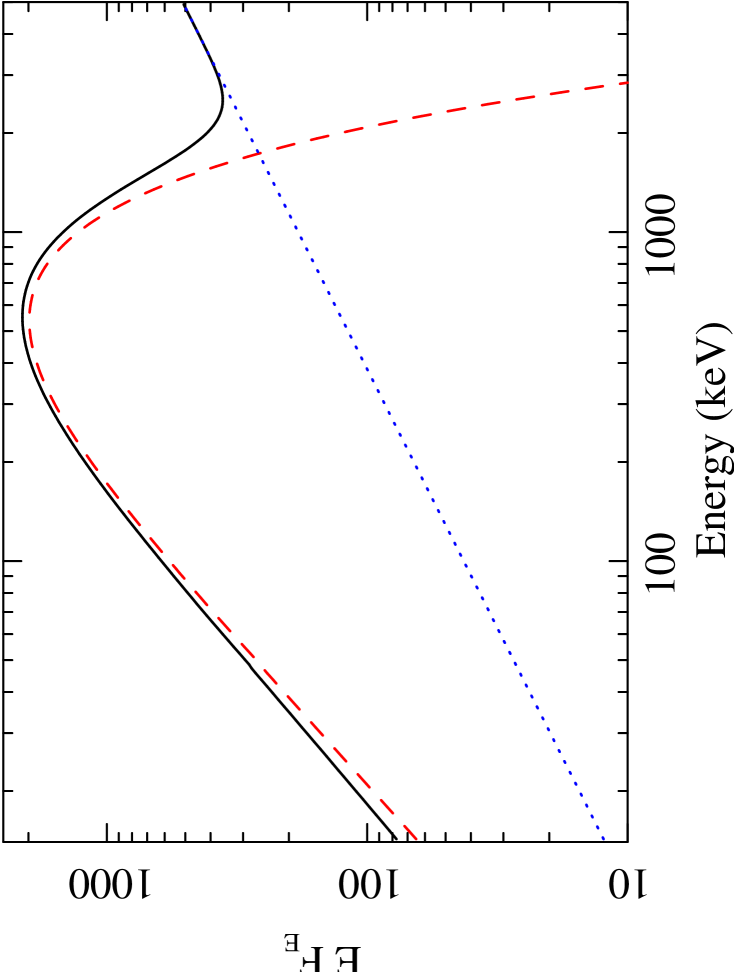
To allow for an additional non-thermal component we also include a power law in the model, , where is the normalization at 1 keV in photons and is the photon index. The resulting multicolour-blackbody + power-law (mBB+pl) model provides an excellent fit to all the spectra. Interestingly, we also find that the shape of the multicolour blackbody stays remarkably constant, (corresponding to ), based on the 47 spectra for which no problems occurred in the error calculations. We therefore re-fit the spectra with fixed at in order to obtain better constraints on the remaining model parameters. Fig. 2 shows the resulting values of compared to those obtained from fits to a Band model (both models have 80 degrees of freedom). Clearly it is not possible to distinguish between the two models on a statistical basis. The cross-normalization () between the WAM and the BAT is also similar for the two models ( for Band and for mBB+pl), showing that this parameter does not significantly affect the results (see also the discussion in section 3.4). Examples of fits to the mBB+pl model are shown in Fig. 3.

The evolution of with time is shown in the top left panel of Fig. 4. A comparison with the light curve in Fig. 1 reveals that correlates with the flux. We will explore this relation in more detail in section 3.3 below. In the lower left panel of the same figure we plot the dimensionless quantity , which is a measure of the effective size of the emitting region. This parameter is seen to increase during the rising phase of each pulse and then only vary mildly during the decaying phase. In particular, the variations in this parameter are much smaller than the variations of the light curve (Fig 1), supporting the interpretation that this burst is dominated by a photospheric component.
In Fig. 4 we also plot the ratio of the blackbody flux to the total flux and the power-law photon index. We see that the contribution from the blackbody component is fairly stable at around 75 per cent of the flux, although less well constrained during the first pulse. Due to the low flux of the power-law component in the fitted energy interval, the photon index could not be constrained in all the spectra. Considering only those 31 spectra for which it could be constrained, we find that a fit to a constant gives with .


3.2 Significance and properties of the power law
It is interesting to consider the power-law component of our model in view of recent Fermi observations, which have revealed additional power-law components at high energies in a number of bright GRBs (e.g. Abdo et al. 2009; Ackermann et al. 2010). We especially note that our photon index values are clustered around , which has also been observed in several Fermi bursts (Guiriec et al. 2010a) and which is indicative of synchrotron or inverse Compton emission, as discussed in Section 5. However, we have also noted that the contribution from the power law to the total model is small and that the photon index cannot be constrained in many of the time intervals, which prompts the question of whether the power law is required in the fits.
To test this we fit all spectra with a pure multicolour-blackbody model ( still fixed at 0.70) and use an F-test to compare these fits with the mBB+pl ones. The results are plotted in Fig. 5. We see that the significance of the power law is well above 90 per cent in the majority of the spectra, but that the significance is lower at low fluxes. As expected, the photon index is also poorly constrained in these low-flux intervals (cf. Fig. 4). In order to make sure that the high significance of the power law in most of the spectra is not due to the fact that was kept fixed, we also carry out the same test after fitting the spectra with a multicolour blackbody with as a free parameter. In this case the overall significance of the power law is somewhat weaker, but it is still required at very high significance in the majority of spectra after the initial, weak pulse.
Based on our spectral fits we also derive flux light curves for both the multicolour blackbody and the power-law component. The correlation between these light curves was investigated by calculating the discrete cross correlation function (DCCF) following Edelson & Krolik (1988). The resulting DCCF is shown in Fig 6. The relative lag and the correlation strength were computed by fitting a Gaussian profile to the correlation peak in the DCCF, and uncertainties in these parameters were estimated using a Monte Carlo method (see Peterson et al. 1998). The result of this analysis is a correlation strength of 0.44 +/-0.14 (corrected for the effect of measurement noise) and a lag which is consistent with zero, -0.8 +/-1.5 sec, where negative lag means that the power law leads the blackbody component.


3.3 Spectral evolution during individual pulses
Ohno et al. (2009) has already considered the evolution of this burst as derived from fits to a Band function. They found that the time-resolved spectra satisfy the relation defined by time-averaged bursts (Yonetoku et al. 2004), but that a number of points in the initial rising phases of the three pulses are outliers to this relation. Here we instead consider the spectral evolution in terms of the flux and temperature of the multicolour blackbody, which provides a natural explanation for the relation between peak energy and luminosity.
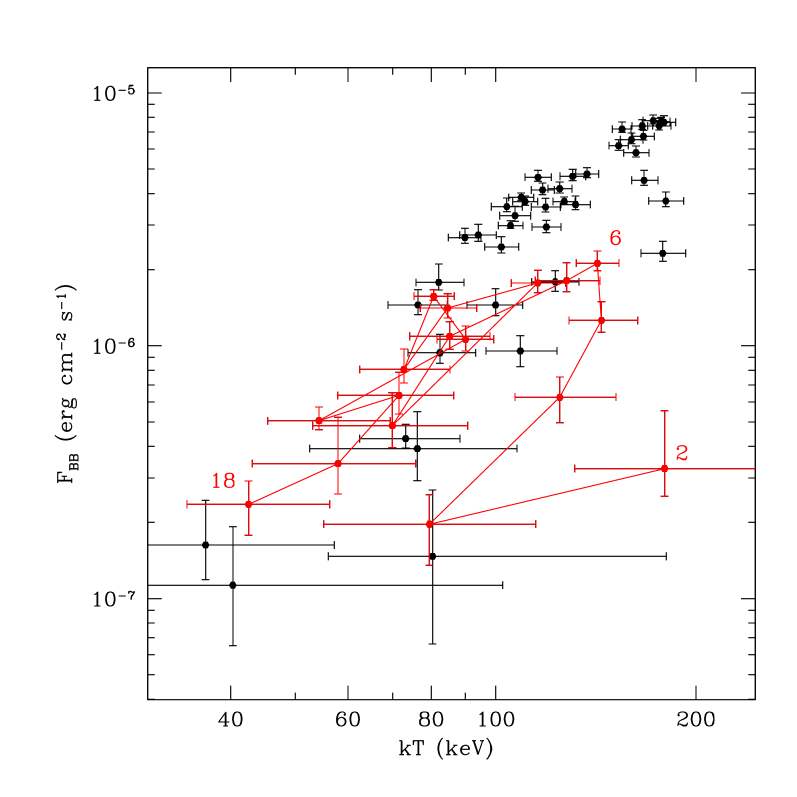
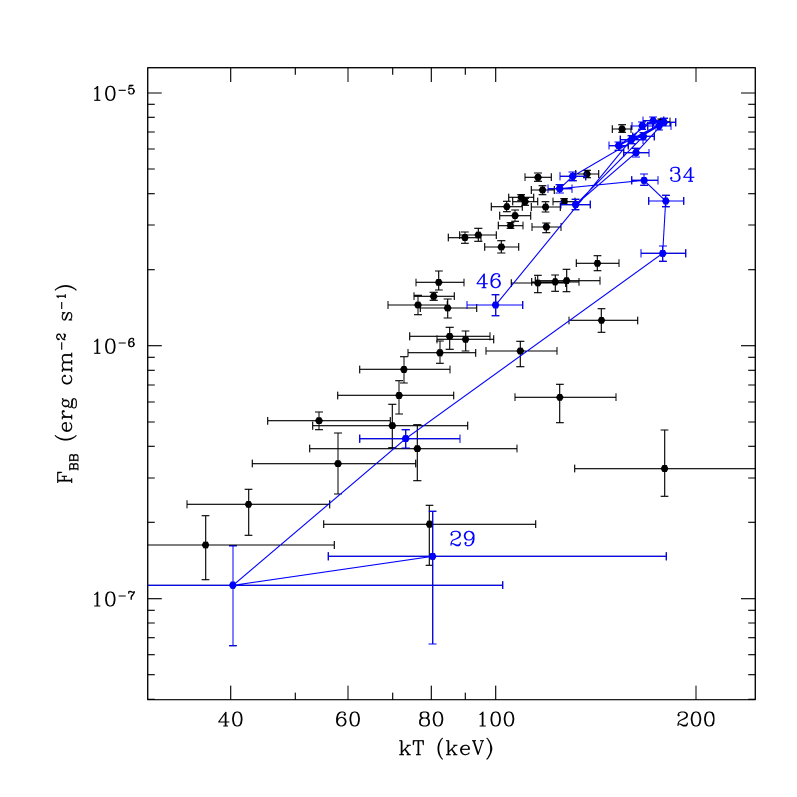
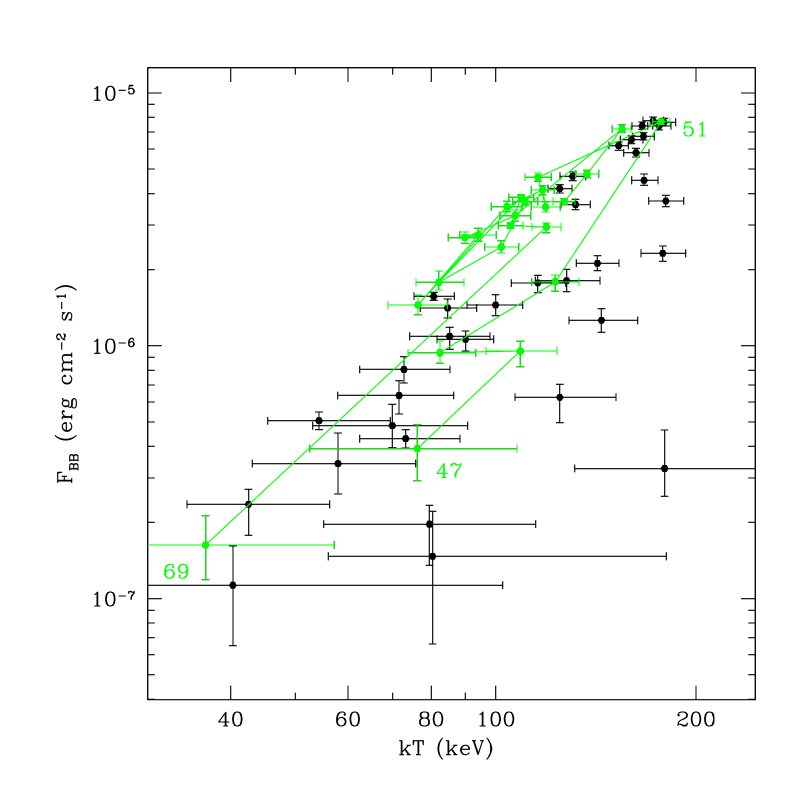
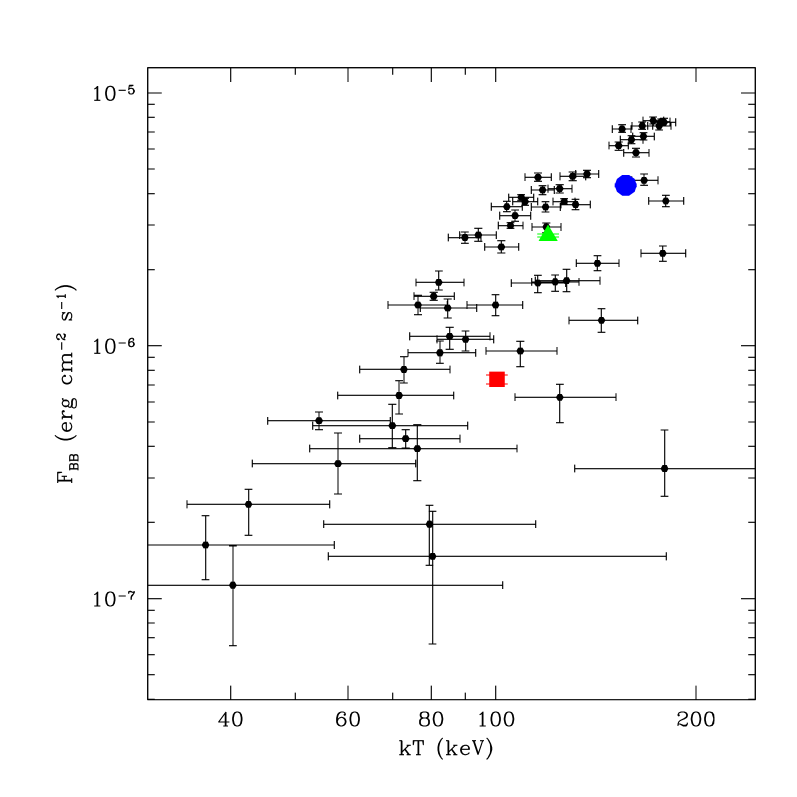

The temporal evolution of each pulse in the representation is shown in Fig. 7. The pulses exhibit a tracking behaviour, with the rising phase of each pulse moving along a lower track in the diagram. In addition, each pulse starts rising slightly higher up than the previous one. To quantify the temporal evolution within the pulses we fit straight lines to the logaritmized data in the rising and decaying phases of each pulse, using a fitting routine that accounts for the errors in both coordinates. We find that the correlation indices of the decaying phases are clustered around 2.2-2.3, which is typical for decaying phases of GRBs (e.g. Borgonovo & Ryde 2001, Lu et al. 2010). The rising phases have steeper indices (values around 3) but are poorly constrained due to the small number of data points.
As the three main pulses are clearly separated we can also carry out the experiment of treating them as individual bursts, and fit their time-averaged spectra with the mBB+pl model. The results of the three time-averaged fits fall within the range of results from the 1-s fits, as shown in Fig. 7. This is to be expected in the picture where the the various hardness-intensity correlations between the time-averaged spectra of different bursts are driven by the behaviour that is seen within individual bursts (see e.g Firmani et al. 2009).
3.4 Impact of the cross-normalization between the WAM and the BAT
In the time-resolved fits described above we have allowed the cross-normalization factor () between the WAM and the BAT to be a free parameter. was also left free in the previous analysis of this burst carried out by Ohno et al. (2009). Since the Suzaku satellite kept the same attitude during the burst the -values obtained from the time-resolved fits should in principle be consistent with the -value from a time-averaged fit. However, we find that fixing at the time-averaged value results in significantly worse in the intervals with high fluxes, regardless of the type of model being fitted. This is most likely due to systematic errors in the WAM detector, which increase with the brightness of the burst.
As an alternative to keeping free we therefore performed all the time-resolved fits with fixed at the time-averaged value, but with 3 per cent systematic errors added to the WAM energy channels. The quality of the resulting fits is very similar to the fits with free. The only systematic change in terms of best-fitting parameters is that is slightly higher, compared to for free, which translates into a slightly narrower multicolour blackbody.
4 Properties of the fireball


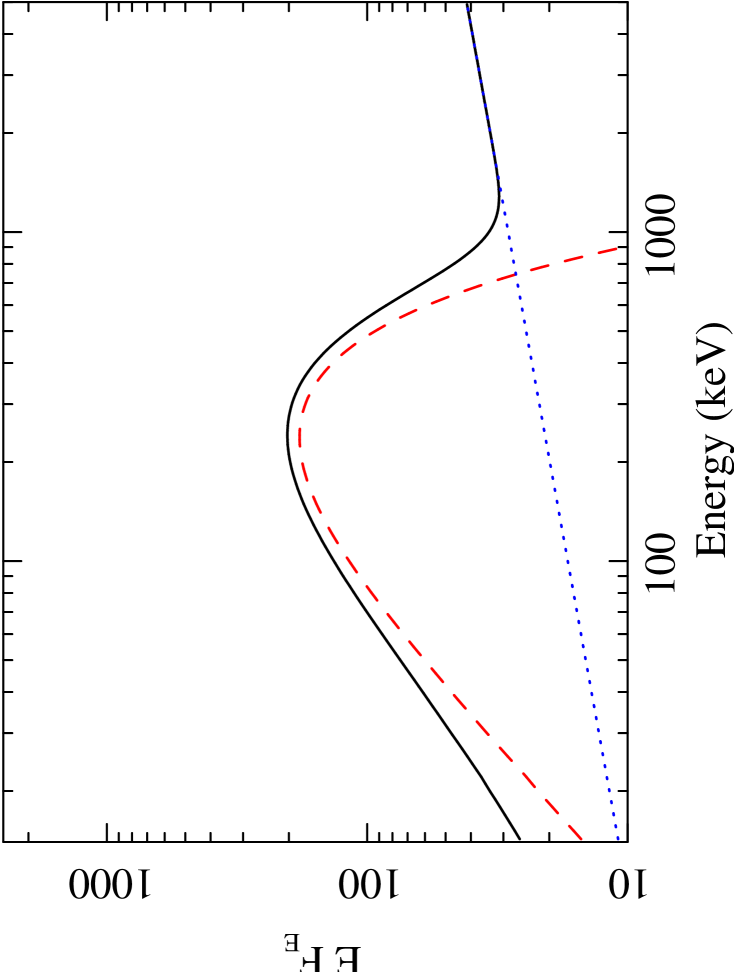
Having identified a photospheric component in the spectra, we can now use the measured temperature and flux of this component to determine the properties of the relativistic outflow. Assuming the non-dissipative fireball model described in Pe’er et al. (2007) we calculate the bulk Lorentz factor of the flow (), the radius of the photosphere (), the size at the base of the flow () and the saturation radius (). In order to determine all these parameters we must have , which we confirm following the procedure in Pe’er et al. (2007) (see also Fig. 8). Fig. 9 shows all the parameters of the outflow as a function of time.
is seen to vary between about 200 and , where is a geometrical factor of order unity and is the ratio between the total fireball energy and the energy emitted in gamma rays. The highest values of are seen during the second pulse. The other three parameters plotted in Fig. 9 (, and ) all show a trend of increasing during the rising phase of each pulse and then remaining nearly constant during the decaying phase. The average values of these parameters are , and . It should be noted that there is some uncertainty in the last two parameters as they depend on the assumed fireball dynamics during the acceleration phase (see Pe’er et al. 2007 for details).
There is also a systematic uncertainty in our estimates of all these parameters due to the fact that they all depend on the total gamma-ray flux. For the results presented in Fig. 9, we have simply used the flux in the observed BAT+WAM energy band, but the flux will of course be higher if the power-law component extends to high energies. The effect of a higher total gamma-ray flux would be higher values of and and lower values of and , with the change being significantly larger for the latter two parameters.
In order to estimate to what energy the power law is likely to extend we consider the value of . As this is the initial size of the fireball we would expect a value of about cm, i.e. the Schwarzschild radius of a solar-mass black hole. We therefore determine where the power laws from all our spectral fits would need to break in order to be consistent with this value. Assuming a break to a slope of we find that the majority of the spectra should have a break in the 10 MeV - 1 GeV band, while a sharp cutoff would give breaks in the 100 MeV - 100 GeV range. If we also use the inferred power-law breaks to calculate new values of the other parameters, we find that and are up to a factor of two higher than in Fig. 9, while is between 10 and 50 times smaller.
5 Discussion and conclusions
After the launch of Fermi it has become increasingly apparent that GRB spectra are composed of multiple components. While some spectra are still very well described by the canonical Band function, others require an additional power-law component extending to high energies and/or a photospheric component (e.g. Zhang et al. 2010). The power law has been detected with high significance in a handful of bursts (Abdo et al. 2009; Ackermann et al. 2010; Guiriec et al. 2010a; Ackermann et al. 2011) but there is marginal evidence in many more (Granot et al. 2010). A photospheric component is clearly seen in both GRB 090902B (together with a power-law component, Ryde et al. 2010) and GRB 100724B (together with a Band function, Guiriec et al. 2010b). In the case of GRB 090902B the photospheric component is best modelled by a multicolour blackbody. Given this evidence it is natural to ask whether such composite models can explain the prompt spectra observed with other satellites than Fermi . We have found that this is indeed the case for the Swift + Suzaku data of GRB 061007, which can be equally well fitted by a multicolour blackbody together with a power law as by a Band function. Below we discuss the properties and possible origin of the photospheric and power-law components.
5.1 The photospheric component
We find that the multicolour blackbody dominates the prompt emission of GRB 061007, providing about 75 per cent of the total flux throughout the burst. Since the luminosity and temperature of a blackbody are related this model also provides a natural explanation for the hardness-intensity correlation within the burst. This is a major advantage compared to models where the bulk of the emission is interpreted as synchrotron emission, where these correlations are much harder to explain (e.g. Ramirez-Ruiz & Lloyd-Ronning 2002).
Another interesting result from our fits is that the shape of the multicolour blackbody is consistent with staying constant throughout the burst. The same shape is also found when fitting the time-averaged spectra of the three main pulses. This result disfavours a scenario where the broadening is primarily due to rapid temperature fluctuations, as this should give rise to a narrowing of the multicolour blackbody when shorter time intervals are considered (as in GRB 090902B, Ryde et al. 2010; Zhang et al. 2010).
Several other mechanisms that may create broadened photospheric spectra have recently been discussed in the literature. These include sub-photospheric heating due to collisions between neutrons and protons (Beloborodov 2010) or shocks or magnetic dissipation (Lazzati & Begelman 2010). These models result in high-energy slopes that match those of typical Band spectra, but fail to explain the observed range of low-energy slopes. In order to explain the low-energy part of the multicolour blackbody in GRB 061007 (which can be approximated by a power law with photon index ) a different explanation is clearly needed. The most important effects that could contribute to a softer low-energy slope can be summarized as follows:
-
1.
The observed temperature depends on the Doppler boost, which in turn depends on the angle to the line-of-sight (, where is the outflow temperature measured in the comoving frame). Integrating the emitting surface over angle will therefore produce a multicolour blackbody spectrum. Pe’er & Ryde (2010) have shown that for late times, high latitude effects produce a spectrum with .
-
2.
The assumption that all photons originate from is not always a good approximation (Pe’er 2008). Depending on how the comoving outflow-density scales with radius, the probability density function for a photon to make its last scattering at radius does not have to be sharply peaked around . If the local outflow temperature or Lorentz factor varies on distance scales similar to the width of the probability-density profile, an integration over radius is necessary to obtain the observed spectrum.
-
3.
The outflow properties around the photosphere are expected to vary on a time-scale shorter than the most highly time-resolved spectra (Rees & Mészáros 2005). Thus, observed spectra are likely the result of an integration over time, which can produce a soft low-energy slope for reasonable temporal scalings of the emitting surface and the temperature (Blinnikov et al. 1999). As discussed above, observations indicate that this is not an important effect for GRB 061007.
While all of these effects have the potential of softening the low-energy slope from purely thermal emission, simulations are needed in order to determine their relative importance. Indeed, recent simulations by Mizuta et al. (2010) show thermal emission from a GRB jet with , much softer than a blackbody spectrum with .
5.2 Properties of the outflow
Having identified a photospheric component in the spectrum we were also able to derive the properties of the outflow, including the Lorentz factor, the radius of the photosphere (), the initial radius of the outflow () and the saturation radius (). As already discussed, the latter two parameters depend on the assumption of non-dissipative fireball dynamics. We find that varies between about 200 and , while the three radii remain relatively stable with average values of , and . We especially note that the values of the photospheric and saturation radii are rather similar (see also Fig. 8). Since the radiative efficiency of the thermal component scales as (Mészáros & Rees 2000) this implies a high efficiency, as expected given that the photospheric component dominates the prompt emission.
As discussed in section 4, the main uncertainty in these numbers is that we do not know how far the power law extends above the WAM energy band. In particular, if the power law extends to GeV energies the values quoted above for and should be about two times higher, while the the values for and will be smaller. In addition, all the above parameters have a weak dependence on the value of , which is the ratio of the energy emitted in gamma rays to the total energy emitted by the burst. The value of can be measured through detailed afterglow observations and is usually found to be less than 2-3 (e.g. Cenko et al. 2010). In the case of GRB 061007 it is hard to put a firm limit on as there is no jet break seen in the afterglow, but the preferred model of Schady et al. (2007) gives a value of around 10. As in the case of a power law extending to high energies, this value would increase our estimates of for and and decrease the values for and .
5.3 The non-thermal component
The power-law component in our model dominates at low and high energies and is consistent with having the same slope () during the entire burst. Even though our energy range only extends up to 5 MeV it is interesting to compare this component with the high-energy power laws recently observed in some Fermi bursts. In particular, we note that a power law slope of has been observed in several cases (Guiriec et al. 2010a) and that the isotropic energy release of GRB 061007 is similar to the bright Fermi bursts in which this component has been observed. We also note that the power-law components that are required in addition to photospheric components in BATSE GRBs have a preferred value close to (Ryde et al. 2006).
There have been many suggestions for the origin of the extra component, including external shocks (Ghisellini et al. 2010; Kumar & Barniol Duran 2010), hadronic processes (Asano et al. 2009; Razzaque 2010), Compton upscattering of a photospheric component (Toma et al. 2010) as well as a combination of different emission mechanisms (Pe’er et al. 2010). If the peak of the prompt emission is identified with a photospheric component it is also possible that the additional component is due to synchrotron emission arising in the region above the photosphere. The power-law slope of supports this picture, as this is the slope expected for fast-cooling synchrotron emission. However, in this case the power law break must be above the Suzaku energy range, which implies an unreasonably large -field (for a synchrotron peak at 1 GeV and the magnetic field is , where is the minimum Lorentz factor of the electrons).
Another option is that the power law is the inverse-Compton component of low-energy synchrotron emission. In this picture the synchrotron peak must be below the BAT energy range while the inverse Compton peak is above the WAM energy band. Such a large separation between the two peaks implies a very large efficiency for the electrons, which in turn rules out the standard internal-shock scenario.
In order to evaluate models for the power-law component it is clearly crucial to determine their breaks, something which is now becoming possible with the Fermi satellite. So far, there is one clear confirmation of a break in the case of GRB 090926A (Ackermann et al. 2011). For GRB 061007 we expect a break of the power law in the LAT energy range (see section 4), which should encourage the search for breaks in similarly bright bursts in the future.
Acknowledgments
The authors thank Asaf Pe’er for useful comments on the manuscript. JL acknowledges financial support from the Swedish Research Council (VR) through the Oskar Klein Centre. FR acknowledges with thanks the Swedish National Space Board for financial support. This research was partially supported by a Grant-in-Aid for Scientific Research No. 19047001 (KY) of the Ministry of Education, Culture, Sports, Science and Technology (MEXT).
References
- Abdo et al. (2009) Abdo A. A., et al., 2009, ApJL , 706, L138
- Ackermann et al. (2011) Ackermann M., et al., 2011, preprint (astro-ph/1101.2082)
- Ackermann et al. (2010) Ackermann M., et al., 2010, ApJ , 716, 1178
- Asano et al. (2009) Asano K., Guiriec S., Mészáros P., 2009, ApJL , 705, L191
- Band et al. (1993) Band D., et al., 1993, ApJ , 413, 281
- Bellm (2010) Bellm E. C., 2010, ApJ , 714, 881
- Beloborodov (2010) Beloborodov A. M., 2010, MNRAS , 407, 1033
- Blinnikov et al. (1999) Blinnikov S. I., Kozyreva A. V., Panchenko I. E., 1999, Astronomy Reports, 43, 739
- Borgonovo & Ryde (2001) Borgonovo L., Ryde F., 2001, ApJ , 548, 770
- Cenko et al. (2010) Cenko S. B., et al., 2010, preprint (astro-ph/1004.2900)
- Crider et al. (1997) Crider A., et al., 1997, ApJL , 479, L39+
- Edelson & Krolik (1988) Edelson R. A., Krolik J. H., 1988, ApJ , 333, 646
- Firmani et al. (2009) Firmani C., Cabrera J. I., Avila-Reese V., Ghisellini G., Ghirlanda G., Nava L., Bosnjak Z., 2009, MNRAS , 393, 1209
- Ghirlanda et al. (2007) Ghirlanda G., Bosnjak Z., Ghisellini G., Tavecchio F., Firmani C., 2007, MNRAS , 379, 73
- Ghirlanda et al. (2003) Ghirlanda G., Celotti A., Ghisellini G., 2003, A&A , 406, 879
- Ghisellini et al. (2010) Ghisellini G., Ghirlanda G., Nava L., Celotti A., 2010, MNRAS , 403, 926
- Golenetskii et al. (2006) Golenetskii S., Aptekar R., Mazets E., Pal’Shin V., Frederiks D., Cline T., 2006, GRB Coordinates Network, 5722, 1
- Golenetskii et al. (1983) Golenetskii S. V., Mazets E. P., Aptekar R. L., Ilinskii V. N., 1983, Nature , 306, 451
- Granot et al. (2010) Granot J., for the Fermi LAT Collaboration, the GBM Collaboration, 2010, preprint (astro-ph/1003.2452)
- Guiriec et al. (2010a) Guiriec S., et al., 2010, ApJ , 725, 225
- Guiriec et al. (2010b) Guiriec S., et al., 2010, ApJ , 727, L33
- Jakobsson et al. (2006) Jakobsson P., Fynbo J. P. U., Tanvir N., Rol E., 2006, GRB Coordinates Network, 5716, 1
- Kumar & Barniol Duran (2010) Kumar P., Barniol Duran R., 2010, MNRAS , 1243
- Lazzati & Begelman (2010) Lazzati D., Begelman M. C., 2010, ApJ , 725, 1137
- Lu et al. (2010) Lu R., Hou S., Liang E., 2010, ApJ , 720, 1146
- Mészáros et al. (2002) Mészáros P., Ramirez-Ruiz E., Rees M. J., Zhang B., 2002, ApJ , 578, 812
- Mészáros & Rees (2000) Mészáros P., Rees M. J., 2000, ApJ , 530, 292
- Mizuta et al. (2010) Mizuta A., Nagataki S., Aoi J., 2010, preprint (astro-ph/1006.2440)
- Mundell et al. (2007) Mundell C. G., et al., 2007, ApJ , 660, 489
- Ohno et al. (2009) Ohno M., Ioka K., Yamaoka K., Tashiro M., Fukazawa Y., Nakagawa Y. E., 2009, PASJ , 61, 201
- Osip et al. (2006) Osip D., Chen H., Prochaska J. X., 2006, GRB Coordinates Network, 5715, 1
- Pe’er (2008) Pe’er A., 2008, ApJ , 682, 463
- Pe’er et al. (2006) Pe’er A., Mészáros P., Rees M. J., 2006, ApJ , 642, 995
- Pe’er & Ryde (2010) Pe’er A., Ryde F., 2010, preprint (astro-ph/1008.4590)
- Pe’er et al. (2007) Pe’er A., Ryde F., Wijers R. A. M. J., Mészáros P., Rees M. J., 2007, ApJL , 664, L1
- Pe’er et al. (2010) Pe’er A., Zhang B., Ryde F., McGlynn S., Zhang B., Preece R. D., Kouveliotou C., 2010, preprint (astro-ph/1007.2228)
- Peterson et al. (1998) Peterson B. M., Wanders I., Horne K., Collier S., Alexander T., Kaspi S., Maoz D., 1998, PASP , 110, 660
- Preece et al. (1998) Preece R. D., Briggs M. S., Mallozzi R. S., Pendleton G. N., Paciesas W. S., Band D. L., 1998, ApJL , 506, L23
- Ramirez-Ruiz & Lloyd-Ronning (2002) Ramirez-Ruiz E., Lloyd-Ronning N. M., 2002, NewA , 7, 197
- Razzaque (2010) Razzaque S., 2010, ApJL , 724, L109
- Rees & Mészáros (2005) Rees M. J., Mészáros P., 2005, ApJ , 628, 847
- Ryde (2004) Ryde F., 2004, ApJ , 614, 827
- Ryde et al. (2010) Ryde F., 2010, ApJL , 709, L172
- Ryde et al. (2006) Ryde F., Björnsson C., Kaneko Y., Mészáros P., Preece R., Battelino M., 2006, ApJ , 652, 1400
- Ryde & Pe’er (2009) Ryde F., Pe’er A., 2009, ApJ , 702, 1211
- Schady et al. (2007) Schady P., et al., 2007, MNRAS , 380, 1041
- Toma et al. (2010) Toma K., Wu X., Meszaros P., 2010, ArXiv e-prints
- Yamaoka et al. (2006) Yamaoka K., et al., 2006, GRB Coordinates Network, 5724, 1
- Yonetoku et al. (2004) Yonetoku D., Murakami T., Nakamura T., Yamazaki R., Inoue A. K., Ioka K., 2004, ApJ , 609, 935
- Zhang et al. (2010) Zhang B., et al., 2010, preprint (astro-ph/1009.3338)