Glassy dynamics of electrons near the metal-insulator transition
This review first describes the evidence that strongly suggests the existence of the metal-insulator transition (MIT) in a two-dimensional electron system in Si regardless of the amount of disorder. Extensive studies of the charge dynamics demonstrate that this transition is closely related to the glassy freezing of electrons as temperature . Similarities to the behavior of three-dimensional materials raise the intriguing possibility that such correlated dynamics might be a universal feature of the MIT regardless of the dimensionality.
1 Introduction
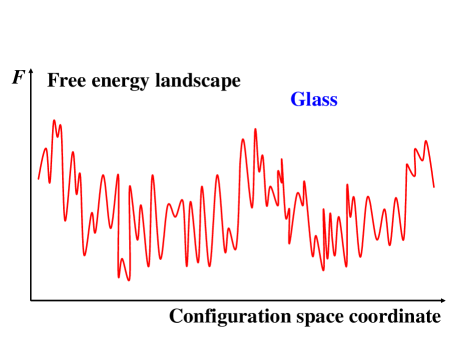
The discovery of many novel materials over the last couple of decades has revived interest in the metal-insulator transition (MIT), one of the longstanding, fundamental problems of condensed matter physics. Many such materials, including manganites, diluted magnetic semiconductors and high-temperature superconductors, are created by doping an insulating host and thus find themselves close to a conductor-insulator transition. There is substantial evidence that, in many cases, strong electronic correlations (Mott localization) and disorder (Anderson localization) both play an important role in this regime (see \shortciteNPMir-Dob-review for review). In general, the competition between the Coulomb repulsion, which favors a uniform distribution of electrons (Wigner crystallization), and disorder, which favors a random one, leads to the frustration in the system. This means that electrons are unable to satisfy these requirements simultaneously, resulting in the absence of a unique ground state and the emergence of a large number of metastable states or minima (“valleys”) in the free energy landscape. Metastable states, which correspond to different charge configurations, are separated by high barriers, leading to slow dynamics, divergence of the equilibration time, and breaking of ergodicity. Such a system is called a Coulomb glass. However, there are many other types of glassy systems. A common denominator in all of them is their complex or “rugged” energy landscape (Fig. 1). The most extensively studied and best known glasses in condensed matter physics are probably conventional spin glasses \shortciteBinder, such as Cu:Mn. On the other hand, Coulomb glasses were first anticipated theoretically almost three decades ago \shortciteeglass1,eglass2,eglass3,eglass4,eglass5 in situations where electrons are strongly localized due to disorder, but experimental studies have been scarce. Some of the recent work on electron glasses in such strongly localized regime, away from the MIT, has been reviewed by \shortciteNArielAmir-review. In the opposite limit of well-delocalized electrons, one expects a single, well-defined ground state and the absence of glassiness. Not surprisingly, it is the behavior in the intermediate region, near the MIT, that has been most difficult to understand.
In the presence of disorder, the local electron density undergoes strong spatial fluctuations. Therefore, it is plausible to expect that, in the vicinity of the MIT, the local density in some areas may be higher than the average and correspond to the metallic state, whereas in the remaining regions, the local density may be lower than the average and the electrons are localized. In fact, it has been proposed that, in weakly doped Mott insulators near the MIT, the system will settle for a nanoscale phase separation111Global phase separation is not possible as it would violate charge neutrality. between a conductor and an insulator \shortcitephasesep1,phasesep2,phasesep3. New powerful experimental techniques, including imaging by scanning tunneling microscopy \shortciteSTM-Seamus, have indeed firmly established the existence of charge inhomogeneities in strongly correlated electron systems, such as cuprates \shortciteMillis,Elbio. This obviously leads to the possibility for a myriad of competing charge configurations and the emergence of the associated glassy dynamics. Recent studies \shortciteIR_SPIE07,IR_PRL,Glenton,IR-inplane of a lightly doped, insulating La2-xSrxCuO4, , have found several clear signatures of glassy charge dynamics as temperature , consistent with an underlying glassy ground state that results from Coulomb interactions. Further work is needed, however, to see how this glassy state evolves as the system approaches the transition from an insulator to a conductor.
It is also desirable to extend studies of charge dynamics to other types of materials to explore a possible generality of glassy freezing in strongly correlated systems near the MIT \shortciteDarko-glass,Pankov-scr,Mir-Dob-review. Many materials do exhibit complex behavior due to the existence of several competing ground states \shortciteElbio. In fact, the frustration caused by the competition of interactions on different length scales may give rise to glassy dynamics even in the absence of disorder \shortciteSchmalian, while even a small amount of disorder may favor glassiness over various static charge-ordered states \shortcitePankov-scr. Even though the emergence of glassiness thus appears to be ubiquitous at low temperatures, Coulomb glasses and out-of-equilibrium systems in general remain poorly understood. Experimentally, studies of charge dynamics near the MIT in many materials are often complicated by the accompanying changes in magnetic or structural symmetry, as well as by the glassy freezing of spins. Doped semiconductors, such as Si:P and Si:B, are free from such complications. They have been used extensively to study the critical behavior near the MIT \shortciteMir-Dob-review,Myriam_review but, in spite of some early hints of glassiness in the insulating regime \shortciteRosenbaum,Monroe1,Monroe2, charge dynamics was not studied further until recently \shortciteKar,Armitage, as discussed below.
Two-dimensional electron systems (2DES) in semiconductors \shortciteAFS, such as Si, provide another relatively simple system for exploring the interplay of electronic correlations and disorder (for a review of disordered electronic systems, see \shortciteNPLR). They have an additional advantage that all the relevant parameters, carrier concentration, disorder and interactions, can be varied relatively easily. This review will describe some of the work that has demonstrated that the 2DES in Si is an excellent model system not only for studying the MIT in two dimensions (2D), but also for investigating the nearly universal nonequilibrium behavior exhibited by a large class of both three-dimensional (3D) and 2D systems (e.g. spin glasses, supercooled liquids, granular films). In fact, the work on the 2DES in Si provides additional strong evidence that many such universal features are robust manifestations of glassiness, regardless of the dimensionality of the system.
The dimensionality plays an important role in the MIT. In 2D, for example, the very existence of the metal and the MIT had been questioned for many years. Recently, considerable experimental evidence has become available in favor of such a transition. Some of that work has been described in several review papers (e.g. \shortciteNPSergey-review) with a focus on very clean (low-disordered) samples. This review will first extend that discussion to the cases of higher disorder in order to (a) demonstrate that the 2D MIT is observed in all 2DES in Si regardless of the amount of disorder, (b) point out important similarities to the MIT in 3D systems, and (c) set the stage for the discussion of glassy dynamics near the MIT. As summarized below, the 2DES in Si exhibits all the main manifestations of glassiness: slow, correlated dynamics; nonexponential relaxations; diverging equilibration time, as ; aging and memory. The results provide strong support to theoretical proposals describing the 2D MIT as the melting of a Coulomb glass \shortciteDarko-glass,MIT-glassothers1,MIT-glassothers2,MIT-glassothers3,Vlad-MITglass1,Vlad-MITglass2. The review concludes by further comparison to other complex materials, both 2D and 3D, and by identifying some open directions for future research.
2 Metal-insulator transition in two dimensions
In 2D systems in semiconductor heterostructures, the electron density can be varied easily over two orders of magnitude simply by applying voltage to the so-called gate electrode. At low , the 2DES is strongly correlated: , where ( is the average Coulomb energy per electron and is the Fermi energy; see also \shortciteNPSergey-review for more details). At the same time, the electrons “feel” a random potential (disorder) caused by charged impurities that are located away from the 2DES. Some of the striking experimental evidence for the MIT that occurs in a variety of “clean”, i.e. low-disordered 2D systems has been presented also in the chapter by S. V. Kravchenko (this volume).
This section reviews work that demonstrates the existence of the 2D MIT regardless of the amount or type of disorder. The disorder, however, does affect the values of , the critical density for the MIT, and the precise form of the temperature dependence of conductivity . For the sake of clarity, it is important to recall that a qualitative distinction between a metal and an insulator exists only at : in the metal and in the insulator. The experiments were performed on a 2DES in Si metal-oxide-semiconductor field-effect transistors (MOSFETs), where the low density regime can be reached more easily compared to other semiconductors \shortciteSergey-review. In Si MOSFETs, the (Drude) mobility peaks as a function of because, at very high that are not of interest here, the scattering due to the roughness of the Si-SiO2 interface becomes increasingly important \shortciteAFS. The peak mobility at 4.2 K is commonly used as a rough measure of the amount of disorder.
2.1 Effects of disorder
2.1.1 High-mobility (low-disordered) samples
In high-mobility Si MOSFETs where, roughly speaking, the 4.2 K peak m2/(Vs), the low-temperature resistivity exhibits a strong, metallic drop () with decreasing for (Fig. 2) \shortciteSergey-review. changes sign at a density and becomes insulatinglike () for . Even though does not necessarily imply that diverges at zero temperature (i.e. that ), the density has been often assumed to represent the critical density for the MIT. However, other, more appropriate methods have been also used to identify . For example, was determined based on both a vanishing activation energy and a vanishing nonlinearity of current-voltage characteristics when extrapolated from the insulating phase \shortcitenc1,nc2. It was established that , although a small but systematic difference of a few percent has been reported such that \shortcitenc3,nc4. Fig. 2 inset illustrates the use of activation energies, determined from the fits of the data at the lowest and to the simply activated form222Close enough to , the data can be fitted almost equally well to the variable-range hopping law. This gives the same values of within the error of the fit. .
In the vicinity of (or ), the resistivity curves can be collapsed onto the same scaling function of a single parameter , i.e. \shortciteKrav-scal1. is the same function of on both the metallic and the insulating sides of the transition, ( – dynamical exponent, – correlation length exponent), \shortciteKrav-scal2. Here is the so-called “separatrix”, the temperature independent critical resistivity curve. On the metallic side, the scaling does not work at higher , in the regime where goes through a maximum and then decreases as is raised further \shortciteSergey-review. On general grounds, the scaling of at low enough represents a strong indication for the existence of the metal-insulator transition at \shortciteSachdev-book.
At somewhat higher in the metallic phase, it becomes apparent that, after the initial rapid drop, becomes a very weak function as \shortcitenc3,nc5. In fact, it is so weak that, on a logarithmic scale, it appears to saturate. As a result of this “saturation” of , single-parameter scaling fails at the lowest temperatures \shortcitenc3. However, a careful analysis of the data shows \shortcitenjk1,njk2,njk3 that all of the (or ) curves can be scaled according to the more general form \shortciteBelitz , where the critical conductivity , i.e. it vanishes as . In other words, the critical conductivity is not the “separatrix”, but instead it belongs to the insulating family of curves: , consistent with other studies \shortcitenc3,nc4. The exponent , however, is very small: \shortcitenjk1,njk2,njk3, so that a direct observation of is very difficult at experimentally accessible temperatures. A small value of is also the reason for the apparent success of the single-parameter scaling in the limited range of and . It is important to note that scaling with , also observed in 3D materials near the MIT \shortciteMyriam_review, does not contradict \shortciteBelitz any fundamental principle for 2D systems. Indeed, violations of “Wegner scaling” \shortciteBelitz, where ( – dimensionality), were predicted for certain microscopic models \shortcitenoWegner1,noWegner2,noWegner3 with strong spin-dependent components of the Coulomb interactions.
While the general scaling form describes the data satisfactorily as , it would be desirable to explore scaling and the precise form of over a wider range of . It turns out that the situation becomes simpler in samples with more disorder, where the onset of “saturation” of (or ) in the metallic phase is pushed to higher .
2.1.2 Intermediate-mobility samples and effects of local magnetic moments
Although the metallic temperature dependence of conductivity, (i.e. ), is less pronounced in samples with moderate mobility (4.2 K peak m2/Vs), it was demonstrated early on \shortciteDP_PRL that scaling is obeyed with exactly the same value of the exponent as in high-mobility samples. While the value of , defined as , was higher than in high-mobility devices333A study of Si MOSFETs with different peak mobilities indicated a systematic increase of with disorder; was defined as the “separatrix” \shortcitenc3., the corresponding was still comparably large.
By extending the measurements to lower \shortciteFeng-moments, however, the “saturation” of was observed to take place in the metallic phase at as high as K (Fig. 3 top). Moreover, the separatrix acquired an insulatinglike () temperature dependence. As a result, the simple, single-parameter scaling around the separatrix works only at K on the metallic side (Fig. 3 bottom). Thus the data are qualitatively similar to those on high-mobility samples, indicating that . However, since in the metallic phase () does not have a simple enough form over a sufficiently wide range of , it is still difficult to make reliable extrapolations to .
Fortunately, in Si MOSFETs it is also possible to change the type of the disorder in the same sample. As shown below, this results in a surprisingly simple, precise form of over a very wide range of , allowing reliable zero-temperature extrapolations and striking scaling behavior.
For a 2DES in Si, the disorder is due to the oxide charge scattering (scattering by ionized impurities randomly distributed in SiO2 within a few Å of the interface) and to the roughness of the Si-SiO2 interface \shortciteAFS. For a fixed , it is possible to change the disorder by applying bias to the Si substrate (back gate). In particular, the reverse (negative) moves the electrons closer to the interface, which increases the disorder. It also increases the splitting between the subbands since the width of the triangular potential well at the interface is reduced by applying negative . Usually, only the lowest subband is occupied at low , giving rise to the 2D behavior. In sufficiently disordered samples, however, the band tails associated with the upper subbands can be so long that some of their strongly localized states may be populated even at low , and act as additional scattering centers for 2D electrons. In particular, since at least some of them must be singly populated due to a large on-site Coulomb repulsion (tens of meV), they may act as local magnetic moments. Clearly, the negative reduces this type of scattering by depopulating the upper subband.
Therefore, by varying , it is possible to study the effect of local magnetic moments on the transport properties of the conduction electrons in a systematic and controlled way. It has been established \shortciteFeng-moments that scattering by local magnetic moments suppresses the metallic behavior with . Indeed, the data suggest that in the limit, the (i. e. ) behavior is suppressed by an arbitrarily small amount of scattering of the conduction electrons by disorder-induced local moments \shortciteFeng-moments. Figures 3(top) and 4(a) illustrate the striking effect of local moments on in the same sample: while the “usual”, metallic behavior with is observed in the absence of local moments [Fig. 3 top], curves become insulatinglike () for all after many local moments are introduced with [Fig. 4(a)].
(a)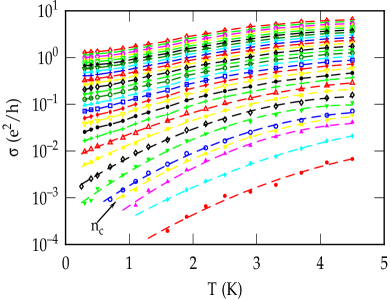 (b)
(b)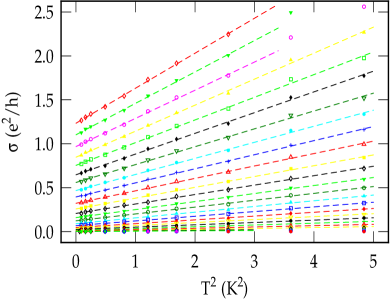 (c)
(c) (d)
(d)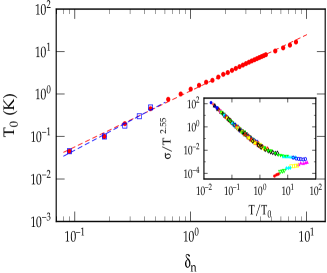 (e)
(e)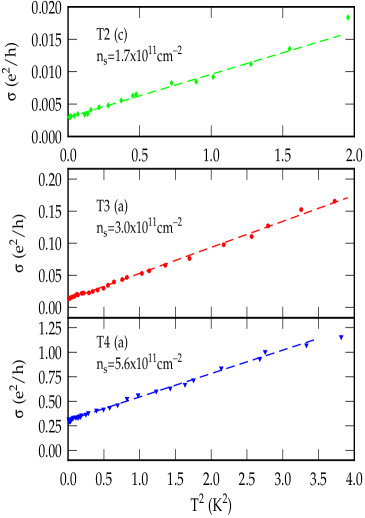
However, this does not necessarily indicate the destruction of the metallic phase. In disordered 3D metals, for example, it is well known that the derivative can be either negative or positive near the MIT \shortciteLR. On the other hand, the metallic behavior where decreases but does not go to zero (as expected for an insulator) when is new and unexpected in 2D.
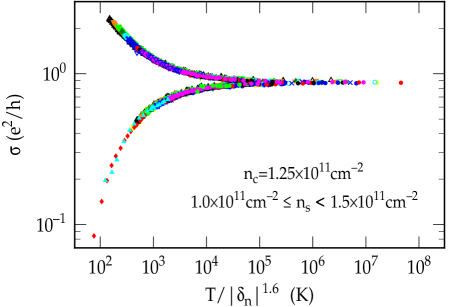
The analysis of the insulatinglike curves in Fig. 4(a) shows \shortciteFeng-novel that they follow a very simple and precise form over a broad (two decades) range of and : [Fig. 4(b)]. The high quality of the fits allows a reliable extrapolation of , whose finite (i. e. non-zero) values mean that, in spite of the decrease of with decreasing , the 2D system is in the metallic state. In particular, the zero-temperature conductivity is a power law function of [Fig. 4(c)]: (), as expected in the vicinity of a quantum critical point \shortciteGoldenfeld, such as the MIT. The power law holds over a very wide range of (up to 5) similar to what has been observed \shortciteRosenbaum2 in Si:P near the MIT. In addition, even though the MIT occurs at different in different samples, the critical exponents are the same [Fig. 4(c)], as expected from general arguments \shortciteGoldenfeld. It has been also demonstrated \shortciteFeng-novel that, near the MIT, the data obey dynamical scaling [Fig. 4(d)] with a temperature dependent critical conductivity (, , ), both in agreement with theoretical expectations near a quantum phase transition \shortciteBelitz and consistent with the extrapolations of to .
The form of is well established for metals containing local magnetic moments, and it is believed to result from the Kondo effect \shortciteHewson. In fact, there is no other known mechanism that results in an increase of as . Here this feature provides the most direct evidence of the presence of local magnetic moments. It should be noted that, in general, one expects the behavior for a quantum impurity embedded in a Fermi liquid in any dimension. While the nature of this novel metallic state in 2D may require further study, its simple allows for an unambiguous extrapolation to . The zero-temperature conductivity decreases continuously, and follows a distinct power-law behavior as the MIT is approached. In particular, metallic as small as has been observed \shortciteFeng-novel, in a striking contrast to anything that has been reported in other 2D systems when . A similar observation in 3D systems \shortciteRosenbaum2 has demonstrated the absence of minimum metallic conductivity, and has had a profound impact on shaping the theoretical ideas about the MIT.
2DES in Si MOSFETs have been studied extensively for more more than four decades, so it is interesting that the behavior has been identified only relatively recently \shortciteFeng-novel. A thorough examination of the early literature reveals, however, that the samples discussed here are representative of a broad class of Si MOSFETs historically (and somewhat unfairly) known as “nonideal” samples \shortciteAFS. “Nonideal” samples could be made more “ideal” by applying and vice versa \shortciteAFS, consistent with recent studies \shortciteFeng-moments,Feng-novel discussed above. Figure 4(e) shows an example of measured on samples with a modest peak mobility between 0.15 and 0.33 m2/Vs \shortciteStiles1-T2,Stiles2-T2. The “saturation” (on a log scale) of observed for K was puzzling at the time, but the replotted data show clear behavior.
2.1.3 Low-mobility (highly disordered) samples
Samples with very low 4.2 K peak mobility ( m2/Vs) have attracted less attention because they do not exhibit a pronounced, if any, metallic behavior. However, they not only exhibit the 2D MIT, but also other similarities to the behavior of“clean” 2DES, such as the onset of glassy charge dynamics (Section 3). In some ways, it is even advantageous to investigate samples with a lot of disorder. For example, the relevant electron densities, such as , are pushed to higher values (higher ), so that it is possible to reach much lower effective temperatures ( – Fermi temperature) than in high-mobility samples. Therefore, comparative studies of samples with varying amounts of disorder should provide valuable insights into the physics of systems near the MIT.
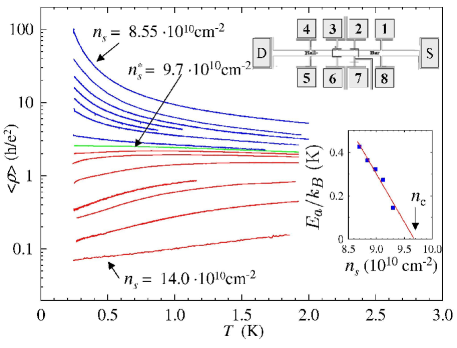
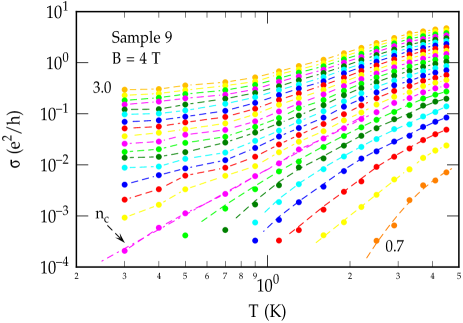
Detailed studies of transport and electron dynamics near the MIT have been performed on a set of Si MOSFETs with the 4.2 K peak mobility of only 0.06 m2/Vs with the applied V \shortciteSBPRL. This value of maximizes the peak mobility by removing the contribution of scattering by local magnetic moments (see Sec. 2.1.2 above), at least in the experimental -range. Because of the glassy fluctuations of with time at low and (see Sec. 3), the carrier density had to be changed at relatively high (here K) in small steps in order to obtain reproducible values of the time-averaged conductivity . The behavior of (Fig. 5 left) turns out to be quite similar to that of high-mobility Si MOSFETs. At the highest , for example, the devices exhibit metallic behavior with . The change of in a given range, however, is small (only 6% for the highest cm-2) as observed in other Si MOSFETs with a large amount of disorder \shortcitenc3. Even though the density cm-2 at the separatrix \shortciteSBPRL,SB_PhysE is much higher than in “clean” samples, the value of is similar, which, according to Drude formula, corresponds to ( – Fermi wave vector, – mean free path).
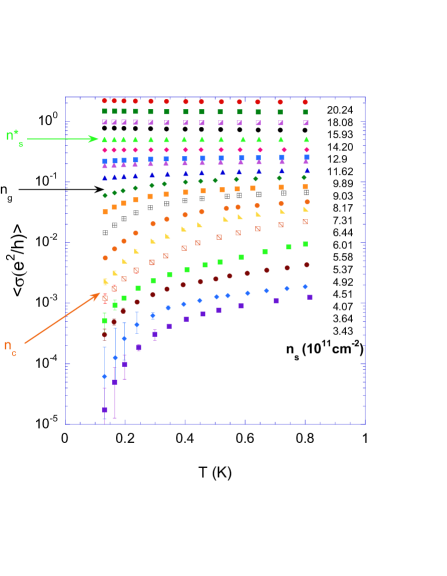
Likewise, at the lowest , the data are best described by the simply activated form .
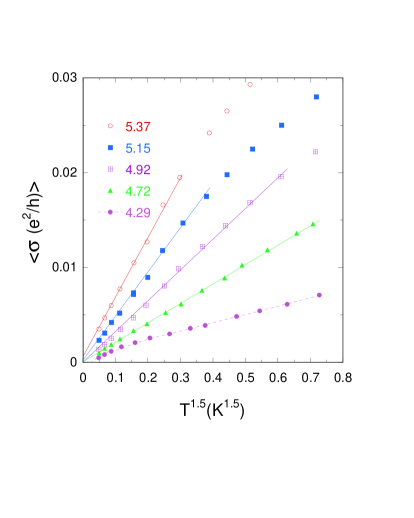
Perhaps the most striking difference between high- and low-mobility samples first becomes apparent when the vanishing of activation energy is used to determine . While in “clean” samples this gives (Sec. 2.1.1), here vanishes at cm-2, which is more than a factor of two smaller than (Fig. 5 left). This suggests that there is a wide range of on the metallic side of the MIT where is insulatinglike. Indeed, close to , the best phenomenological fit to the data is the metallic power-law behavior with (Fig. 5 right) \shortciteSBPRL. The fitting parameter is relatively small and, in fact, vanishes for cm and 4.92. Therefore, cm-2 () based on the data on both metallic and insulating sides of the MIT. Of course, a simple power law is consistent not only with general expectations near the MIT and the behavior observed in 3D systems \shortciteBelitz, but also with the careful analysis of high-mobility 2DES \shortcitenjk1,njk2,njk3 (Sec. 2.1.1) and those with local magnetic moments \shortciteFeng-novel (Sec. 2.1.2). Here the exponent takes a distinctly different value, presumably reflecting the different universality classes of those situations.
The surprising non-Fermi liquid behavior is consistent with theory \shortciteVlad-MITglass2 for the transition region between a Fermi liquid and an (insulating) electron glass. Indeed (see Sec. 3), the transition into a charge (Coulomb) glass in low-mobility samples takes place as at a density , such that (Fig. 5 left). The correction is characteristic of transport in the intermediate, region where the dynamics is glassy, but where is still metallic [] albeit so small that . Such “bad metals” include a variety of strongly correlated materials with unusual properties \shortcitebad. Interestingly, the behavior can be revealed also in high-mobility 2DES by applying a parallel magnetic field.
2.2 2D metal-insulator transition in a parallel magnetic field
Since magnetic field applied parallel to the 2DES plane couples only to electrons’ spins, it is often used to probe the importance of spin, as opposed to charge, degrees of freedom. Some of the intriguing results that have been obtained in parallel in the vicinity of the zero-field 2D MIT have been described in the review by \shortciteNSergey-review. One of the main issues has been the fate of the metallic phase in a parallel . From the insulating side, the critical density can be determined by extrapolating to zero the activation energy and nonlinearity of current-voltage characteristics (Sec. 2.1.1). For , however, the metallic behavior observed in high-mobility samples is suppressed by , making it even more difficult to determine the critical density from the metallic side. Nevertheless, a careful analysis reveals exactly the same metallic correction in high-mobility samples in parallel magnetic fields as in highly disordered samples in zero magnetic field, confirming the existence of the MIT in those two cases.
Figure 6(a) shows the phase diagram obtained for a high-mobility sample \shortciteJJ_noiseB. The critical densities were first determined using the activation energy method. Good agreement was found with the dependence obtained on very similar samples using both activation energies and nonlinear current-voltage characteristics444Because of the small sample to sample differences in the amount of disorder, the data from \shortciteNPnc2 have been shifted up by cm-2 to make the values coincide. \shortcitenc2. At low fields, increases with , and then it saturates for T, consistent with other studies that show that the 2DES is here fully spin polarized \shortcitepolarization1,polarization2,polarization3. Even though is very weak at higher , it is interesting to attempt to determine the separatrix, where . The corresponding density and, most intriguingly, within the measurement error, it coincides with , the glass transition density \shortciteJJ_SPIE04. was determined independently, based on the measurements of the fluctuations in \shortciteJJ_noiseB (Sec. 3.1).
The important question to address is the form of in the narrow region. Here
(a)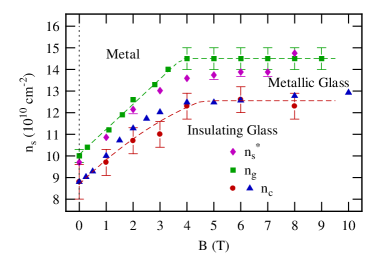 (b)
(b)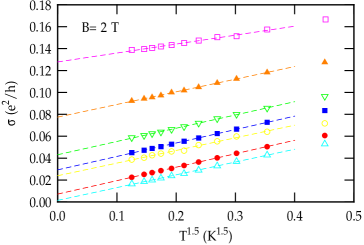 (c)
(c)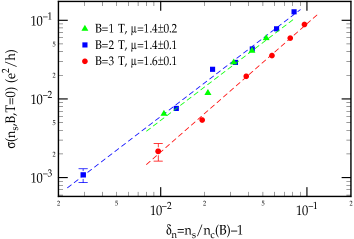 (d)
(d)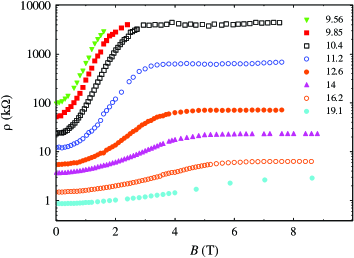
the data are best described by the metallic () power-law form [Fig. 6(b)], similar to what was observed in the metallic glassy phase of highly disordered samples at (Sec. 2.1.3). The extrapolated conductivities go to zero precisely at , in a power-law fashion with [Fig. 6(c); ] \shortciteJJ_noiseB that is in agreement with theoretical expectations near a quantum phase transition \shortciteBelitz. Interestingly, there is some evidence \shortciteFletcher of similar behavior at with , obtained by extrapolating to the “saturation” of in the regime of different high-mobility Si MOSFETs. The striking power-law behavior shown in Fig. 6(c) and the remarkable agreement between obtained from on both insulating and metallic sides of the MIT are strong evidence for the survival of the MIT and the metallic phase in parallel .
In low-disordered (“clean”) samples at , the critical density [Sec. 2.1.1, Fig. 6(a)] and the intermediate, metallic glass phase is practically absent. A parallel , however, increases its width, allowing the emergence of the characteristic correction to . The increase of both and , and the broadening of the metallic glass phase with can be understood to result from the suppression of screening by a parallel \shortciteBscreening1,Bscreening2, which increases the effective disorder. This, in turn, favors glassiness, consistent with theoretical expectations \shortciteDarko-glass, and makes the behavior of “clean” samples more similar to that of highly disordered ones (Sec. 2.1.3). The existence of the glass transition in high parallel , where the 2DES is spin polarized, provides evidence that charge, not spin, degrees of freedom are responsible for glassy ordering. This result clearly imposes a strong constraint on the types of theories that can be formulated to describe this phenomenon. Likewise, the broadening of the metallic glass phase with also indicates that its existence is not due to spin.
For near , 2DES in various semiconductors exhibit a strong, positive magnetoresistance (MR) \shortciteSergey-review, which has been a subject of great interest. The MR saturates at the field that corresponds to the full spin polarization \shortcitepolarization1,polarization2,polarization3,polarization4. As shown in Fig. 6(d) for the same high-mobility Si MOSFET discussed above, the MR jump is strong only for not too far from since it takes place as the system undergoes a magnetic-field driven MIT at [Fig. 6(a)]. In the metallic phase where T), the MR is weak.
In low-mobility Si MOSFETs, where the metallic glass phase is clearly observable already at , the phase diagram has not been studied. However, it is plausible to expect that the parallel will broaden the metallic glass phase even further.
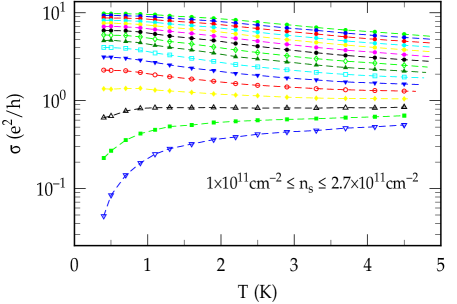
Finally, in intermediate-mobility 2DES with local magnetic moments, it is relatively easy to map out the phase diagram because of the simple form of that holds over a wide range of . In parallel , data (Fig. 7 top) are
qualitatively similar to the case (Sec. 2.1.2) \shortciteKevin_PRL. At the lowest , for example, decreases exponentially with decreasing , indicating an insulating state at . For , is weaker and its curvature is the opposite from the one expected for an insulating state. It clearly extrapolates to a finite value as , indicating a metallic phase (Sec. 2.1.2). is identified as the density where (Fig. 7 top), consistent with the case and in agreement with general arguments \shortciteBelitz. The exponent remains constant as a function of . The critical density determined in this way at each given allows the mapping of the phase diagram (Fig. 7 bottom). It should be noted that, at low fields ( T), curves exhibit beautiful scaling \shortciteKevin_PRL in agreement with extrapolations and general considerations \shortciteBelitz, providing additional strong evidence for a quantum phase transition in this system in parallel . In analogy with high-mobility samples, the MR exhibits a strong increase in the region of the magnetic-field driven MIT near \shortciteKevin_Proc. For T, where 2DES is spin polarized, saturates, indicating that the MIT occurs between a spin-polarized metal and a spin-polarized insulator. The existence of the metallic phase at fields up to 18 T has been confirmed by the measurements of , which retains a simple power-law form, albeit with a different exponent \shortciteKevin_PRL. The charge dynamics has not been studied in these samples yet.
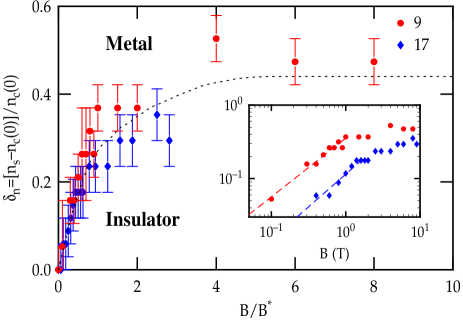
It is interesting that the dependence in samples with local moments (Fig. 7 bottom) is quite similar to that obtained on high-mobility samples [Fig. 6(a)]. In both cases, at low fields increases with in a power-law fashion: . The crossover exponent in Fig. 7 (bottom panel) and in Fig. 6(a). In other words, increases approximately linearly with at low fields. It is remarkable that this dependence is essentially the same in both cases, even though the behaviors in the metallic phase at are strikingly different. The key features of the phase diagram have been reproduced theoretically based on a scenario of quantum melting of a Wigner crystal as the mechanism of the MIT in sufficiently clean samples \shortciteVlad-Nature. In general, a power-law shift of with is expected to occur in the case of a true MIT \shortciteBelitz, and has been observed in several 3D systems \shortcite3Dbeta-1,3Dbeta-2,3Dbeta-3,3Dbeta-4.
3 Glassy freezing of electrons in two dimensions
Understanding the dynamics of glasses and other systems out of equilibrium is one of the most challenging and rapidly evolving topics in condensed matter research (see \shortciteNPLesHouches-2002). Since vastly different types of systems exhibit similar behavior, it is tempting to search for common organizing principles and unified theoretical approaches. However, despite some progress, there are still no well established theoretical frameworks for treating nonequilibrium behavior, which “remains largely uncharted territory” \shortciteCMMP-report. For example, although glassy behavior may dominate the low-temperature properties of many complex materials near quantum phase transitions \shortciteMir-Dob-review (Sec. 1), such as the MIT, quantum glasses are even less understood than their classical counterparts. Experimental studies of charge or Coulomb glasses \shortciteeglass1,eglass2,eglass3,eglass4,eglass5, which are of particular relevance to the MIT, have been relatively scarce \shortciteMonroe1,films1-Zvi,films1a-Zvi,films2-Zvi,films3-Zvi,films4-Zvi,films5-Zvi,films6-Zvi,films7-Zvi,films3-a,films3-b,films3-c,films3-d,films3-e,films3-f,films3-g,Kar,Armitage, and mostly limited to insulating systems far from the MIT. Recent observations \shortciteSBPRL,SB_PhysE,JJ_PRL02,JJ_PhysE02,SB_SPIE03,JJ_noiseB,JJ_SPIE04,relax-PRL,tw-PRL,DP-aging of glassiness in a 2DES in Si MOSFETs near the MIT open up opportunities for exploring glassy phenomena in this important regime over a wide range of all the relevant parameters.
There are two basic ways to explore the dynamics of glassy systems. The first one is to measure the response of the system to some kind of a perturbation. In a spin glass, for example, this would typically involve a study of the relaxation of the magnetization following some combination of rapid cooling and a change in the applied magnetic field (see \shortciteNVincent-school for a pedagogical review). The second one is to measure the fluctuations of an observable with time (i.e. noise), which provides information on correlations555In equilibrium systems, the connection between spontaneous fluctuations of a variable and the response of such a variable to a small perturbation in its conjugated field is given by the fluctuation-dissipation relation. See \shortciteNnieuw-book for the review and discussion of thermodynamics of out-of-equilibrium systems.. In spin glasses, transport noise measurements were required in order to provide definitive information on the details of glassy ordering and dynamics \shortciteWeiss93. Both approaches have been used to probe the dynamics of the 2DES in Si, focussing on the conductivity as the variable most relevant to the MIT. Measurements were performed on both high- and low-mobility Si MOSFETs, which also differ substantially in their geometry, size, and many other fabrication details, spanning essentially the entire range of Si technology. Thus the emergence of glassy dynamics proves to be a universal phenomenon in Si inversion layers, at least in the absence of disorder-induced local magnetic moments. The effect of local moments on charge dynamics still remains to be investigated.
3.1 Fluctuations of conductivity
The experimental protocol for measuring the fluctuations is simple, in principle: the measurement of at a given or electron density is set up at high temperatures, the sample is then cooled to the measurement , and is measured as a function of time. At the end of the measurement, the sample is warmed up to a temperature that is so high that a subsequent cool-down to the same measurement would result in a reproducible value of the time-averaged within the experimental uncertainty. The carrier density is changed at a high temperature, and the protocol is repeated for different and . In practice, the measurement set-up itself is often somewhat complicated \shortciteSBPRL,JJ_PRL02,SB_SPIE03 because it is important to rule out various extraneous effects, such as the fluctuations of , , or contacts, as possible sources of the measured noise. However, there are now a number of standard methods to accomplish this (see, e.g., \shortciteNSco87, \shortciteNVerbruggen89).
In both low- and high-mobility samples, exhibits strong fluctuations with time at low and . Figure 8 left shows the fluctuations of in a low-mobility sample666 represents averaging over time intervals of, typically, several hours. for several at K. It is striking that, for the lowest , the fluctuation amplitude is of the order of 100%. In addition to rapid, high-frequency fluctuations, slow changes over periods of several hours are also evident.
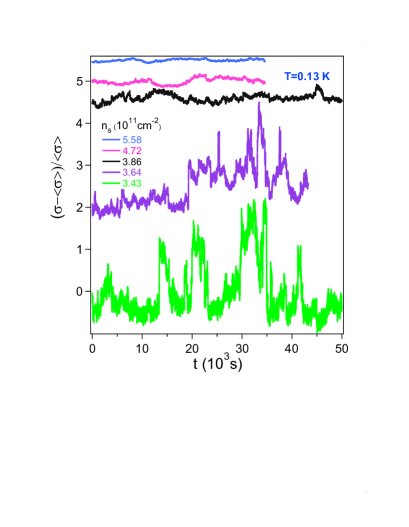
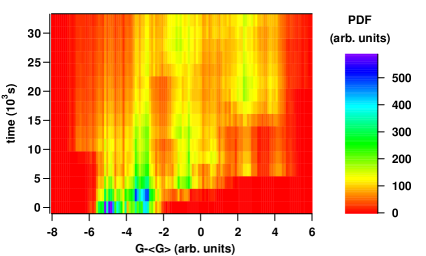
The probability density function (PDF) of the fluctuations illustrates how the sample explores the free energy landscape (FEL). For , the PDF is always not only non-Gaussian but also has a very complex structure that changes with time (Fig. 8 right). The PDF broadens with the increasing sampling time , as the system has more time to explore the FEL. However, it explores it so slowly that it remains nonergodic on experimental time scales. For , on the other hand, the PDFs become perfectly Gaussian on much shorter time scales, suggesting that the system reaches equilibrium. The amplitude of the fluctuations decreases dramatically from 100% to less than 1% with increasing either (Fig. 8 left) or .
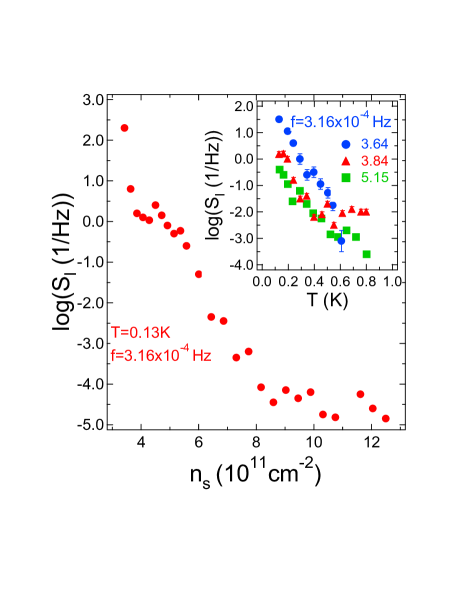
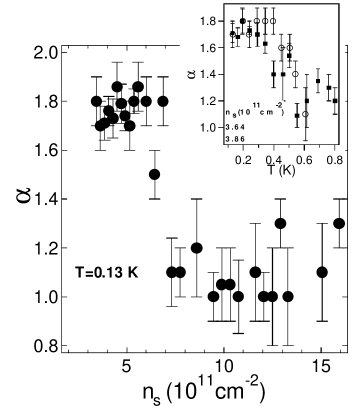
An even more dramatic density dependence of the noise at low is revealed by the study of the power spectra (–frequency) of the relative changes in the conductivity . Most of the spectra were obtained in the Hz bandwidth, where they follow the well-known empirical law \shortciteHooge,Weiss88. At the highest , does not depend on (Fig. 9 left) but, as is reduced below , increases enormously, by up to six orders of magnitude at low . Moreover, for a given , increases exponentially with decreasing (Fig. 9 left, inset). The observed makes it possible to rule out various simple models of noise (see, e.g., \shortciteNSBPRL, \shortciteNSB_SPIE03 for discussion). The most striking feature of the data, however, is the sharp jump of the exponent at (Fig. 9 right). While (“pure” noise) for , below , reflecting a sudden shift of the spectral weight towards lower frequencies. Similar large values of have been observed in some spin glasses above the MIT \shortcitejjprl98,Neutt, and in submicron wires \shortciteWrobel. Both the increase in the magnitude of the noise at low and the jump in reflect a sudden and dramatic slowing down of the electron dynamics at , indicating glassy freezing.
The onset of glassy dynamics on the metallic side of the MIT, i.e. at cm-2, implies the existence of the metallic glass phase for , which is consistent with the predictions of the model of interacting electrons near a disorder-driven MIT \shortciteDarko-glass. Since, in the glassy phase, decreases with increasing (Fig. 9 right, inset), the large values of and the jump in are observable only at relatively low .
Qualitatively the same behavior has been observed in the resistance (or conductance) noise of high-mobility samples, except that the glassy freezing takes place at \shortciteJJ_PRL02. Importantly, in both types of samples, the character of the noise also changes with density: while at low both the “shape” and the variance of the noise exhibit random, nonmonotonic changes with time, at high enough the noise always “looks” the same. This is illustrated in Fig. 10(a) for a high-mobility sample. The figure shows , where , in order to make it easier to compare the signals. A quantitative measure of the spectral wandering with time, such as that observed at low , is the
(a)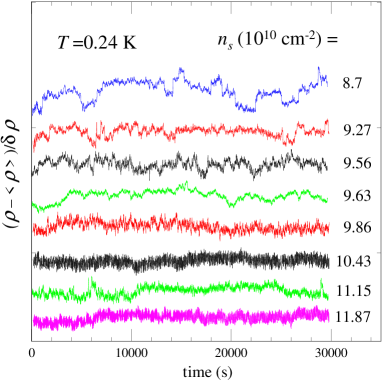
so-called second spectrum , which is a fourth-order noise statistic. is the power spectrum of the fluctuations of with time \shortciteWeiss93,WeissMMM, i. e. the Fourier transform of the autocorrelation function of the time series of . In general, if the fluctuators (e.g. two-level systems) are not correlated, is white (independent of ) \shortciteWeissMMM,Weiss88,Weiss93 and equal to the square of the first spectrum. Such noise is called Gaussian. On the other hand, has a nonwhite character, , for interacting fluctuators \shortciteWeissMMM,Weiss88,Weiss93. Therefore, the deviations from Gaussianity, or the exponent , provide a direct probe of correlations between fluctuators. Indeed, has been an important tool in studies of other glasses.
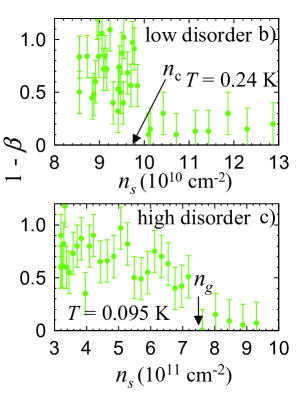
A detailed dependence of the exponent on has been determined for both high- and low-mobility samples (Figs. 10(b) and (c), respectively) \shortciteJJ_PRL02. In both cases, is white [] for , indicating that the observed noise results from uncorrelated fluctuators. It is quite remarkable that changes its character in a dramatic way exactly at in both types of samples. For , is strongly non-Gaussian, which demonstrates that the fluctuators are strongly correlated and provides an unambiguous evidence for the onset of glassy dynamics in a 2DES at .
In the studies of spin glasses, the scaling of with respect to and has been used \shortciteWeissMMM,Weiss93 to unravel the glassy dynamics and, in particular, to distinguish generalized models of interacting droplets or clusters from hierarchical pictures. In the former case, the low- noise comes from a smaller number of large elements because they are slower, while the higher- noise comes from a larger number of smaller elements, which are faster. In this picture, which assumes compact droplets and short-range interactions between them, big elements are more likely to interact than small ones and, hence, non-Gaussian effects and will be stronger for lower . , however, need to be compared for fixed , i. e. on time scales determined by the time scales of the fluctuations being measured, since spectra taken over a fixed time interval average the high-frequency data more than the low-frequency data. Therefore, in the interacting “droplet” model, should be a decreasing function of at constant . In the hierarchical picture, on the other hand, should be scale invariant: it should depend only on , not on the scale \shortciteWeissMMM,Weiss93. Figures 11(a) and (b) show that no systematic dependence of on is seen in either high- or low-mobility 2DES \shortciteJJ_PRL02. The observed scale invariance of signals that the system wanders collectively between many metastable states related by a kinetic hierarchy. Metastable states correspond to the local minima or “valleys” in the FEL (Fig. 1), separated by barriers with a wide, hierarchical distribution of heights and, thus, relaxation times. Intervalley transitions, which are reconfigurations of a large number of electrons, thus lead to the observed strong, correlated, -type noise, remarkably similar to what was observed in spin glasses with a long-range correlation of spin configuration \shortciteWeissMMM,Weiss93.
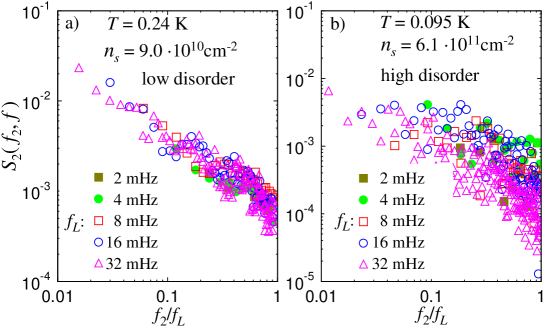
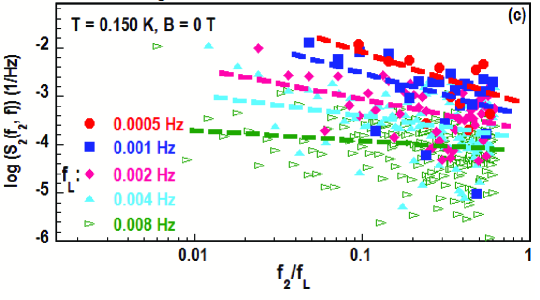
On the other hand, in systems where both long-range and short-range interactions are present, such as lightly doped La2-xSrxCuO4, reveals clearly \shortciteIR_PRL,IR-inplane [Fig. 11(c)] the presence of some characteristic energy scale, indicating that hierarchical models are not applicable and suggesting instead the formation of a cluster glass state. This is exactly what is expected in Coulomb systems with competing interactions (Sec. 1).
In the resistance noise measurements, the glass transition in a 2DES is thus manifested by (a) a sudden and dramatic increase of and a jump of from to , indicating the slowing down of the dynamics, and (b) a change of the exponent from a white (zero) to a nonwhite (nonzero) value, indicating an abrupt change to a correlated statistics, consistent with the hierarchical pictures of glassy dynamics \shortciteBinder. For high-mobility 2DES in Si MOSFETs, low- noise measurements were performed also in parallel \shortciteJJ_noiseB. By adopting the same criteria for the glass transition in , it was possible to determine shown in Fig. 6(a) and to establish that charge, not spin, degrees of freedom are responsible for glassy ordering (see Sec. 2.2). Measurements in both and show that glassy behavior generally emerges before the electrons localize (i.e. ), consistent with theory \shortciteDarko-glass. The glassy signatures in the noise become gradually stronger as decreases (e.g. Fig. 9 insets), suggesting that the glass transition takes place as . Strong evidence for and further support for as the glass transition density is provided by the measurements of the response of the 2DES to a strong perturbation.
3.2 Glassy response
In MOSFET structures, the easiest and the most obvious way to excite the system is a sudden change of . This method has been applied to several electron glasses \shortcitefilms1-Zvi,films1a-Zvi,films2-Zvi,films3-Zvi,films4-Zvi,films5-Zvi,films6-Zvi,films7-Zvi,films3-a,films3-b,films3-e,films3-g, including a 2DES in Si \shortciterelax-PRL,tw-PRL,DP-aging,aging-PhysB. So far, only low-mobility samples discussed above (Secs. 2.1.3 and 3.1) have been probed in this way. In particular, three different experiments have been carried out, as described below.
3.2.1 Relaxations of conductivity after a rapid change of carrier density
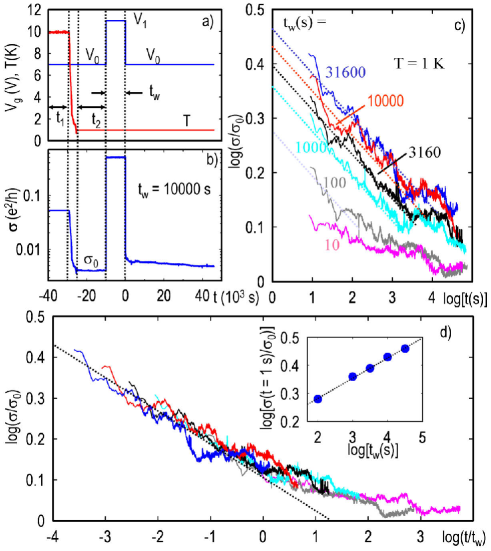
A systematic study of the relaxations (i.e. time dependence) of the conductivity has been performed at different and after a large, rapid change of (controlled by ) \shortciterelax-PRL. The sample was first cooled from high temperature (10 K) to the measurement temperature with an initial gate voltage . Then, at , the gate voltage was switched rapidly (within 1 s) to a final value , and was measured. In general, the results did not depend on any of the following: initial temperature, as long as it was K; ; the cooling time, which was varied between 30 minutes and 10 hours; the time the sample was kept at 10 K (from 5 minutes to 8 hours); the time the sample spent at the measurement before was changed (from 5 minutes to 8 hours). Figures 12(a) and (b) show a typical experimental run with exhibiting a rapid ( s) initial drop followed by a slower
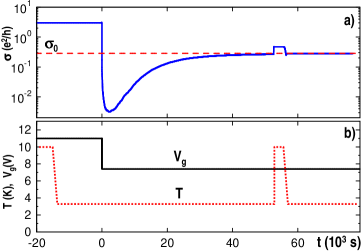
relaxation777The RC charging times of the device and the circuit were at most 10 ms.. After going through a minimum, increases and approaches a value . A subsequent warm-up to K and a cool down to the same measurement K, while keeping the gate voltage fixed at , shows that represents the equilibrium conductivity corresponding to the given and . It is interesting that, even though initially it drops to a value close to , first goes away from equilibrium before it starts approaching again. At the end of the run, the sample was warmed up to 10 K, gate voltage changed back to the same , and the experiment was repeated at a different for the same . The whole process was then repeated for different values of , in order to map out the density dependence of various relaxation parameters. It was established \shortciterelax-PRL that, for , the relaxations have the following properties.
After a sufficiently long , relaxes exponentially to its equilibrium value . The corresponding equilibration time obeys the simply activated form , K. While the microscopic origin of the activation energy is not known yet, the activation to an upper subband in Si MOSFETs or to Si-SiO2 interface traps has been ruled out \shortcitetw-PRL. However, regardless of the equilibration mechanism, the important result is that as , so that, strictly speaking, the system cannot reach equilibrium only at . In other words, the glass transition takes place at . Remarkably, a Monte Carlo study of the 2D Coulomb glass model has also found \shortciteGrempel an exponential divergence of , signaling a glass transition at . There are, however, some differences in the detail between the model and the experiment, indicating a need for further refinement of theory.
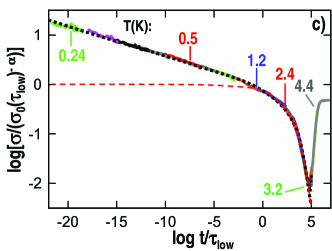
For short enough , obeys a nonexponential, Ogielski form \shortciteOgielski (, ) [Fig. 12(c)], which is a product of a power law and a stretched exponential function. Both types of relaxations are considered to be typical signatures of glassy behavior and reflect the existence of a broad distribution of relaxation times. The scaling parameter ( K) so that, as , and the relaxations attain a pure power-law form . The Ogielski form, the divergence of , and the resulting power law relaxation at are consistent with the general scaling arguments \shortcitescaling near a continuous phase transition occurring at . These results are very similar to scaling observed in spin glasses888 is finite in spin glasses. above \shortcitePappas. In a 2DES, as , providing further evidence for as the glass transition density.
exhibits a very pronounced and precise dependence on the density: (–a proportionality constant). Since in 2D (Sec. 2), this particular form of provides strong evidence that the observed out-of-equilibrium behavior is dominated by the Coulomb interactions between 2D electrons.
Perhaps the most peculiar finding is that the 2DES equilibrates only after it first goes farther away from equilibrium. While the precise mechanism for nonmonotonic relaxation remains controversial, studies of other materials [spin glasses \shortcitesg-nonmon1,sg-nonmon2, manganites \shortcitemang-nonmon, insulating granular metals \shortciteAviad-nonmon, biological systems \shortcitebio-nonmon] and some theoretical models \shortciteth-nonmon1,th-nonmon2 suggest that it may be a general feature of systems that are far from equilibrium.
It should be noted that it is quite remarkable that this one experiment has provided so many important results. To put things into a perspective, for example, it has not been possible to determine in other electron glasses so far, and scaling in spin glasses \shortcitePappas has been observed only relatively recently, in spite of many more years of study.
3.2.2 Relaxations of conductivity after a waiting time protocol: aging and memory loss
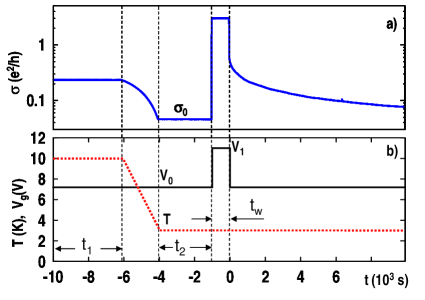
A key characteristic of relaxing glassy systems is the loss of time translation invariance, reflected in aging effects \shortciteaging1,aging2,glasses. The system is said to exhibit aging if its response to an external excitation depends on the system history in addition to the time . In a systematic study of the history dependence in a 2DES \shortcitetw-PRL, was measured after the temporary change of during the waiting time [Figs. 13(a) and (b)]. The history was varied by changing and for several initial (final) .
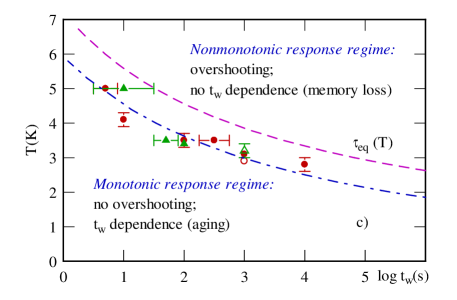
Two types of response have been observed: 1) monotonic, for relatively “small” excitations, where depend on , i.e. 2DES shows aging; 2) nonmonotonic, for sufficiently “large” excitations, where “overshoots” (i.e. it first goes farther away from equilibrium) and relaxations no longer depend on (memory loss). The monotonic relaxations [Fig. 13(a)] are consistent with a power-law form at the shortest times (or lowest ) and, at the longest , with a simple exponential approach to equilibrium.
The aging is observed when , i.e. if the system is unable to equilibrate under the new conditions during [Fig. 13(c)]. In that case, depends also on : the system has a memory of the time . This is very similar to spin glasses, where or play a role analogous to that of . In the opposite case, when and the 2DES equilibrates at a new state, the relaxations do not depend on since the system, naturally, has no memory of the waiting time. Therefore, the overshooting is observed when the system is excited out of thermal equilibrium. This is analogous to the experiment described above (Sec. 3.2.1) and thus sheds some light on that intriguing phenomenon.
The gate voltage changes employed in the relaxation experiments in a 2DES have been relatively large. For example, was changed up to a factor of 7, and thus the 2DES could go from the conducting to the insulating regime. Such large are expected to trigger major rearrangements of the electron configuration since the corresponding shifts of the Fermi energy999[K]cm for electrons in Si \shortciteAFS. \shortciteMuller-French. It is possible to speculate that such large perturbations might be somehow responsible for the peculiar overshooting effect. Considerable charge rearrangements, coupled with possibly substantial changes in the screening of the 2DES across the MIT \shortciteVlad-MITglass1,Muller-scr,Pankov-scr, present a fundamentally different situation from the cooling of the 2DES at a fixed when , where no relaxations have been observed. On the other hand, smaller perturbations of a Coulomb glass are expected to lead to memory effects \shortciteMuller-memory, in agreement with the observations for . In that case, the final state has a large configurational similarity with the original state due to the shortness of . In InOx films, another well-studied electron glass, the overshooting of equilibrium has not been seen, but aging and memory effects have been observed \shortcitefilms1-Zvi,films1a-Zvi,films2-Zvi,films3-Zvi,films4-Zvi. Those experiments were done in the regime of small perturbations, because the typical change in the carrier density due to was %, the system always remained deep in the insulating state, and was satisfied.
3.2.3 Aging effects across the MIT in 2D
Aging effects have been instrumental as a probe of complex nonequilibrium dynamics in many types of materials. In a 2DES, where the onset of glassy dynamics takes place on the metallic side, a study of aging, especially across the MIT, is of great interest. Aging is observed if [Fig. 13(c)]. Since the equilibration time diverges exponentially as (Sec. 3.2.1), strictly speaking, the system can reach equilibrium at all . However, even at that are not too low (e.g. K), exceeds easily not only the experimental time window but also the age of the Universe \shortciterelax-PRL. This makes it relatively easy to study the out-of-equilibrium relaxation of at times , where one expects to find properties common to other types of glasses. In strongly localized systems, such as InOx films, the aging function is just a function of \shortcitefilms1-Zvi,films1a-Zvi,films2-Zvi,films3-Zvi,films4-Zvi. This is known as simple, or full aging. It is interesting that, in spin glasses, full aging has been demonstrated only relatively recently \shortcitesg-fullaging. In general, however, the existence of a characteristic time scale does not necessarily imply simple scaling \shortciteLesHouches-2002. In the mean-field models of glasses, for example, two different cases are distinguished: one, where full aging is expected, and the other, where no scaling is expected \shortcitemean-field. Experimentally, departures from full aging are common \shortciteaging1,glasses.
Aging was investigated in detail in a 2DES \shortciteDP-aging using the waiting time protocol [Sec. 3.2.2; Figs. 14(a), (b)], but was kept fixed at 1 K such that was astronomical and, hence, the 2DES was always deep in the limit [Fig. 13(c)]. were then explored systematically both as a function of final and of the difference in densities during and after . Figure 14(c) illustrates the significant effect of on . In fact, all the data can be collapsed onto a single curve simply by rescaling the time axis by [Fig. 14(d)]. Therefore, in this case, the system exhibits full aging at least up to –. The relaxations can be described by a power law for times up to about , followed by a slower relaxation at longer . This means that the memory of is imprinted on the form of each .
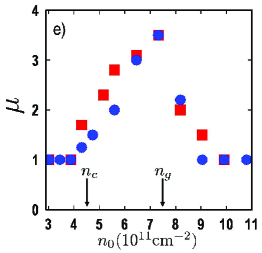
For all , exhibit simple or full aging. However, as increases above , there is an increasingly strong departure from full aging. In some other glasses \shortciteaging1,Ocio-mu1,Ocio-mu2, it was found that the data could be scaled with a modified waiting time , where is a fitting parameter ( for full aging). Even though may not have a clear physical meaning, the -scaling approach has proved to be a useful tool for studying departures from full aging \shortciteaging1,LesHouches-2002. By adopting a similar method in the study of aging in a 2DES, it was possible to achieve an approximate collapse of the data \shortciteDP-aging. The plot of vs. [Fig. 14(e)] shows a clear distinction between the full aging regime for , and the aging regime where significant departures from full scaling are seen. It is striking that the largest departure occurs at . For , some small relaxations are observed (only for ) resulting from finite-temperature effects, but they vanish in the limit (Sec. 3.2.1). It was also determined that does not depend on \shortciteaging-PhysB.
These results are striking because they reveal an abrupt change in the nature of the glassy phase exactly at the 2D MIT itself, before glassiness disappears completely at a higher density . In other words, this is strong evidence that the insulating glassy phase and the metallic glassy phase are different. Therefore, the difference in the aging properties below and above puts constraints on the theories of glassy freezing and its role in the physics of the 2D MIT.
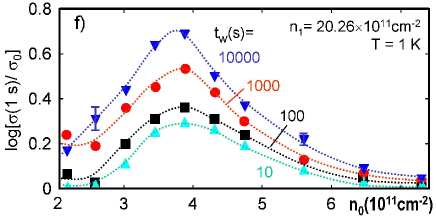
Furthermore, for a given , the amplitude of has a peak at [Fig. 14(f)], reflecting an interesting and surprising suppression of the relaxations on the insulating side of the 2D MIT. While a clear understanding of this effect is lacking, it is plausible that collective charge rearrangements that are responsible for the slow dynamics will be suppressed as the 2DES becomes strongly localized. It would be also of interest to study aging deeper in the insulator, in the variable-range hopping regime, but that is not possible because of the small relaxation amplitudes and the large intrinsic sample noise. Of course, the effects of disorder could be explored further by extending the relaxation studies to cleaner (high-mobility) 2DES, where \shortciteJJ_PRL02,JJ_noiseB. Regardless of the origin of the nonmonotonic behavior in Fig. 14(f), however, it is important to note that it reflects another change in the aging properties that occurs at the MIT.
4 Summary
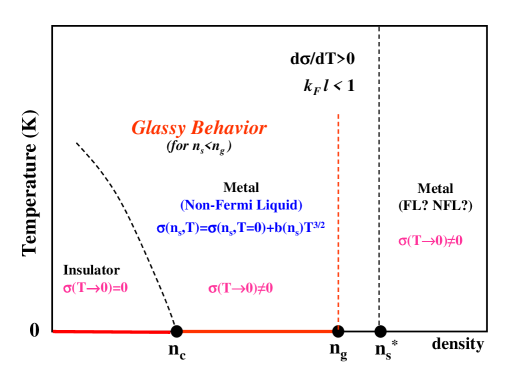
Careful studies have provided strong evidence that all 2DES in Si MOSFETs exhibit a metal-insulator transition regardless of the amount or type of disorder (Fig. 15). This is confirmed by extrapolating on both metallic and insulating sides of the MIT, and by dynamical scaling of over a wide range of parameters in both and . In , the scaling form is obeyed with a temperature dependent critical conductivity , where the value of depends on the disorder. Thus belongs to the insulating family of curves. The results are consistent with general arguments near the MIT \shortciteBelitz and they are similar to the behavior in doped semiconductors near the 3D MIT \shortciteMyriam_review. The 2D metallic phase survives in very high parallel magnetic fields, long after the 2DES becomes fully spin polarized.
Measurements of the charge dynamics in a 2DES have established that the glass transition takes place at for all (Fig. 15). In general, the glassiness sets in on the metallic side of the MIT, i.e. at a density , thus giving rise to an intermediate, metallic glass phase between the “normal” metal (i.e. in the regime) and the glassy insulator. The glass transition and various glassy effects are observable only for , so that the intermediate phase is a very poor metal (). It is characterized by a very specific, non-Fermi liquid correction to in both low-mobility samples in and high-mobility samples in a magnetic field. In high-mobility samples in , the intermediate phase practically vanishes and the glass transition coincides with the MIT.
The manifestations of the glass transition in a 2DES for , as demonstrated by resistance noise measurements, include a dramatic slowing down of the electron dynamics and correlated statistics consistent with the hierarchical picture of glasses. The results have been further confirmed and supported by the studies of relaxations, which provide evidence for the diverging equilibration time as , broad distribution of relaxation times in the system, and scaling (in the time domain), consistent with a continuous phase transition at . The aging, one of the hallmarks of glassy dynamics, shows an abrupt change in its properties at the MIT, indicating that the natures of the insulating glass and metallic glass phases are different. The 2DES in Si thus exhibits all the characteristics common to other out-of-equilibrium systems, regardless of their dimensionality. Numerous similarities to spin glasses with long-range RKKY interaction are particularly remarkable. Here, however, only long-range Coulomb interaction and potential scattering are present, and measurements in a parallel magnetic field confirm that charge degrees of freedom, not spin, are responsible for glassy freezing. Therefore, the experiments show that the 2D MIT is closely related to the melting of this Coulomb glass.
5 Discussion
Experiments on a 2DES in Si clearly provide strong support to theoretical proposals describing the 2D MIT as the melting of a Coulomb glass \shortciteDarko-glass,MIT-glassothers1,MIT-glassothers2,MIT-glassothers3,Vlad-MITglass1,Vlad-MITglass2. In particular, the model of the MIT as a Mott transition with disorder \shortciteDarko-glass predicts the emergence of an intermediate metallic glass phase in sufficiently disordered systems (Fig. 16). Changing the carrier density in highly disordered samples, for example, corresponds to101010Since and in 2D and the disorder const, the change of in the experiment is described by in the phase diagram. trajectory 2 in the theoretical phase diagram in Fig. 16, where the intermediate phase is predicted to be relatively broad. On the other hand, for low-disordered samples (trajectory 1), the metallic glass phase is very narrow or it vanishes, in agreement with experimental observations. The same theory predicts \shortciteVlad-MITglass2 the correction to conductivity in the metallic glass phase, which is precisely what is found in the
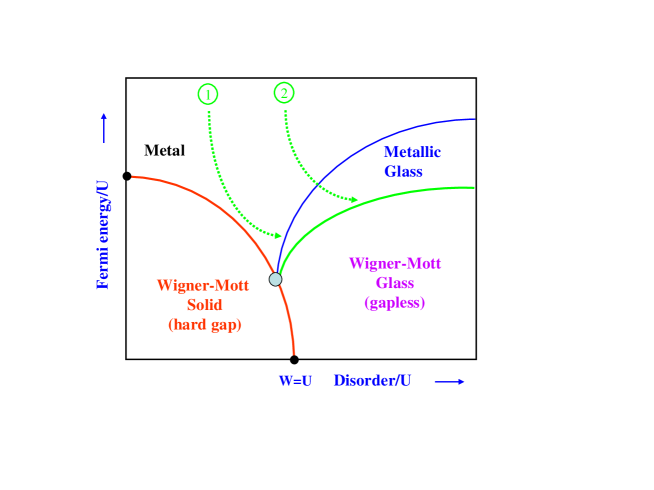
experiment. The emergence of the metallic glass phase, its dependence on the disorder, and the specific form of in this regime were obtained using a mean-field theory approach, which is known to produce hierarchical dynamics and aging in models of other glasses. Therefore, this approach seems promising in describing also the glassy charge dynamics in a 2DES in Si. There is currently no other theory available that predicts any of these experimental features.
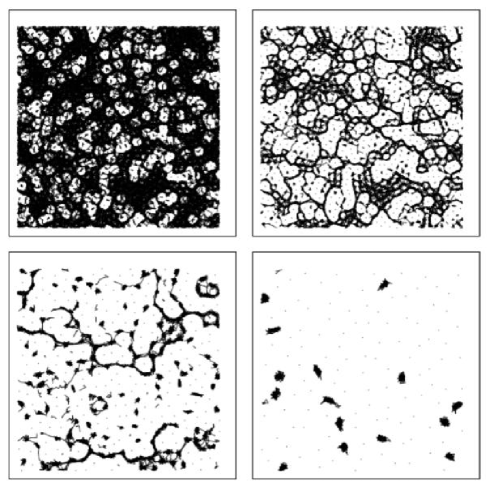
A molecular dynamics simulation of the crossover from a Wigner liquid to a Wigner glass in a 2D system of interacting electrons with disorder \shortciteReich-noise has reproduced the main noise results (Sec. 3.1). In particular, a strong, orders of magnitude increase in the noise power and a jump in the exponent was found at low and , as well as the emergence of non-Gaussianity. By looking at the electron trajectories for a fixed period of time (Fig. 17), it was found that, at the highest , electrons can flow freely throughout the sample. As is reduced, electron motion consists of a mixture of 2D and 1D regions (Fig. 17 upper right), but over longer times, the motion still occurs throughout the whole sample. At even lower (Fig. 17 lower left), motion occurs mostly through 1D channels that percolate through the sample. Importantly, the channel structures change very slowly with time: some channels close and others open up. Since transport is dominated by a small number of channels, this give rise to large fluctuations in the conductivity and strong correlations. Therefore, in this model, the large noise is due to dynamical inhomogeneities, similar to observations in other glasses \shortciteGlotzer1,Glotzer2. At the lowest , the channels disappear and transport occurs via jumps between localized regions. This corresponds to the deep insulating regime.
In addition, a completely different technique, namely, a Monte Carlo simulation of a 3D Coulomb glass out of equilibrium has also found evidence for similar dynamical heterogeneities \shortciteKolton.
There have been few experimental attempts so far to probe the charge dynamics near the MIT in other materials. The most exciting and important has been the study of the resistance noise in bulk doped Si \shortciteKar, which has been a prototypical system for investigating the critical behavior near the MIT \shortciteMir-Dob-review,Myriam_review for several decades. The results are strikingly similar to those on a 2DES in Si, namely: i) the noise power increases by several orders of magnitude at [Fig. 18(a)], ii) as decreases, the noise magnitude increases essentially exponentially for dopings (Fig. 18(a) right inset), iii) near the MIT, the exponent rapidly increases to a value much larger than 1 [Fig. 18(b)], and iv) the exponent of the second spectrum becomes strongly nonwhite () near [Fig. 18(c)], indicating the onset of correlated dynamics. The similarity of the non-Gaussian spectra observed in both 2DES and in 3D doped Si near the MIT supports the intriguing possibility that such correlated dynamics may indeed be a universal feature of the MIT
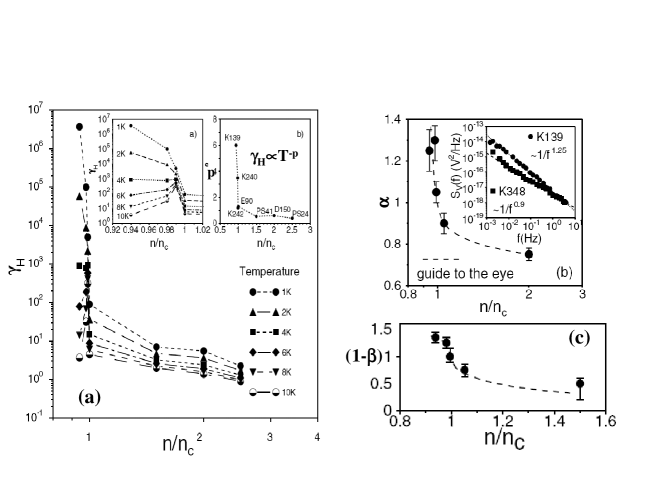
regardless of the dimensionality.
Resistance noise was also measured in very clean 2D hole systems (2DHS) in GaAs \shortciteLHote1,LHote2,LHote3. Even though an orders of magnitude enhancement of the noise was observed with decreasing and hole density , similar to the results on 2DES in Si and bulk doped Si, no evidence for strong correlations or glassiness was found. It is likely that the (lack of) disorder here plays a crucial role, since glassiness is not expected theoretically in sufficiently clean systems \shortciteDarko-glass (Fig. 16). It is interesting, though, that the behavior of transport and noise in an intermediate regime of was attributed to the coexistence of nanoscale conducting and insulating regions, consistent with other studies that favor the percolation picture in 2DHS and 2DES in GaAs \shortciteGaAs-percolation1,GaAs-percolation2,GaAs-percolation3,GaAs-percolationSavchenko. The local probes provide evidence \shortciteGaAs-percolation1,GaAs-percolation2 that as the density approaches the critical hole density from the metallic side, the 2DHS fragments into localized charge configurations that are distributed in space, so that the insulating phase is spatially inhomogeneous. The complicated structure emerges already on the metallic side of the MIT, reminiscent of the onset of glassiness in disordered 2DES in Si. Clearly, more work is needed to examine the charge dynamics in these systems, especially in the presence of a higher amount of disorder.
The resistance noise techniques, long used in studies of various glassy systems, are starting to be recognized as powerful tools also in the investigations of the dynamics of cuprates \shortciteIR_SPIE07,IR_PRL,IR-inplane,Weissman-YBCOnoise,Raffy-noise,YBCO-Orlyanchik. The currently available data, however, are scarce and difficult to compare because they probe very different materials and regions of phase space. This warrants further systematic studies of the charge dynamics in various cuprates as a function of all the relevant parameters, such as doping and disorder, as well as different growth techniques. Comparative studies of charge dynamics in a 2DES in Si, as an excellent model system for the MIT and out-of-equilibrium behavior, and in more complex materials, such as cuprates, should provide important information on these two fundamental problems of condensed matter physics.
6 Acknowledgments
This work was supported by NSF Grant DMR-0905843 and the National High Magnetic Field Laboratory via NSF Grant DMR-0654118.
References
- Alba et al. (1987) Alba, M., Hammann, J., Ocio, M., Refregier, Ph., and Bouchiat, H. (1987). Spin-glass dynamics from magnetic noise, relaxation, and susceptibility measurements. J. Appl. Phys., 61, 3683.
- Alba et al. (1986) Alba, M., Ocio, M., and Hammann, J. (1986). Ageing process and response function in spin glasses: An analysis of the thermoremanent magnetization decay in Ag:Mn (2.6%). Europhys. Lett., 2, 45.
- Allison et al. (2006) Allison, G. D., Galaktionov, E. A., Savchenko, A. K., Safonov, S. S., Fogler, M. M., Simmons, M. Y., and Ritchie, D. A. (2006). Thermodynamic density of states of two-dimensional GaAs systems near the apparent metal-insulator transition. Phys. Rev. Lett., 96, 216407.
- Altshuler et al. (2001) Altshuler, B. L., Maslov, D. L., and Pudalov, V. M. (2001). Metal-insulator transition in 2D: resistance in the critical region. Physica (Amsterdam), 9E, 209.
- Amir et al. (2011) Amir, A., Oreg, Y., and Imry, Y. (2011). Electron glass dynamics. Annu. Rev. Condens. Matter Phys., 2, 235.
- Ando et al. (1982) Ando, T., Fowler, A. B., and Stern, F. (1982). Electronic properties of two-dimensional systems. Rev. Mod. Phys., 54, 437.
- Barrat et al. (2003) Barrat, J.-L., Feigelman, M., Kurchan, J., and Dalibard, J. (ed.) (2003). Slow Relaxations and Nonequilibrium Dynamics in Condensed Matter. Springer, Berlin.
- Belitz and Kirkpatrick (1994) Belitz, D. and Kirkpatrick, T. R. (1994). The Anderson-Mott transition. Rev. Mod. Phys., 66, 261.
- Belitz and Kirkpatrick (1995) Belitz, D. and Kirkpatrick, T. R. (1995). Order parameter description of the Anderson-Mott transition. Z. Phys. B, 98, 513.
- Ben-Chorin et al. (1993) Ben-Chorin, M., Ovadyahu, Z., and Pollak, M. (1993). Nonequilibrium transport and slow relaxation in hopping conductivity. Phys. Rev. B, 48, 15025.
- Bielejec and Wu (2001) Bielejec, E. and Wu, W. (2001). Electron glass in ultrathin granular Al films at low temperatures. Phys. Rev. Lett., 87, 256601.
- Binder and Young (1986) Binder, K. and Young, A. P. (1986). Spin glasses: Experimental facts, theoretical concepts, and open questions. Rev. Mod. Phys., 58, 801.
- Bogdanovich et al. (1997) Bogdanovich, S., Dai, P., Sarachik, M. P., Dobrosavljević, V., and Kotliar, G. (1997). Scaling of the conductivity of Si:B: Anomalous crossover in a magnetic field. Phys. Rev. B, 55, 4215.
- Bogdanovich and Popović (2002a) Bogdanovich, S. and Popović, D. (2002a). Glass transition in a two-dimensional electron system in silicon. Physica E, 12, 604.
- Bogdanovich and Popović (2002b) Bogdanovich, S. and Popović, D. (2002b). Onset of glassy dynamics in a two-dimensional electron system in silicon. Phys. Rev. Lett., 88, 236401. Erratum, Phys. Rev. Lett. 89, 289904 (2002).
- Bonetti et al. (2004) Bonetti, J. A., Caplan, D. S., Harlingen, D. J. Van, and Weissman, M. B. (2004). Electronic transport in underdoped YBa2Cu3O7-δ nanowires: evidence for fluctuating domain structures. Phys. Rev. Lett., 93, 087002.
- Bouchaud et al. (1997) Bouchaud, J.-P., Cugliandolo, L. F., Kurchan, J., and Mezard, M. (1997). Out of equilibrium dynamics in spin-glasses and other glassy systems. In Spin Glasses and Random Fields (ed. A. P. Young). World Scientific, Singapore.
- Camjayi et al. (2008) Camjayi, A., Haule, K., Dobrosavljević, V., and Kotliar, G. (2008). Coulomb correlations and the Wigner -Mott transition. Nature Phys., 4, 932.
- Caplan et al. (2010) Caplan, D. S., Orlyanchik, V., Weissman, M. B., Harlingen, D. J. Van, Fradkin, E. H., Hinton, M. J., and Lemberger, T. R. (2010). Anomalous noise in the pseudogap regime of YBa2Cu3O7-δ. Phys. Rev. Lett., 104, 177001.
- Castellani et al. (1987) Castellani, C., Kotliar, G., and Lee, P. A. (1987). Fermi-liquid theory of interacting disordered systems and the scaling theory of the metal-insulator transition. Phys. Rev. Lett., 59, 323.
- Chakravarty et al. (1999) Chakravarty, S., Kivelson, S., Nayak, C., and Voelker, K. (1999). Wigner glass, spin liquids and the metal-insulator transition. Philos. Mag. B, 79, 859.
- Committee on CMMP 2010 (2007) Committee on CMMP 2010, National Research Council (2007). Condensed-Matter and Materials Physics: The Science of the World Around Us. The National Academies Press, Washington, D.C.
- Dagotto (2002) Dagotto, E. (2002). Nanoscale phase separation and colossal magnetoresistance. Springer-Verlag, Berlin.
- Dagotto (2005) Dagotto, E. (2005). Complexity in strongly correlated electronic systems. Science, 309, 257–262.
- Dalidovich and Dobrosavljević (2002) Dalidovich, D. and Dobrosavljević, V. (2002). Landau theory of the Fermi-liquid to electron-glass transition. Phys. Rev. B, 66, 081107.
- Davies et al. (1982) Davies, J. H., Lee, P. A., and Rice, T. M. (1982). Electron glass. Phys. Rev. Lett., 49, 758.
- Davies et al. (1984) Davies, J. H., Lee, P. A., and Rice, T. M. (1984). Properties of the electron glass. Phys. Rev. B, 29, 4260.
- Deville et al. (2005) Deville, G., Leturcq, R., L’Hôte, D., Tourbot, R., Mellor, C. J., and Henini, M. (2005). noise in low density two-dimensional hole systems in GaAs. AIP Conf. Proc., 780, 139.
- Deville et al. (2006) Deville, G., Leturcq, R., L’Hôte, D., Tourbot, R., Mellor, C. J., and Henini, M. (2006). noise in a dilute GaAs two-dimensional hole system in the insulating phase. Physica E, 34, 252.
- Dobrosavljević et al. (2003) Dobrosavljević, V., Tanasković, D., and Pastor, A. A. (2003). Glassy behavior of electrons near metal-insulator transitions. Phys. Rev. Lett., 90, 016402.
- Dolgopolov and Gold (2000) Dolgopolov, V. T. and Gold, A. (2000). Magnetoresistance of a two-dimensional electron gas in a parallel magnetic field. JETP Lett., 71, 27.
- Emery and Kivelson (1995) Emery, V. J. and Kivelson, S. A. (1995). Superconductivity in bad metals. Phys. Rev. Lett., 74, 3253.
- Eng et al. (2001) Eng, K., Feng, X. G., Popović, D., and Washburn, S. (2001). Effects of a parallel magnetic field on the novel metallic behavior in two dimensions. Springer Proceedings in Physics, 87, 741.
- Eng et al. (2002) Eng, K., Feng, X. G., Popović, D., and Washburn, S. (2002). Effects of a parallel magnetic field on the metal-insulator transition in a dilute two-dimensional electron system. Phys. Rev. Lett., 88, 136402.
- Feng et al. (1999) Feng, X. G., Popović, D., and Washburn, S. (1999). Effect of local magnetic moments on the metallic behavior in two dimensions. Phys. Rev. Lett., 83, 368.
- Feng et al. (2001) Feng, X. G., Popović, D., Washburn, S., and Dobrosavljević, V. (2001). Novel metallic behavior in two dimensions. Phys. Rev. Lett., 86, 2625.
- Fletcher et al. (2001) Fletcher, R., Pudalov, V. M., Radcliffe, A. D. B., and Possanzini, C. (2001). Critical behaviour of thermopower and conductivity at the metal-insulator transition in high-mobility Si-MOSFETs. Semicond. Sci. Tech., 16, 386.
- Fruchter et al. (2007) Fruchter, L., Raffy, H., and Li, Z. Z. (2007). Resistance noise in Bi2Sr2CaCu2O8+δ. Phys. Rev. B, 76, 212503.
- Gao et al. (2002) Gao, X. P. A., Mills, A. P., Ramirez, A. P., Pfeiffer, L. N., and West, K. W. (2002). Weak-localization-like temperature-dependent conductivity of a dilute two-dimensional hole gas in a parallel magnetic field. Phys. Rev. Lett., 89, 16801.
- Glotzer (2000) Glotzer, S. C. (2000). Spatially heterogeneous dynamics in liquids: insights from simulation. J. Non-Cryst. Solids, 274, 342.
- Goldenfeld (1992) Goldenfeld, N. (1992). Lectures on Phase Transitions and the Renormalization Group. Addison-Wesley.
- Gor’kov and Sokol (1987) Gor’kov, L. P. and Sokol, A. V. (1987). Localized and delocalized states and the properties of the normal phase of recently discovered superconductors. JETP Lett., 46, 420.
- Grempel (2004) Grempel, D. R. (2004). Off-equilibrium dynamics of the two-dimensional Coulomb glass. Europhys. Lett., 66, 854.
- Grenet (2003) Grenet, T. (2003). Symmetrical field effect and slow electron relaxation in granular aluminium. Eur. Phys. J. B, 32, 275.
- Grenet et al. (2007) Grenet, T., Delahaye, J., Sabra, M., and Gay, F. (2007). Anomalous electric-field effect and glassy behaviour in granular aluminium thin films: electron glass? Eur. Phys. J. B, 56, 183.
- Grünewald et al. (1982) Grünewald, M., Pohlman, B., Schweitzer, L., and Würtz, D. (1982). Mean field approach to the electron glass. J. Phys. C, 15, L1153.
- Herbut (2001) Herbut, I. F. (2001). The effect of parallel magnetic field on the Boltzmann conductivity and the Hall coefficient of a disordered two-dimensional Fermi liquid. Phys. Rev. B, 63, 113102.
- Hernandez et al. (2003) Hernandez, L. M., Bhattacharya, A., Parendo, K. A., and Goldman, A. M. (2003). Electrical transport of spin-polarized carriers in disordered ultrathin films. Phys. Rev. Lett., 91, 126801.
- Hewson (1993) Hewson, A. C. (1993). The Kondo Problem to Heavy Fermions. Cambridge Univ. Press, Cambridge, England.
- Hodge (1995) Hodge, I. M. (1995). Physical aging in polymer glasses. Science, 267, 1945.
- Hohenberg and Halperin (1977) Hohenberg, P. C. and Halperin, B. I. (1977). Theory of dynamic critical phenomena. Rev. Mod. Phys., 49, 435.
- Hooge (1976) Hooge, F. N. (1976). noise. Physica (Amsterdam), 83B, 14.
- Ilani et al. (2000) Ilani, S., Yacoby, A., Mahalu, D., and Shtrikman, H. (2000). Unexpected behavior of the local compressibility near the metal-insulator transition. Phys. Rev. Lett., 84, 3133.
- Ilani et al. (2001) Ilani, S., Yacoby, A., Mahalu, D., and Shtrikman, H. (2001). Microscopic structure of the metal-insulator transition in two dimensions. Science, 292, 1354.
- Jaroszyński and Popović (2006) Jaroszyński, J. and Popović, D. (2006). Nonexponential relaxations in a two-dimensional electron system in silicon. Phys. Rev. Lett., 96, 037403.
- Jaroszyński and Popović (2007a) Jaroszyński, J. and Popović, D. (2007a). Aging effects across the metal-insulator transition in two dimensions. Phys. Rev. Lett., 99, 216401.
- Jaroszyński and Popović (2007b) Jaroszyński, J. and Popović, D. (2007b). Nonequilibrium relaxations and aging effects in a two-dimensional Coulomb glass. Phys. Rev. Lett., 99, 046405.
- Jaroszyński and Popović (2009) Jaroszyński, J. and Popović, D. (2009). Aging and memory in a two-dimensional electron system in Si. Physica B, 404, 466.
- Jaroszyński et al. (2002a) Jaroszyński, J., Popović, D., and Klapwijk, T. M. (2002a). Low-frequency resistance noise studies across the metal-insulator transition in silicon MOSFETs. Physica E, 12, 612.
- Jaroszyński et al. (2002b) Jaroszyński, J., Popović, D., and Klapwijk, T. M. (2002b). Universal behavior of the resistance noise across the metal-insulator transition in silicon inversion layers. Phys. Rev. Lett., 89, 276401.
- Jaroszyński et al. (2004a) Jaroszyński, J., Popović, D., and Klapwijk, T. M. (2004a). Glassy behavior of a two-dimensional electron system in Si in parallel magnetic fields. Proceedings of SPIE, 5469, 95.
- Jaroszyński et al. (2004b) Jaroszyński, J., Popović, D., and Klapwijk, T. M. (2004b). Magnetic field dependence of the anomalous noise behavior in a two-dimensional electron system in silicon. Phys. Rev. Lett., 92, 226403.
- Jaroszyński et al. (1998) Jaroszyński, J., Wróbel, J., G.Karczewski, Wojtowicz, T., and Dietl, T. (1998). Magnetoconductance noise and irreversibilities in submicron wires of spin-glass n+-Cd1-xMnxTe. Phys. Rev. Lett., 80, 5635.
- Jelbert et al. (2008) Jelbert, G. R., Sasagawa, T., Fletcher, J. D., Park, T., Thompson, J. D., and Panagopoulos, C. (2008). Measurement of low energy charge correlations in underdoped spin-glass La-based cuprates using impedance spectroscopy. Phys. Rev. B, 78, 132513.
- Jönsson and Takayama (2005) Jönsson, P. E. and Takayama, H. (2005). “Glassy dynamics” in Ising spin glasses – experiment and simulation. J. Phys. Soc. Jpn, 74, 1131.
- Jonsson et al. (1999) Jonsson, T., Jonason, K., and Nordblad, P. (1999). Relaxation of the field-cooled magnetization of an Ising spin glass. Phys. Rev. B, 59, 9402.
- Kar et al. (2003) Kar, S., Raychaudhuri, A. K., Ghosh, A., v. Löhneysen, H., and Weiss, G. (2003). Observation of non-Gaussian conductance fluctuations at low temperatures in Si:P(B) at the metal-insulator transition. Phys. Rev. Lett., 91, 216603.
- Kim et al. (1998) Kim, N.-J., Popović, D., and Washburn, S. (1998). Phase diagram and validity of one-parameter scaling near the two-dimensional metal-insulator transition. cond-mat/9809357.
- Kirkpatrick and Belitz (1994) Kirkpatrick, T. R. and Belitz, D. (1994). Anderson-Mott transition as a random-field problem. Phys. Rev. Lett., 74, 1178.
- Kivelson et al. (2003) Kivelson, S. A., Bindloss, I. P., Fradkin, E., Oganesyan, V., Tranquada, J. M., Kapitulnik, A., and Howald, C. (2003). How to detect fluctuating stripes in the high-temperature superconductors. Rev. Mod. Phys., 75, 1201.
- Kohsaka et al. (2007) Kohsaka, Y., Taylor, C., Fujita, K., Schmidt, A., Lupien, C., Hanaguri, T., Azuma, M., Takano, M., Eisaki, H., Takagi, H., Uchida, S., and Davis, J. C. (2007). An intrinsic bond-centered electronic glass with unidirectional domains in underdoped cuprates. Science, 315, 1380.
- Kolton et al. (2005) Kolton, A. B., Grempel, D. R., and Domínguez, D. (2005). Heterogeneous dynamics of the three-dimensional Coulomb glass out of equilibrium. Phys. Rev. B, 71, 024206.
- Kravchenko et al. (1994) Kravchenko, S. V., Kravchenko, G. V., Furneaux, J. E., Pudalov, V. M., and D’Iorio, M. (1994). Possible metal-insulator transition at in two dimensions. Phys. Rev. B, 50, 8039.
- Kravchenko et al. (1995) Kravchenko, S. V., Mason, W. E., Bowker, G. E., Furneaux, J. E., Pudalov, V. M., and D’Iorio, M. (1995). Scaling of an anomalous metal-insulator transition in a two-dimensional system in silicon at . Phys. Rev. B, 51, 7038.
- Kravchenko and Sarachik (2004) Kravchenko, S. V. and Sarachik, M. P. (2004). Metal-insulator transition in two-dimensional electron systems. Rep. Prog. Phys., 67, 1.
- Kurzweil and Frydman (2007) Kurzweil, N. and Frydman, A. (2007). Inverse slow relaxation in granular hopping systems. Phys. Rev. B, 75, 020202(R).
- Lebanon and Müller (2005) Lebanon, E. and Müller, M. (2005). Memory effect in electron glasses: theoretical analysis via a percolation approach. Phys. Rev. B, 72, 174202.
- Lee et al. (2005) Lee, M., Oikonomou, P., Segalova, P., Rosenbaum, T. F., Hoekstra, A. F. Th., and Littlewood, P. B. (2005). The electron glass in a switchable mirror: relaxation, ageing and universality. J. Phys. Condens. Matter, 17, L439.
- Lee and Ramakrishnan (1985) Lee, P. A. and Ramakrishnan, T. V. (1985). Disordered electronic systems. Rev. Mod. Phys., 57, 287.
- Leturcq et al. (2003) Leturcq, R., L’Hôte, D., Tourbot, R., Mellor, C. J., and Henini, M. (2003). Resistance noise scaling in a dilute two-dimensional hole system in GaAs. Phys. Rev. Lett., 90, 076402.
- Leuzzi and Nieuwenhuizen (2008) Leuzzi, L. and Nieuwenhuizen, T. M. (2008). Thermodynamics of the Glassy State. Taylor & Francis, New York.
- Levy et al. (2002) Levy, P., Parisi, F., Granja, L., Indelicato, E., and Polla, G. (2002). Novel dynamical effects and persistent memory in phase separated manganites. Phys. Rev. Lett., 89, 137001.
- Martinez-Arizala et al. (1998) Martinez-Arizala, G., Christiansen, C., Grupp, D. E., Markovic, N., Mack, A. M., and Goldman, A. M. (1998). Coulomb-glass-like behavior of ultrathin films of metals. Phys. Rev. B, 57, R670.
- Martinez-Arizala et al. (1997) Martinez-Arizala, G., Grupp, D. E., Christiansen, C., Mack, A. M., Markovic, N., Seguchi, Y., and Goldman, A. M. (1997). Anomalous field effect in ultrathin films of metals near the superconductor-insulator transition. Phys. Rev. Lett., 78, 1130.
- Miranda and Dobrosavljević (2005) Miranda, E. and Dobrosavljević, V. (2005). Disorder-driven non-Fermi liquid behaviour of correlated electrons. Rep. Prog. Phys., 68, 2337.
- Miyashita et al. (2007) Miyashita, S., Tanaka, S., and Hirano, M. (2007). Nonmonotonic relaxation in systems with reentrant-type interaction. J. Phys. Soc. Jpn, 76, 083001.
- Monroe (1990) Monroe, D. (1990). Capacitance measurements of the dynamics of screening in the electron glass. In Hopping and Related Phenomena 5 (ed. H. Fritzsche and M. Pollak). World Scientific, Singapore.
- Monroe et al. (1987) Monroe, D., Gossard, A. C., English, J. H., Golding, B., Haemmerle, W. H., and Kastner, M. A. (1987). Long-lived Coulomb gap in a compensated semiconductor – the electron glass. Phys. Rev. Lett., 59, 1148.
- Morita and Kaneko (2005) Morita, H. and Kaneko, K. (2005). Roundabout relaxation: collective excitation requires a detour to equilibrium. Phys. Rev. Lett., 94, 087203.
- Müller and Ioffe (2004) Müller, M. and Ioffe, L. B. (2004). Glass transition and the Coulomb gap in electron glasses. Phys. Rev. Lett., 93, 256403.
- Müller and Lebanon (2005) Müller, M. and Lebanon, E. (2005). History dependence, memory and metastability in electron glasses. J. Phys. IV France, 131, 167.
- Nelson (2003) Nelson, P. (2003). Biological physics: energy, information, life, Chapter 12. W. H. Freeman & Co., New York.
- Neuttiens et al. (2000) Neuttiens, G., Strunk, C., Haesendonck, C. V., and Bruynseraede, Y. (2000). Universal conductance fluctuations and low-temperature 1/f noise in mesoscopic AuFe spin glasses. Phys. Rev. B, 62, 3905.
- Ogielski (1985) Ogielski, A. T. (1985). Dynamics of three-dimensional Ising spin glasses in thermal equilibrium. Phys. Rev. B, 32, 7384.
- Okamoto et al. (1999) Okamoto, T., Hosoya, K., Kawaji, S., and Yagi, A. (1999). Spin degree of freedom in a two-dimensional electron liquid. Phys. Rev. Lett., 82, 3875.
- Orenstein and Millis (2000) Orenstein, J. and Millis, A. J. (2000). Advances in the physics of high-temperature superconductivity. Science, 288, 468.
- Orlyanchik and Ovadyahu (2004) Orlyanchik, V. and Ovadyahu, Z. (2004). Stress aging in the electron glass. Phys. Rev. Lett., 92, 066801.
- Ovadyahu (2006a) Ovadyahu, Z. (2006a). Quench-cooling procedure compared with the gate protocol for aging experiments in electron glasses. Phys. Rev. B, 73, 214204.
- Ovadyahu (2006b) Ovadyahu, Z. (2006b). Temperature- and field-dependence of dynamics in electron glasses. Phys. Rev. B, 73, 214208.
- Ovadyahu and Pollak (1997) Ovadyahu, Z. and Pollak, M. (1997). Disorder and magnetic field dependence of slow electronic relaxation. Phys. Rev. Lett., 79, 459.
- Paalanen et al. (1983) Paalanen, M. A., Rosenbaum, T. F., Thomas, G. A., and Bhatt, R. N. (1983). Critical scaling of the conductance in a disordered insulator. Phys. Rev. Lett., 51, 1896.
- Pankov and Dobrosavljević (2005) Pankov, S. and Dobrosavljević, V. (2005). Nonlinear screening theory of the Coulomb glass. Phys. Rev. Lett., 94, 046402.
- Pappas et al. (2003) Pappas, C., Mezei, F., Ehlers, G., Manuel, P., and Campbell, I. A. (2003). Dynamic scaling in spin glasses. Phys. Rev. B, 68, 054431.
- Pastor and Dobrosavljević (1999) Pastor, A. A. and Dobrosavljević, V. (1999). Melting of the electron glass. Phys. Rev. Lett., 83, 4642.
- Pollak (1984) Pollak, M. (1984). Non-ergodic behaviour of Anderson insulators with and without Coulomb interactions. Philos. Mag. B, 50, 265.
- Pollak and Ortuño (1982) Pollak, M. and Ortuño, M. (1982). Coulomb interactions in Anderson localized disordered systems. Sol. Energy Mater., 8, 81.
- Popović et al. (2003) Popović, D., Bogdanovich, S., Jaroszyński, J., and Klapwijk, T. M. (2003). Metal-insulator transition and glassy behavior in two-dimensional electron systems. Proceedings of SPIE, 5112, 99.
- Popović et al. (1997) Popović, D., Fowler, A. B., and Washburn, S. (1997). Metal-insulator transition in two dimensions: effects of disorder and magnetic field. Phys. Rev. Lett., 79, 1543.
- Pudalov et al. (1998a) Pudalov, V. M., Brunthaler, G., Prinz, A., and Bauer, G. (1998a). Lack of universal one-parameter scaling in the two-dimensional metallic regime. JETP Lett., 68, 442.
- Pudalov et al. (1998b) Pudalov, V. M., Brunthaler, G., Prinz, A., and Bauer, G. (1998b). Logarithmic temperature dependence of the conductivity of the two-dimensional metal. JETP Lett., 68, 534.
- Pudalov et al. (1993) Pudalov, V. M., D’Iorio, M., Kravchenko, S. V., and Campbell, J. W. (1993). Zero-magnetic-field collective insulator phase in a dilute 2D electron system. Phys. Rev. Lett., 70, 1866.
- Raičević et al. (2007) Raičević, I., Jaroszyński, J., Popović, D., Jelbert, G., Panagopoulos, C., and Sasagawa, T. (2007). Low-temperature resistance noise in lightly doped La2-xSrxCuO4. Proceedings of SPIE, 6600, 660020.
- Raičević et al. (2008) Raičević, I., Jaroszyński, J., Popović, D., Panagopoulos, C., and Sasagawa, T. (2008). Evidence for charge glasslike behavior in lightly doped La2-xSrxCuO4 at low temperatures. Phys. Rev. Lett., 101, 177004.
- Raičević et al. (2011) Raičević, I., Popović, D., Panagopoulos, C., and Sasagawa, T. (2011). Non-Gaussian noise in the in-plane transport of lightly doped La2-xSrxCuO4: Evidence for a collective state of charge clusters. Phys. Rev. B, 83, 195133.
- Reichhardt and Reichhardt (2004) Reichhardt, C. and Reichhardt, C. J. Olson (2004). Noise at the crossover from Wigner liquid to Wigner glass. Phys. Rev. Lett., 93, 176405.
- Richert (2002) Richert, R. (2002). Heterogeneous dynamics in liquids: fluctuations in space and time. J. Phys.: Condens. Matter, 14, R703.
- Rodriguez et al. (2003) Rodriguez, G. F., Kenning, G. G., and Orbach, R. (2003). Full aging in spin glasses. Phys. Rev. Lett., 91, 037203.
- Rosenbaum et al. (1980) Rosenbaum, T. F., Andres, K., Thomas, G. A., and Bhatt, R. N. (1980). Sharp metal-insulator transition in a random solid. Phys. Rev. Lett., 45, 1723.
- Rosenbaum et al. (1989) Rosenbaum, T. F., Field, S. B., and Bhatt, R. N. (1989). Variation of the metallic onset with magnetic field in doped germanium. Europhys. Lett., 10, 269.
- Rubi and Perez-Vicente (1997) Rubi, M. and Perez-Vicente, C. (ed.) (1997). Complex behavior of glassy systems. Volume 492, Lecture Notes in Physics. Springer, Berlin.
- Sachdev (1999) Sachdev, S. (1999). Quantum Phase Transitions. Cambridge University Press, UK.
- Sarachik (1995) Sarachik, M. P. (1995). Transport studies in doped semiconductors near the metal-insulator transition. In The Metal-Nonmetal Transition Revisited: A Tribute to Sir Nevill Mott (ed. P. P. Edwards and C. N. Rao). Francis and Taylor Ltd.
- Sarachik et al. (1998) Sarachik, M. P., Simonian, D., Kravchenko, S. V., Bogdanovich, S., Dobrosavljević, V., and Kotliar, G. (1998). Metal-insulator transition in Si:X (X=P,B): Anomalous response to a magnetic field. Phys. Rev. B, 58, 6692.
- Schmalian and Wolynes (2000) Schmalian, J. and Wolynes, P. G. (2000). Stripe glasses: Self-generated randomness in a uniformly frustrated system. Phys. Rev. Lett., 85, 836.
- Scofield (1987) Scofield, J. H. (1987). ac method for measuring low-frequency resistance fluctuation spectra. Rev. Sci. Instrum., 58, 985–993.
- Shashkin et al. (2001) Shashkin, A. A., Kravchenko, S. V., and Klapwijk, T. M. (2001). Metal-insulator transition in a 2D electron gas: Equivalence of two approaches for determining the critical point. Phys. Rev. Lett., 87, 266402.
- Sjöstrand et al. (1976) Sjöstrand, M. E., Cole, T., and Stiles, P. J. (1976). Low temperature saturation of the channel conductivity in silicon inversion layers. Surf. Sci., 58, 72.
- Sjöstrand and Stiles (1975) Sjöstrand, M. E. and Stiles, P. J. (1975). The channel conductivity in n-type Si inversion layers at very low electron densities. Solid State Commun., 16, 903.
- Struik (1978) Struik, L. C. E. (1978). Physical aging in amorphous polymers and other materials. Elsevier, Amsterdam.
- Thakur and Neilson (1996) Thakur, J. S. and Neilson, D. (1996). Frozen electron solid in the presence of small concentrations of defects. Phys. Rev. B, 54, 7674.
- Thakur and Neilson (1999) Thakur, J. S. and Neilson, D. (1999). Phase diagram of the metal-insulator transition in two-dimensional electronic systems. Phys. Rev. B, 59, R5280.
- Thorsmølle and Armitage (2010) Thorsmølle, V. K. and Armitage, N. P. (2010). Ultrafast (but many-body) relaxation in a low-density electron glass. Phys. Rev. Lett., 105, 086601.
- Tutuc et al. (2001) Tutuc, E., De Poortere, E. P., Papadakis, S. J., and Shayegan, M. (2001). In-plane magnetic field-induced spin polarization and transition to insulating behavior in two-dimensional hole systems. Phys. Rev. Lett., 86, 2858.
- Vaknin et al. (1998) Vaknin, A., Ovadyahu, Z., and Pollak, M. (1998). Evidence for interactions in nonergodic electronic transport. Phys. Rev. Lett., 81, 669.
- Vaknin et al. (2000) Vaknin, A., Ovadyahu, Z., and Pollak, M. (2000). Aging effects in an Anderson insulator. Phys. Rev. Lett., 84, 3402.
- Vaknin et al. (2002) Vaknin, A., Ovadyahu, Z., and Pollak, M. (2002). Nonequilibrium field effect and memory in the electron glass,. Phys. Rev. B, 65, 134208.
- Verbruggen et al. (1989) Verbruggen, A. H., Stoll, H., Heeck, K., and Koch, R. H. (1989). A novel technique for measuring resistance fluctuations independently of background noise. Appl. Phys. A, 48, 233–236.
- Vincent (2007) Vincent, E. (2007). Aging, rejuvenation and memory: the example of spin glasses. In Ageing and the Glass Transition (ed. M. Henkel, M. Pleimling, and R. Sanctuary), Volume 716, Lecture Notes in Physics, pp. 7–60. Springer.
- Vitkalov et al. (2001) Vitkalov, S. A., Sarachik, M. P., and Klapwijk, T. M. (2001). Spin polarization of two-dimensional electrons determined from Shubnikov -de Haas oscillations as a function of angle. Phys. Rev. B, 64, 073101.
- Vitkalov et al. (2000) Vitkalov, S. A., Zheng, H., Mertes, K. M., and Sarachik, M. P. (2000). Small angle Shubnikov-de Haas measurements in a 2D electron system: the effect of a strong in-plane magnetic field. Phys. Rev. Lett., 85, 2164.
- Washburn et al. (1999a) Washburn, S., Kim, N. J., Feng, X. G., and Popović, D. (1999a). Scaling laws, phase diagram, localized magnetic moments and Kondo effect in two-dimensional metals. Ann. Phys. (Leipzig), 8, 569.
- Washburn et al. (1999b) Washburn, S., Kim, N.-J., Li, K. P., and Popović, D. (1999b). Scaling and universal behavior near the two-dimensional metal-insulator transition. Mol. Phys. Rept., 24, 150.
- Watanabe et al. (1999) Watanabe, M., Itoh, K. M., Ootuka, Y., and Haller, E. E. (1999). Metal-insulator transition of isotopically enriched neutron-transmutation-doped 70Ge:Ga in magnetic fields. Phys. Rev. B, 60, 15817.
- Weissman (1988) Weissman, M. B. (1988). 1/f noise and other slow, nonexponential kinetics in condensed matter. Rev. Mod. Phys., 60, 537.
- Weissman (1993) Weissman, M. B. (1993). What is a spin glass? A glimpse via mesoscopic noise. Rev. Mod. Phys., 65, 829.
- Weissman et al. (1992) Weissman, M. B., Israeloff, N. E., and Alers, G. B. (1992). Spin-glass fluctuation statistics: mesoscopic experiments in CuMn. J. Magn. Magn. Mater., 114, 87.
- Wróbel et al. (1998) Wróbel, J., Jaroszyński, J., Dietl, T., Regiński, K., and Bugajski, M. (1998). Conductance noise of submicron wires in the regime of quantum Hall effect. Physica (Amsterdam), 256B-258B, 69.