VLTI observations of the dust geometry around R Coronae Borealis stars††thanks: Based on observations made with the Very Large Telescope Interferometer at Paranal Observatory under program 079.D-0415.
Abstract
We are investigating the formation and evolution of dust around the hydrogen-deficient supergiants known as R Coronae Borealis (RCB) stars. We aim to determine the connection between the probable merger past of these stars and their current dust-production activities
We carried out high-angular resolution interferometric observations of three RCB stars, namely RY Sgr, V CrA, and V854 Cen with the mid-IR interferometer, MIDI on the VLTI, using two telescope pairs. The baselines ranged from 30 to 60 m, allowing us to probe the dusty environment at very small spatial scales ( 50 mas or 400 ). The observations of the RCB star dust environments were interpreted using both geometrical models and one-dimensional radiative transfer codes.
From our analysis we find that asymmetric circumstellar material is apparent in RY Sgr, may also exist in V CrA, and is possible for V854 Cen. Overall, we find that our observations are consistent with dust forming in clumps ejected randomly around the RCB star so that over time they create a spherically symmetric distribution of dust. However, we conclude that the determination of whether there is a preferred plane of dust ejection must wait until a time series of observations are obtained.
keywords:
RY Sgr, V Cra, V854 Cen Techniques: interferometric; Techniques: high angular resolution; Stars: circumstellar matter; Stars: mass-loss1 Introduction
The R Coronae Borealis (RCB) stars are a small group of carbon-rich supergiants. Their defining characteristics are hydrogen deficiency and unusual variability (Clayton, 1996). RCB stars undergo massive declines of up to 8 mag due to the formation of carbon dust at irregular intervals. Two scenarios (Iben et al., 1996; Saio & Jeffery, 2002) have been proposed for the origin of RCB stars: the first is the merger of a helium and a carbon-oxygen white dwarfs that temporarily results in a swollen star (Webbink, 1984), while the second is a final helium-shell flash taking place on a white dwarf that temporarily increases the star’s radius to supergiant dimensions (Fujimoto, 1977; Renzini, 1979). Final-flash stars have been directly observed. In the case of Sakurai’s object, which suffered an outburst in 1995, the entire evolution from compact hot star to supergiant star with RCB variability was monitored with modern telescopes, creating a convincing link between final-flash and RCB stars. However, recently Clayton et al. (2005); Clayton et al. (2007) made the discovery that RCB stars have 18O/16O ratios that are orders of magnitude higher than those seen in any other known stars, including Sakurai’s object (Geballe et al., 2002). These high ratios are inconsistent with regular stellar evolution, but can be produced in the aftermath of a merger (Clayton et al., 2007; García-Hernández et al., 2010). This finding tips the balance of evidence in favour of a merger origin for RCB stars.
RCB stars have effective temperatures in the range 5000-7000 K so circumstellar gas in thermodynamic equilibrium would not be able to condense into dust at distances closer than 20 . However, we observe a correlation between pulsational phase and the onset of dust formation in five RCB stars which indicates that dust must condense close to the photosphere (Crause et al., 2007; Lawson et al., 1999; Pugach, 1977). It is possible that shocks created by the puslations will cause local density enhancements, and encourage non-equilibrium conditions. Then the preconditions for carbon nucleation may be temporarily present (Goeres & Sedlmayr, 1992; Woitke et al., 1996). Such conditions existing locally over the surface of the star could allow a “clump” of carbon dust as close as 2 to form which is then ejected by radiation pressure. The observed time scales for RCB dust formation fit well with those calculated by carbon chemistry models (Feast, 1986; Woitke et al., 1996).
Even though all RCB stars show an infrared (IR) excess, there is no increase in the excess seen at the time of a major decline in brightness. This indicates that the amount of new dust formed in one dust formation episode is small compared to the total mass emitting around the star (Clayton, 1996; Feast et al., 1997, and references therein).
Spectro-polarimetry of the prototype RCB star, R CrB, obtained during a deep decline showed a change in the position angle of the continuum polarisation consistent with a bipolar geometry, which includes a thick disk or torus that obscures the star and additional diffuse dust above the poles (Clayton et al., 1997). Large resolved shells with sizes ranging from 5″ to 20′ have been seen around various RCB stars at visible and IR wavelengths showing shapes ranging from spherically symmetric to slightly elliptical (Gillett et al., 1986; Walker, 1985, 1986; Clayton et al., 1999; Clayton & Ayres, 2001; Clayton, 2010).
Using near-IR interferometry, Ohnaka et al. (2003) found evidence for an asymmetrical dust geometry around R CrB at 20 from the star in addition to a thin dust shell at 60-80 . de Laverny & Mékarnia (2004) found an asymmetrical arrangement of dust clouds around RY Sgr in the - and -bands using adaptive optics. These dust clouds were found at 01-02 from the star corresponding to 700-1400 . Asymmetrical dust was also seen at 100 around RY Sgr in 2005 using interferometry in the mid-IR (Leão et al., 2007).
In this paper we investigate the immediate circumstellar environments of three RCB stars, RY Sgr, V854 Cen and V CrA, with the aim of determining a connection between the probable merger past of these stars and their current dust-production activities. In §2 we describe our observations; in §3 we report our modelling procedures. In §4 we provide the results of the modelling of the three sources, and finally, in §5 we discuss our results in the context of past work.
2 Observations
| Observation | Date | Baseline | Label | Projected baseline | |
|---|---|---|---|---|---|
| (g=grism) | Length | PA | |||
| (p=prism) | (meters) | (degrees) | |||
| RY Sgr-g | 2005-06-25 | U1-U4 | B1 | 122 | 34 |
| RY Sgr-g | 2005-06-25 | U1-U4 | B2 | 123 | 36 |
| RY Sgr-g | 2005-06-25 | U1-U4 | B3 | 128 | 65 |
| RY Sgr-g | 2005-06-26 | U1-U4 | B4 | 125 | 68 |
| RY Sgr-g | 2005-05-26 | U3-U4 | B5 | 57 | 98 |
| RY Sgr-g | 2005-06-28 | U3-U4 | B6 | 62 | 110 |
| RY Sgr-g | 2005-06-26 | U3-U4 | B7 | 57 | 135 |
| RY Sgr-g | 2007-06-29 | U2 - U3 | B1 | 47 | 32 |
| RY Sgr-g | 2007-06-29 | U2 - U3 | B2 | 41 | 54 |
| RY Sgr-g | 2007-06-29 | U2 - U3 | B3 | 34 | 58 |
| RY Sgr-g | 2007-06-30 | U3 - U4 | B4 | 55 | 94 |
| RY Sgr-g | 2007-06-30 | U3 - U4 | B5 | 59 | 129 |
| V CrA-p | 2007-06-29 | U2 - U3 | B1 | 45 | 45 |
| V CrA-p | 2007-06-29 | U2 - U3 | B2 | 32 | 63 |
| V CrA-p | 2007-06-30 | U3 - U4 | B3 | 53 | 89 |
| V CrA-p | 2007-06-30 | U3 - U4 | B4 | 61 | 128 |
| V854 Cen-g | 2007-06-30 | U3 - U4 | B1 | 60 | 101 |
| V854 Cen-p | 2007-06-30 | U3 - U4 | B2 | 56 | 153 |
Results of the RY Sgr observations taken in 2005 were published by Leão et al. (2007).
| Star | Instrument/Telescope | Date |
|---|---|---|
| RYSgr | SWS/ISO | 1997-03-25 |
| V CrA | IRS/Spitzer | 2005-09-14 |
| V854 Cen | SWS/ISO | 1996-09-09 |
| V854 Cen | IRS/Spitzer | 2008-06-12 |
The sources were observed in June 2007 with the Very Large Telescope Interferometer (VLTI) MID-infrared Interferometric instrument (MIDI) (Leinert et al., 2003; Ratzka et al., 2007). The VLTI/MIDI Interferometer operates like a classical Michelson interferometer combining the mid-IR light (N band, 7.5-13.5 m) from two VLT Unit Telescopes (UTs, 8.2 m). Eleven observations were completed in June 2007 using two different telescope pairs (U2-U3 and U3-U4). A typical MIDI observing sequence was followed, as described in Ratzka et al. (2007). MIDI provided single-dish acquisition images with a spatial resolution of about 250 mas at 8.7m, flux-calibrated spectra at low and high spectral resolution (R=25, 230 respectively), and visibility curves. The spatial spectrum of the source, or visibility function, is given by the two-dimensional Fourier transform of the sky brightness. The interferometric information along a baseline is identical to the one-dimensional Fourier transform of the curve resulting from the integration of the brightness distribution in the direction perpendicular to the baseline. The observations were performed in High-Sens mode, implying that the photometry of the sources is recorded subsequent to the fringes. We used both the grism (/ = 230) and prism (/ = 25) for wavelength dispersion. See Table 1 for additional details.
The image acquisition field-of-view is 3″. A “chopped” image is produced by tilting the secondary mirror off-centre and taking an image of the sky followed by an image being taken at the centre position. This process of tilting back and forth is done rapidly several times. The resulting images are subtracted to cancel the sky background leaving an image with only the source signal. This image is used to position the sources to a predetermined pixel in order to maximise the overlap of both images for the interferometric measurements. The MIDI images have a clear Airy pattern and the full width at half maximum (FWHM) is consistent with the source being unresolved at 8.7 m, with an angular diameter 150-200 mas, given the error bars. In absence of this nodding technique the quality of the image is limited and the dynamics are restricted to about 2 to 3% of the flux at peak.
Next, the beam combiner and the dispersive device are inserted, producing two interferometric beams of opposite sign. The zero optical path difference (OPD) is searched for by scanning around the expected point of path length equalisation. Once the OPD is found the interferometric measurements start using self-fringe-tracking. A temporal fringe pattern is produced by scanning constantly at a range of OPD = 40-80 m typically in steps of 2 m.
We used two different MIDI data reduction packages: MIA developed at the Max-Planck-Institut für Astronomie and EWS developed at the Leiden Observatory (MIA+EWS111Available at http://www.strw.leidenuniv.nl/nevec/MIDI/index.html, V.1.5.1). MIDI spectra were calibrated using the stars HD152334 (K4III 3.990.07 mas), HD163376 (M0III 3.790.12 mas), HD169916 (K1III 3.750.04 mas), and HD177716 (K1III 3.720.07 mas). The accuracy of the absolute flux calibration is better than 10%. The observation log is given in Table 1.
As the photometry of individual telescopes is recorded a few minutes after the fringe recording, the fluctuations of the atmosphere affect the absolute level of the visibilities at the 8-15% level (depending on the atmospheric conditions). This is by far the worst source of error in this mode. Because the knowledge of the level of the fluctuations is lacking, it is not possible to easily decrease this error. Furthermore, the error affects all the disperser channels almost identically, and are hence highly correlated to the atmospheric error. There are also other sources of noise that affect the spectral channels independently at a level 3-5 times lower than the atmospheric error. These include the photon noise and the mismatches of the beam overlap effect. This implies that the differential information contained in the slope of the dispersed visibility curve is more tightly constrained than the absolute level. This mix of correlated and uncorrelated errors make any model fitting using the classical approach of the reduced ill-suited. However, our reduced remains an appropriate indicator of the fit at first approximation and will be used to compare several models.
Differential phase measurements are provided by MIDI and are well-suited to detect source asymmetry, however it has limitations. The phase extracted is the departure of the spectral phase compared to the expected phase of the fringes given that the OPD is known. As a differential measure, the absolute phase is not recovered in the data reduction process. Moreover, the slope of the differential phase is also removed. As a consequence, the differential phase is mostly sensitive to complex objects composed of at least two sources exhibiting very different spectral signature within the N band, or sources with large variations of the phases, such as well resolved binary sources (e.g. Ratzka et al., 2009). As such, it is particularly well suited for the study of bright stellar sources surrounded by dusty disks (e.g. Deroo et al., 2007; Ohnaka et al., 2008). We did not detect such large amplitude phase signal for the two reasons presented above, namely, the spectral changes of the differential phase induced by the presence of the clumps are too slow and strongly decreased in the reduction process and the spectral signature of the clumps do not differ significantly enough to induce a large spectral signature that would provide a definite signature. Therefore, we are not able to use the differential phases for direct proof of asymmetries in the circumstellar material around the RCB stars.
Spitzer Infrared Spectrograph (IRS) Short-low (SL) and Long-low (LL) resolution spectra of V854 Cen and V CrA were obtained from the Spitzer archive. An existing IRS spectrum of RY Sgr is heavily saturated and was not used in our analysis. The V854 Cen spectrum was obtained on 12 August 2008 and the V CrA spectrum was obtained on 14 September 2005. The spectra were re-reduced using the SMART software package as described in Furlan et al. (2006). Infrared Space Observatory (ISO) spectra taken with the Short Wavelength Spectrometer (SWS) were obtained for RY Sgr (25 March 1997) and for V854 Cen (9 September 1996) (Lambert et al., 2001). These data were obtained from the ISO archive and were re-reduced using a slightly modified version of the SWS routines developed by Sloan et al. (2003). A low S/N ISO spectrum of V CrA is present in the archive but was not used in our analysis. An observation log of the ISO and Spitzer spectra is found in Table 2. Light curves using the American Association of Variable Star Observers (AAVSO) and All Sky Automated Survey (ASAS) photometry for the three RCB stars are presented in §5.


3 Modelling of the dusty environments
| Star | Model | Flux PS | Flux Shell/Disk | FWHMa | Diam Diskb | Flux Cluster | Sep of Cluster | P.A.c | ||
| (epoch) | (%) | (%) | (mas) | (mas) | (%) | (mas) | (∘) | |||
| RY Sgr (2005) | PS + UD | 1.7 | 0.21 | 0.79 | - | 33 | - | - | - | |
| RY Sgr (2005) | PS + G + C | 0.31 | 0.11 | 0.8 | 18 | - | 0.09 | 15 | 79 | |
| RY Sgr (2005) | PS + EUD | 1.1 | 0.2 | 0.8 | - | 18, 13 | - | - | 79 | |
| RY Sgr (2007) | PS + G | 14 | 0.05 | 0.95 | 36 | - | - | - | - | |
| RY Sgr (2007) | PS + UD | 12 | 0.17 | 0.83 | - | 46 | - | - | - | |
| RY Sgr (2007) | PS + G + C | 1.3 | 0.15 | 0.74 | 37 | - | 0.11 | 25 | 175 | |
| RY Sgr (2007) | PS + UD + C | 1.8 | 0.19 | 0.63 | - | 58 | 0.18 | 23 | 172 | |
| RY Sgr (2007) | PS + EUD | 2.7 | 0.17 | 0.83 | - | 36, 19 | - | - | 178 | |
| V CrA | PS + G | 0.81 | 0.56 | 0.44 | 46 | - | - | - | - | |
| V CrA | PS + UD | 0.73 | 0.60 | 0.4 | - | 70 | - | - | - | |
| V CrA | PS + G + C | 0.26 | 0.55 | 0.4 | 45 | - | 0.05 | 84 | 16 | |
| V CrA | PS + UD + C | 0.27 | 0.61 | 0.34 | - | 76 | 0.05 | 100 | 9 | |
| V CrA | PS + EUD (a)d | 0.41 | 0.58 | 0.42 | - | 180, 52 | - | - | 166 | |
| V CrA | PS + EUD (b)d | 0.61 | 0.59 | 0.41 | - | 96, 63 | - | - | 177 | |
| V854 Cen | PS + G | 0.58 | 0.16 | 0.84 | 24 | - | - | - | - | |
| V854 Cen | PS + G + C | 0.8 | 0.3 | 0.6 | 24 | - | 0.1 | 33 | 40 |
aFWHM of Gaussian Shell
b Diameter of UD or major axis, minor axis of EUD
cP.A. of cluster or orientation of EUD
dTwo PS + EUD models for V CrA with different major and minor axes that produce similar results
Extensive modeling is needed to understand the RCB star environments. Model parameters can be better constrained if many observations across the uv-plane are obtained. Observations were taken across different baselines and position angles (PA) for each star as seen in Figure 1 and a few visibility measurements for each object were obtained.
Two approaches are used in order to model the data. First, following the approach published by Leão et al. (2007), we use several geometric models to account for the dispersed visibilities, first obtaining a monochromatic fit and then seeking for wavelength dependent (chromatic) solution. The geometrical models provide information on departure from spherical symmetry in the circumstellar environment. Second, we use the 1D radiative transfer code, DUSTY, a public-domain simulation code that models radiation transport in a circumstellar dusty environment. DUSTY analytically integrates the radiative-transfer equation in plane-parallel or spherical geometries (Ivezic et al., 1999; Ivezic & Elitzur, 1997). DUSTY provides a realistic view of the source, as it uses both the dispersed visibilities and the spectral energy distribution (SED) of the source. However, DUSTY does not provide any information on departure from spherical symmetry.
The two modelling approaches are complementary, provided that one insures broad agreement in the areas of overlap. For our models, described in detail in §4, this agreement is sought between the geometrical and DUSTY models of the shells only.
| Input Parameters | Output Results | |||||||||||
| Star | a | b | c | D | L | E(B-V) | d | e | f | |||
| () | () | () | () | () | (), () | (), () | ||||||
| RY Sgr 2005 | 7250 | 3.3 | 900 | 1.2 | 50 | 1800 | 8700 | 0.02 | 59 | 7, 48 | 13, 79 | 1.9 |
| RY Sgr 2007 | 7250 | 2.7 | 1000 | 1.0 | 50 | 1800 | 8700 | 0.02 | 59 | 9, 57 | 17, 108 | 0.6 |
| V CrA | 6250 | 1.7 | 1000 | 1.5 | 30 | 5200 | 4500 | 0.12 | 57 | 2, 41 | 5, 100 | 1.3 |
| V854 Cen | 6750 | 2.7 | 1075 | 0.45 | 50 | 2100 | 8200 | 0 | 66 | 6, 38 | 11, 71 | 4.3 |
aDust density is ; bTdust at Rinner; c Shell thickness in multiples of Rinner;
dShell inner radius; eHWHM of the DUSTY geometrical Gaussian fit at 9 m; fReduced of visibility fits for a subset of baselines only (see text, §4).
3.1 Geometrical Fitting
If the circumstellar material is spherically symmetric each sampling with baselines of similar projected length, but different PA will produce the same visibility curve. However, the data shows that this is not the case despite the limited number of baselines considered, particularly in the case of RY Sgr. Therefore, models are used to interpret the visibility curves and determine the possible geometry of the circumstellar material. In our geometrical models we consider different combinations of the following structures: a central point source representing the star, a Gaussian shell of dust around the star (i.e. a circular structure with a Gaussian light distribution), a circular, uniform dusty disk around the star, an non-centrosymmetric, elliptical dusty disk around the star (because of the simplicity of our models this could represent either a circular disk observed at an angle of inclination or an actual elliptical disk observed face on), and a second point source representing a dust “cluster” near the star. Typically, RCB stars are not thought to have homogenous dust shells, so in our models a “shell” represents an approximate spherical distribution of clumps that are individually unresolved. The physical interpretation of the second point source (the cluster) is an estimate for the level of asymmetry in the distribution of dust clumps surrounding the RCB star. As our data were collected with telescope pairs, closure phase information was not obtained and therefore there is an ambiguity of 180∘in the position of the cluster.
If one obtains observations that employ only short VLTI baselines, the uv-plane coverage is limited. Therefore, the fits from our geometric models are only indicative of what may be surrounding the RCB star, as the models are not unique. Nevertheless, the extent of model degeneracy was tested by extensive exploration of parameter space.
At the start of our fitting procedure, we neglect any variation of the morphology as a function of wavelength. Every combination of structures modelled results in a set of monochromatic visibility curves. This approach gives us a basic understanding of the global morphology of the object. The value of the reduced 2 is minimised for all the baselines. Only the errors in the mean visibility level are considered. The parameters of the monochromatic models are listed in Table 3 and results displayed in Figures 2a, 5, and 7.
Because the differential information contained in the slope of the dispersed visibility is more tightly constrained than the absolute level (see §2), our analysis relies heavily on the shapes of the dispersed visibility curves rather than the absolute level of the visibility curves. Therefore it is not surprising that we obtain some reduced values less than 1 for our models. In this context, a reduced value of 0.2 remains better than a reduced value of 0.8 for the same model, as it means that the dust shell density distribution is better accounted for.
Next, a chromatic analysis of visibilities across all wavelengths is performed. The separation of the cluster from the star and its PA is assumed to be the same at all wavelengths. However, the FWHM of the shell and the flux of all components are wavelength dependent and are therefore adjusted to fit wavelength-dependent visibility curves. Results of the chromatic fits for RY Sgr are displayed in Figures 2b and 2c. Fits were also completed for V854 Cen and V CrA, but are not presented in this paper as they did not provide adequate information. Specific results of the geometrical fitting for each RCB star are presented in §4.
3.2 DUSTY Fitting
DUSTY utilises the self-similarity and scaling relations of the radiatively-heated dust, e.g. the shell is uniquely characterised by its optical depth. This means that absolute values (synthetic surface brightness, flux, and visibility) are not uniquely determined by the transfer problem and must be inferred by external constraints - in our case the stellar luminosity and distance.
DUSTY requires seven main input parameters: the temperature of the central star, the chemical composition of the dust grains, the grain size distribution, the density distribution of the dust, the temperature of the dust at the inner radius, the overall radial optical depth at a given wavelength, and the thickness of the dust shell. DUSTY’s outputs consist of a detailed SED, the detailed surface brightness at our specified wavelengths (8 - 13 m), tables of the radial profiles of density, optical depth and dust temperature, and visibility as a function of the spatial frequency for the specified wavelengths. The synthetic visibility profiles throughout the N-band (7.5 - 13 m) are generated using a set of 15 wavelengths. These are compared with the observed MIDI visibilities for each baseline.
Because DUSTY is a 1D radiative transfer code it is unable to model non-spherically symmetric, non-homogenous (clumpy) structures. As a result, the observed visibility curves that present evidence for asymmetric geometric structures cannot be reproduced accurately by the DUSTY models. On the other hand, since radiative transfer is taken into account, DUSTY can model the characteristics of the circumstellar dust (such as producing an SED) in ways that the geometric models cannot. The input parameters for the DUSTY models are given below:
- •
- •
- •
-
•
Inside the shell, the density follows an distribution as in a steady-state wind with constant velocity. The power exponent, , was the easiest parameter to constrain and as such was normally the first parameter chosen when fitting the SED and visibility curves. A larger value causes most of the dust grains to concentrate near the inner radius (). When grains are concentrated near they absorb a lot of photons causing a “screen” to form (this is especially apparent with smaller grains which absorb more efficiently). The extent of this screen dramatically affects the slope of the visibility curve. Therefore, a larger value of typically yields a steeper slope in the modelled visibility curves.
-
•
The temperature of the dust at the inner rim of the shell () is chosen individually for each star and mainly constrained by the SED. A higher temperature chosen here causes a larger infrared emission.
-
•
The optical depth, , is chosen so as to match the V-band (0.55 m) photometric measurement of the star. Like , a higher causes more flux in the infrared.
-
•
The thickness of the dust shell () is constrained mainly by the visibility curve but does not have a large effect. Once a certain thickness is reached the output visibility curves do not change noticeably until a thickness ratio of 90-100 is reached, at which point the object becomes over-resolved. Therefore, the smallest shell thickness that gives the best result is chosen, but this parameter is poorly constrained.
In order to ease the comparison between the shell produced by DUSTY models and those produced by the geometrical models a Gaussian curve is fit to the 1D collapsed intensity distributions of the best DUSTY model at a chosen wavelength (9 m). The half width at half maximum (HWHM) of the DUSTY Gaussian fit (from here on called ) is used as the distance to the shell in our analysis to make comparison easier.
As discussed, DUSTY does not take into account the distance nor the luminosity of the star, so the user must scale DUSTY results to specific stars. The distances are calculated from the MV, AV, and V values in Table 4 and the luminosity inputs are kept within the range of RCB stars with these parameters. The results are also corrected for the standard CCM reddening law (Cardelli et al., 1989) using an input of , where =AV/3.1. The scaling process results in a stellar radius and inner shell radius in physical units. The inputs and outputs, including the reduced , are displayed in Table 5. Specific results of the DUSTY fitting for individual stars are discussed in §4.
4 Results
4.1 RY Sgr


4.1.1 Geometrical Fitting
Using the geometrical models described in §3.1 we find that the best monochromatic model (with the lowest reduced ) for the RY Sgr 2007 dataset is a combination of a central star, a Gaussian dust shell and a dust cluster (see Figure 2a).
A significant wavelength dependence of the model parameters was found for the 2007 dataset (see Figure 2c). The FWHM of the envelope grows with increasing wavelength and is accompanied by a flux increase of both the star and cluster. Such a behaviour is counter-intuitive. In depth investigations of the degeneracy between the flux and size parameters were performed by first, forcing the flux of the envelope to increase with wavelength and second, by allowing the cluster position to be free. After a large exploration of the parameter space, a good parameter set was not found. Next, a more simple geometrical model, involving a stellar unresolved source and a Gaussian dust shell, was tested. In this case, the flux of the envelope increased with wavelength, but the fit was not satisfactory (reduced =12). To summarise, the strongly suspected asymmetries in the 2007 data can be ascribed, at first order, by the presence of a cluster, however the model has some problems. “Clusters” introduce a spectrally dependent sinusoidal pattern in the dispersed visibility curves which is only partially probed by our limited dataset.
There is a difference in behaviour between the 8-9 and 9-12 m spectral regions that may reflect different opacity regimes, with a decreasing opacity at larger wavelength explaining the higher star and cluster relative fluxes and also an increase of the contribution of the cooler and more extended parts of the envelope.
4.1.2 DUSTY Fitting
DUSTY can only account for the broad characteristics of the dust shell, and is unable to provide any information on asymmetries detected. In 2005, the longer baselines (B1, B2, B3, B4) probe the smaller structures (i.e. closer to the star) and show strong evidence of a cluster. Therefore, these baselines can not be accurately fit with DUSTY. In contrast, the short baselines (B5, B6, B7) should detect the symmetrical Gaussian shell and can theoretically be fit with DUSTY. However, a departure from symmetry is clearly seen when comparing B5 and B7. Both baselines share the same length, but have different PAs. Of course, if the circumstellar material was spherically symmetric these measurements would produce the same visibility, but B7 has a significantly higher visibility than B5. This implies that an asymmetry also exists at larger scales around the star (see Leão et al., 2007). As a result, the reduced values for the RY Sgr (2005) DUSTY fits (presented in Table 5) are calculated from only the B5 and B6 visibility curves.
In 2007 only short baseline observations were obtained. These can be fit relatively well with DUSTY, although B4 and B5 show a hint of asymmetry (the reduced values for DUSTY fits are based only on the visibility curves of the 3 shortest baselines). This agrees with the asymmetry found with the geometrical models. It is interesting to note that the position of the cluster inferred with good confidence in 2005, and the other suspected in 2007 both lie close to the dust shell inner rim inferred from the DUSTY modeling. DUSTY places the dust shell (RDUSTY) at 13 mas in 2005 and 17 mas in 2007. These values are the same, within the uncertainties, as the dust shell inner rim found with the geometrical models ( 9 mas in 2005 and 18 mas in 2007).
4.2 V CrA


4.2.1 Geometrical Fitting
Similar to RY Sgr, the geometrical models for V CrA reveal that the visibility curve of this source is best fit by a combination of a central star, a shell, and a dust cluster (see Figure 5). We find the separation of the cluster and the star to be 84 mas (437 AU, using a distance of 5200 pc) and the PA of the cluster to be 16∘. The radius of the Gaussian shell is 22 mas. This places the cluster about 4 times farther away than the shell’s radius. In addition, the dust cluster has a flux of only 5% of the total system flux. However, all the geometrical models for V CrA provide a similar reduced . Therefore the inclusion of a cluster is not clearly justified by the data.
4.2.2 DUSTY Fitting
Good DUSTY fits for V CrA were produced for the SED and four visibility curves. The consistency between the visibility curves and the SED suggest that the large estimated distance to V CrA (5200 pc) is appropriate. The consistency may also suggest that a spherical shell surrounding the star may be an appropriate model for V CrA. However, because V CrA is so far away, it is not the best object to detect asymmetries in the circumstellar environment. The general shape of the target can be seen, but the inner circumstellar regions where asymmetries are more likely to be found cannot be resolved.
DUSTY places the dust shell (RDUSTY) at 5 mas. Unlike RY Sgr, this is significantly smaller than the inner rim predicted by the geometrical models for V CrA ( 20 mas). The DUSTY fits to the V CrA data are found in Figure 6.
4.3 V854 Cen
4.3.1 Geometrical Fitting
For V854Cen only two baselines were obtained. As a result the geometrical fits are highly degenerate. In addition, because the baselines obtained are short, they only probe the larger scale structure, or larger shell portion of V854 Cen. Therefore, we used only the two most basic models, a Gaussian shell, and a Gaussian shell plus cluster to fit the 2 baselines (see Table 3). However, the visibility curves for the two fits are too similar to determine if there is any asymmetry. We therefore only use the Gaussian shell fit for our analysis (see Figure 7). This places the FWHM of the Gaussian shell at 24 mas with a flux comprising of 84% of the total system.
4.3.2 DUSTY Fitting
Good DUSTY fits for V854 Cen are obtained for the 2 baselines, and asymmetries are not implied from the fits obtained. But at 8 m and 11.5 m an emission feature is seen in both the SED and the visibilities that causes the model to deviate from the observations. These features are discussed in more detail in §5.
DUSTY places the dust shell at 11 mas (RDUSTY). This is similar to the inner rim predicted by the geometrical models for V854 Cen (12 mas). The DUSTY fits to the V854 Cen data are found in Figure 8.


5 Discussion
5.1 Dust Formation Frequency
Our observations, in combination with optical light curves, may shed light on the frequency and location of dust formation in RCB stars. Current knowledge suggests that dust forms in clumps at discrete locations around RCB stars and a visible light decline will be observed if a clump is ejected in the line of sight. Therefore, declines in the lightcurve will not necessarily correspond to structure observed by the VLTI. Furthermore, if a clump is ejected towards us, causing a decline in the visual light curve, it is unlikely to be detected by the VLTI. Conversely, a clump that is easily detected by the VLTI is likely to be one that was not ejected towards us and therefore did not produce a lightcurve decline. On the other hand, RCB stars are known to undergo periods of inactivity, where the star is at maximum light sometimes for years, and periods of strong activity when the star is constantly declining and recovering (Clayton, 1996). Because of this, we presume that the clusters we resolve were likely produced during a period of high dust production activity that also resulted in light declines.
Using the distance to each of our RCB stars and their stellar radii, as well as an average dust outflow velocity of 300 km/s, we estimate the time it takes a dust clump to reach the observed dusty shell (RDUSTY, see §3.2) after initial ejection, assuming the dust forms at 2 (Clayton et al., 1992; Clayton et al., 2003). As discussed in §3.1, the geometrical cluster represents a break from symmetry in the distribution of dust clumps of the shell, but does not necessarily indicate the position of a particular clump. Therefore, we use the simplistic RDUSTY as the distance for an individual clump to travel for our analysis. We also assume that all the dust leaves the star in the plane of the sky; therefore this estimated time-scale is actually a lower limit. Table 6 lists RDUSTY, and a lower limit of the time it takes the dust to reach RDUSTY for each of our RCB stars.
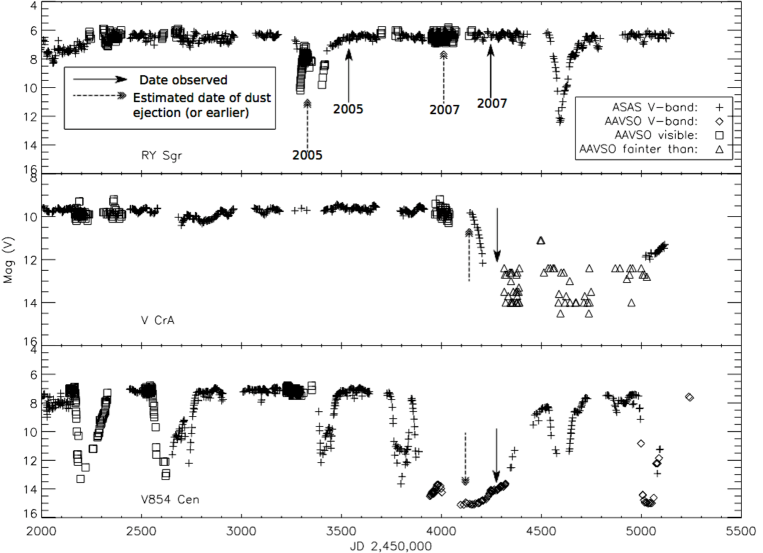
V-band light curves of our RCB stars are plotted in Figure 9 using data from ASAS-3 (Pojmanski, 2002) and the AAVSO. The 2005 and 2007 VLTI observations of RY Sgr were obtained on JD 2453550 and JD 2454275. Dust was observed at 13 mas and 17 mas (24 AU and 31 AU, see Table 5) in 2005 and 2007, respectively. It will take a minimum of 5 and 7 months for the dust to reach these distances. Five months prior to the 2005 VLTI observation, when the dust was expected to be ejected, there is a decline in the light curve (JD 2453330). However, seven months prior to observation of RY Sgr in 2007 (JD 2454065), when the dust was expected to be ejected in 2007, there is not a visual decline. There are no declines during the period of JD 2453550 - 2454500.
Dust was observed at 5 mas (1 AU) around V CrA in 2007. It would take at least 5 months from ejection to reach this distance. Looking at the light curve five months prior to our observation (JD 2454130), V CrA is just beginning a visual decline after a long period of inactivity (at least 7 years). While the light curve shows relative inactivity prior to this time (especially compared to V854 Cen) V CrA still has significant IR emission. This could be an indication that dust around V CrA is actively forming in a plane that is not in our line of sight.
Dust was observed at 11 mas (5 AU) around V854 Cen in 2007. It would take at least 5 months from ejection to reach this distance. Five months prior to our observation (JD 2454130), V854 Cen is in the middle of an extremely active dust production period, such that the observed dust cluster is likely to be related to those that are obscuring our line of sight.
Without additional epochs of VLTI observations of these RCB stars, covering a significant time period, it is difficult to reconstruct the dust production frequency and history of these objects. But it is clear from our analysis that observations such as these, taken over time, combined with IR and visible brightness variations, could allow us to determine the time and location of dust production in these objects.
5.2 Dust Mass
MOCASSIN, a 3D Monte Carlo code (Ercolano et al., 2005), was used to model the radiative transfer in the shells surrounding our three RCB stars, resulting in fits to the three MIDI SEDs. (Note that the RY Sgr MIDI 2005 and 2007 data were identical within 5%, so only the 2007 data is used in this paper.) The same input parameters were used as in the DUSTY fits listed in Table 5. Using MOCASSIN we find that the dust shells have an average mass of 4 10-7 M☉. Clayton et al. (1992) estimated that a single ejected clump has a mass of 10-8 M⊙. Therefore, using a simplified calculation, we find that for each shell to grow in mass to 4 10-7 M☉ it has to contain approximately 40 individual clumps. The time it takes to accumulate this amount of mass may be estimated by using the pulsational period of the RCB stars.
The onset of dust formation has been found to be correlated with the pulsational phase in five RCB stars, including RY Sgr and V854 Cen (Crause et al., 2007; Lawson et al., 1999; Pugach, 1977). RCB stars pulsation amplitudes are at most a few tenths of a magnitude and their periods are 40-100 d (Lawson & Cottrell, 1997; Lawson et al., 1990). If one clump is ejected every pulsation period (or roughly every 50 days) it will take 5 years to build a shell with the typical observed masses. If the dust expands at 300 km/s, a clump will be at 800 from the star after five years, which is well within the highly unconstrained, outer shell radius estimated by DUSTY, 3000 (assuming, as before, RDUSTY = 10 mas, and a distance of 2000 pc). Table 6 contains specific calculations for our RCB stars, including the pulsation period for each star, the mass of its shell, and the number of clumps within the shell.
5.3 Dust Geometry
Looking at our DUSTY results in connection with the light curves, the time it takes for ejected dust to travel to RDUSTY (see Table 6), and the dust shell mass, we find that, overall, our observations are consistent with dust forming in clumps ejected randomly around the star so that over time they may create a spherically symmetric distribution of dust. But we also must look to our geometrical models to determine if there is an overall preferential dust ejection axis or plane.
The geometrical fits (see §4 and Table 3) show evidence for asymmetry in the dust geometry around at least one of our RCB stars. Looking at the visibility curves (Figure 2a, 5, 7), asymmetric structure is apparent in RY Sgr, may also exist in V CrA, and is possible for V854 Cen but is not constrained at present (see §3). Our geometrical models provide a position angle (PA) of the asymmetric distribution of dust (or cluster) and by observing these objects over time, we can learn whether there is a preferential dust ejection axis or plane. Although the geometrical models only give the simplistic version of one large “cluster”, this represents an overall asymmetry found in the production of dust.
Only RY Sgr has more than one epoch of data and asymmetries are detected in both 2005 and 2007. The RY Sgr 2005 model has an asymmetry placed at a PA of 79∘ and in 2007 the PA of the asymmetry is at 175∘, approximately 90∘ from the 2005 epoch. It is important to note that although the geometrical model, comprised of a star, a Gaussian shell and a cluster, gives us the lowest reduced value, the same PAs are also found if an elliptical uniform disk is used implying there is indeed some sort of asymmetry in this direction. However, the determination of whether there is an overall preferential plane will have to wait until a time series of observations are obtained that measure the location of several “clusters” over time.
According to the DUSTY models, RY Sgr, V CrA and V854 Cen all have dust shells with approximately the same RDUSTY despite other differences. This distance may be a common characteristic between RCB stars or it may be a bias of the simplistic DUSTY approach to modelling these complex stars. An insight to this question will require more data and investigation.
5.4 Large Scale Dust Distribution and Composition
MIDI spectra were obtained subsequently to the interferometric data. These spectra correspond to the flux from the central 250 mas of the sources. In addition to the MIDI spectra, ISO/SWS spectra exist for RY Sgr and V854 Cen and Spitzer/IRS data exist for V CrA and V854 Cen. ISO/SWS records flux through a slit with an aperture of 14″ x 20″ (Sloan et al., 2003) and Spitzer/IRS SL spectra were taken through a 3″ wide slit with very long length (Houck et al., 2004). By comparing these spectra, we can determine where the majority of the flux is coming from. For RY Sgr the 2007 MIDI spectra is 20% fainter than the 1997 ISO/SWS spectra (the RY Sgr MIDI 2005 and 2007 data were identical within 5% so only the 2007 data is used in this paper). For V CrA the 2007 MIDI spectra is 30% brighter than the 2005 Spitzer/IRS spectra. These changes are within the expected error bars for the respective instruments (e.g. MIDI spectra can change by 10 - 15% within a few minutes depending on fluctuations in the atmosphere (Chesneau, 2007). In addition, the flux from the stars will have varied by an unknown amount between the ISO, Spitzer, and MIDI epochs. Taking this into consideration we determine that the majority of the flux is coming from the inner 250 mas of the source for both RY Sgr and V CrA. On the other hand, for V854 Cen the the 2008 Spitzer/IRS spectra is 55% brighter than the 2007 MIDI spectra and the 1996 ISO/SWS spectra is 165% brighter than the 2007 MIDI spectra). These higher percentages cannot be accounted for by uncertainties or normal variability. This implies that there is a significant amount of circumstellar material outside of the region observed with MIDI, possibly in another outer shell. V854 Cen is known to have a 5″ circumstellar nebula at UV and mid-IR wavelengths (Clayton & Ayres, 2001; Lagadec, 2010). The comparisons of all spectra obtained for the RCB stars are shown in Figure 10.

Generally RCB stars, including R CrB and RY Sgr, show no features in the mid-IR (Lambert et al., 2001; Kraemer et al., 2005). The exception is V854 Cen which shows polycyclic aromatic hydrocarbons (PAH)-like emission features (Lambert et al., 2001; García-Hernández et al., 2010). Our MIDI spectra for RY Sgr and V CrA appear to be featureless, but the spectrum of V854 Cen show emission features from 8 m and at 11.5 m. These features may be due to hydrogenated amorphous carbon (HAC), C60, or PAHs (Evans et al., 2011; García-Hernández et al., 2010; Clayton et al., 1995). RCB stars are known to have variable emission features and C60 may be present only for a short time after initial decline when carbon gas is condensing into dust (Whitney et al., 1993; Goeres & Sedlmayr, 1992). These emission features have an impact on V854 Cen’s visibility curves (Figure 7) which exhibit a drop at the features’ wavelengths. The dust responsible for the features is over-resolved, i.e., more extended. In other words, dust associated with the emission feature is blocking light from the central unresolved source and the total visibility is lower than the model at 8 m by 21. This drop is proportional to the amount of extra flux that the feature contributes to the SED (23) at 8 m. A smaller drop in visibility and excess in the SED is also noticed at 11.5 m.
Our observations with the VLTI have shed light on both the large and small scale structure and composition of RCB stars. The large extended shell and emission features found for V854 Cen are atypical for RCB stars and need to be investigated further. In addition, RY Sgr’s visibility curves, in both 2005 and 2007, may reveal a slight drop at 8-9 m, but is not as evident as the drop for V854 Cen. This hints at the ability of high-angular resolution observations to detect chemical structure that cannot be revealed by spectrometry.
5.5 Dust Grain Size
Standard MRN dust distribution (Mathis et al., 1977) uses = 0.005 m and =0.1 m for graphite. However in our models larger grains of = 2 m are needed in order to accurately fit both the SED and the visibility curves. Tests were also performed to see how only large grains ( = 0.2 m and = 2.0 m) would affect the DUSTY fitting. Using = 0.005 m, and = 2 m provided the best results. While we could achieve adequate fits using only large grains (= 0.2 m and =2 m), the slopes of the visibility curves could not be matched as accurately for RY Sgr and V854 Cen without smaller grains. Without the smaller grains the screening effect (discussed in §3.2) cannot occur. Additionally, using only larger grains caused to decrease by a factor of two due to the efficiency of heat absorption. Such a strong dependence of on the dust grain size leaves this parameter poorly constrained. It is unclear what the larger dust grains mean in physical terms. It is unlikely that the dust grains are actually this large. DUSTY may be requiring large dust grains because there is a heavy level of asymmetry which it cannot account for. More tests need to be done to test all the effects that changing grain size has on DUSTY fits of RCB stars.
5.6 Future Observations
MIDI’s spatial resolution is about 10 mas. This resolution is not sufficient to accurately detect and measure the dust forming regions of RCB stars. However, the Astronomical Multiple BEam combineR (AMBER), a VLTI instrument which observes in the near-IR, has a spatial resolution of 1 to 2 mas (Wittkowski, 2007). This resolution would be enough to directly measure the inner regions of the circumstellar envelope and track the change in location of individual dust clumps. To do so, frequent observations are needed (at least a monthly cadence) using the same set of baselines, and PAs to guarantee that the same dust cluster or clump is tracked. Although such an observational campaign would require a significant telescope time allocation, the return would be justified: RCB stars are among a few classes of merged objects. In addition, it is likely that the short RCB phase may guarantee that the merger has just taken place. Studying a merger aftermath environment will lead to tremendous insight into the physics of the merger, with possible insight into Type Ia supernova detonation and gravitational wave physics.
Acknowledgements
We acknowledge with thanks the variable star observations from the AAVSO International Database contributed by observers worldwide and used in this research. The research leading to these results received funding from the European Community’s Seventh Framework Programme under Grant Agreement 226604 and from a Macquarie University Research Excellence Scholarship (SNB). We also wish to thank the anonymous referee for their valuable comments and suggestions.
References
- Alcock et al. (2001) Alcock C., et al., 2001, ApJ, 554, 298
- Asplund et al. (1998) Asplund M., Gustafsson B., Kameswara Rao N., Lambert D. L., 1998, A&A, 332, 651
- Asplund et al. (2000) Asplund M., Gustafsson B., Lambert D. L., Rao N. K., 2000, A&A, 353, 287
- Cardelli et al. (1989) Cardelli J. A., Clayton G. C., Mathis J. S., 1989, ApJ, 345, 245
- Chesneau (2007) Chesneau O., 2007, New Astronomy Review, 51, 666
- Clayton (1996) Clayton G. C., 1996, PASP, 108, 225
- Clayton (2010) Clayton G. C., , 2010, personal communication
- Clayton & Ayres (2001) Clayton G. C., Ayres T. R., 2001, ApJ, 560, 986
- Clayton et al. (1997) Clayton G. C., Bjorkman K. S., Nordsieck K. H., Zellner N. E. B., Schulte-Ladbeck R. E., 1997, ApJ, 476, 870
- Clayton et al. (2003) Clayton G. C., Geballe T. R., Bianchi L., 2003, ApJ, 595, 412
- Clayton et al. (2007) Clayton G. C., Geballe T. R., Herwig F., Fryer C., Asplund M., 2007, ApJ, 662, 1220
- Clayton et al. (2005) Clayton G. C., Herwig F., Geballe T. R., Asplund M., Tenenbaum E. D., Engelbracht C. W., Gordon K. D., 2005, ApJL, 623, L141
- Clayton et al. (1995) Clayton G. C., Kelly D. M., Lacy J. H., Little-Marenin I. R., Feldman P. A., Bernath P. F., 1995, AJ, 109, 2096
- Clayton et al. (1999) Clayton G. C., Kerber F., Gordon K. D., Lawson W. A., Wolff M. J., Pollacco D. L., Furlan E., 1999, ApJL, 517, L143
- Clayton et al. (1992) Clayton G. C., Whitney B. A., Stanford S. A., Drilling J. S., 1992, ApJ, 397, 652
- Crause et al. (2007) Crause L. A., Lawson W. A., Henden A. A., 2007, MNRAS, 375, 301
- de Laverny & Mékarnia (2004) de Laverny P., Mékarnia D., 2004, A&A, 428, L13
- Deroo et al. (2007) Deroo P., van Winckel H., Verhoelst T., Min M., Reyniers M., Waters L. B. F. M., 2007, A&A, 467, 1093
- Ercolano et al. (2005) Ercolano B., Barlow M. J., Storey P. J., 2005, MNRAS, 362, 1038
- Evans et al. (2011) Evans A., et al., 2011, in preparation
- Feast (1986) Feast M. W., 1986, in K. Hunger, D. Schoenberner, & N. Kameswara Rao ed., IAU Colloq. 87: Hydrogen Deficient Stars and Related Objects Vol. 128 of Astrophysics and Space Science Library, The RCB stars and their circumstellar material. p. 151
- Feast et al. (1997) Feast M. W., Carter B. S., Roberts G., Marang F., Catchpole R. M., 1997, MNRAS, 285, 317
- Fujimoto (1977) Fujimoto M. Y., 1977, PASJ, 29, 331
- Furlan et al. (2006) Furlan E., Hartmann L., Calvet N., D’Alessio P., Franco-Hernández R., Forrest W. J., Watson D. M., Uchida K. I., Sargent B., Green J. D., Keller L. D., Herter T. L., 2006, ApJ Supp., 165, 568
- García-Hernández et al. (2010) García-Hernández D. A., Lambert D. L., Kameswara Rao N., Hinkle K. H., Eriksson K., 2010, ApJ, 714, 144
- Geballe et al. (2002) Geballe T. R., Evans A., Smalley B., Tyne V. H., Eyres S. P. S., 2002, APSS, 279, 39
- Gillett et al. (1986) Gillett F. C., Backman D. E., Beichman C., Neugebauer G., 1986, ApJ, 310, 842
- Goeres & Sedlmayr (1992) Goeres A., Sedlmayr E., 1992, A&A, 265, 216
- Hanner (1988) Hanner M., 1988, ioch.rept, 22
- Houck et al. (2004) Houck J. R., et al., 2004, ApJS, 154, 18
- Iben et al. (1996) Iben Jr. I., Tutukov A. V., Yungelson L. R., 1996, ApJ, 456, 750
- Ivezic & Elitzur (1997) Ivezic Z., Elitzur M., 1997, MNRAS, 287, 799
- Ivezic et al. (1999) Ivezic Z., Nenkova M., Elitzur M., 1999, arXiv:astro-ph/9910475
- Kraemer et al. (2005) Kraemer K. E., Sloan G. C., Wood P. R., Price S. D., Egan M. P., 2005, ApJL, 631, L147
- Lagadec (2010) Lagadec E., , 2010, personal communication
- Lambert et al. (2001) Lambert D. L., Rao N. K., Pandey G., Ivans I. I., 2001, ApJ, 555, 925
- Lawson & Cottrell (1997) Lawson W. A., Cottrell P. L., 1997, MNRAS, 285, 266
- Lawson et al. (1990) Lawson W. A., Cottrell P. L., Kilmartin P. M., Gilmore A. C., 1990, MNRAS, 247, 91
- Lawson et al. (1999) Lawson W. A., Maldoni M. M., Clayton G. C., Valencic L., Jones A. F., Kilkenny D., van Wyk F., Roberts G., Marang F., 1999, AJ, 117, 3007
- Leão et al. (2007) Leão I. C., de Laverny P., Chesneau O., Mékarnia D., de Medeiros J. R., 2007, A&A, 466, L1
- Leinert et al. (2003) Leinert C., et al., 2003, Ap&SS, 286, 73
- Mathis et al. (1977) Mathis J. S., Rumpl W., Nordsieck K. H., 1977, ApJ, 217, 425
- Ohnaka et al. (2003) Ohnaka K., Beckmann U., Berger J.-P., Brewer M. K., Hofmann K.-H., Lacasse M. G., Malanushenko V., Millan-Gabet R., Monnier J. D., Pedretti E., Schertl D., Schloerb F. P., Shenavrin V. I., Traub W. A., Weigelt G., Yudin B. F., 2003, A&A, 408, 553
- Ohnaka et al. (2008) Ohnaka K., Izumiura H., Leinert C., Driebe T., Weigelt G., Wittkowski M., 2008, A&A, 490, 173
- Pojmanski (2002) Pojmanski G., 2002, Acta Astronomica, 52, 397
- Pugach (1977) Pugach A. F., 1977, Information Bulletin on Variable Stars, 1277, 1
- Ratzka et al. (2007) Ratzka T., Leinert C., Henning T., Bouwman J., Dullemond C. P., Jaffe W., 2007, A&A, 471, 173
- Ratzka et al. (2009) Ratzka T., et al., 2009, A&A, 502, 623
- Renzini (1979) Renzini A., 1979, in B. E. Westerlund ed., Stars and star systems Vol. 75 of Astrophysics and Space Science Library, Mass loss and stellar evolution. pp 155–171
- Saio & Jeffery (2002) Saio H., Jeffery C. S., 2002, MNRAS, 333, 121
- Sloan et al. (2003) Sloan G. C., Kraemer K. E., Price S. D., Shipman R. F., 2003, ApJ Supp., 147, 379
- Tisserand et al. (2009) Tisserand P., et al., 2009, A&A, 501, 985
- Walker (1985) Walker H. J., 1985, A&A, 152, 58
- Walker (1986) Walker H. J., 1986, in K. Hunger, D. Schoenberner, & N. Kameswara Rao ed., IAU Colloq. 87: Hydrogen Deficient Stars and Related Objects Vol. 128 of Astrophysics and Space Science Library, IRAS results for hydrogen deficient stars. p. 407
- Webbink (1984) Webbink R. F., 1984, ApJ, 277, 355
- Whitney et al. (1993) Whitney B. A., Balm S. P., Clayton G. C., 1993, in Sasselov D. D., ed., Luminous High-Latitude Stars Vol. 45 of Astronomical Society of the Pacific Conference Series, Dust Formation in R-Coronae Stars. p. 115
- Wittkowski (2007) Wittkowski M., 2007, New Astronomy Review, 51, 639
- Woitke et al. (1996) Woitke P., Goeres A., Sedlmayr E., 1996, A&A, 313, 217