Self-organization in social tagging systems
Abstract
Individuals often imitate each other to fall into the typical group, leading to a self-organized state of typical behaviors in a community. In this paper, we model self-organization in social tagging systems and illustrate the underlying interaction and dynamics. Specifically, we introduce a model in which individuals adjust their own tagging tendency to imitate the average tagging tendency. We found that when users are of low confidence, they tend to imitate others and lead to a self-organized state with active tagging. On the other hand, when users are of high confidence and are stubborn for changes, tagging becomes inactive. We observe a phase transition at a critical level of user confidence when the system changes from one regime to the other. The distributions of post length obtained from the model are compared to real data which show good agreements.
pacs:
89.65.-s, 89.20.Hh, 05.65.+bI Introduction
Self-organization is an interesting phenomenon observed in various areas including network growth Dorogovtsev2001 , traffic jams Chowdhury1999 and resource allocation yeung2010 . In social systems, individuals often imitate each other through interaction and observation, to become more typical in the community. Such dynamics results in a steady state in which most individuals adopt the typical practice by learning from each other. In online communities, self-organization is further facilitated by the recent advent of Web 2.0 social applications, which encourage Internet users to interact with peers. By interacting with each other, users self-organize and lead to a state of typical behaviors.
In resource sharing applications, tags are practical to facilitate the search and management of resources Golder2006 ; Cattuto2007 . Tags are usually simple labels and annotations which help users to have preliminary understanding of the content before collecting the resources. Recently, tagging systems are implemented in popular applications including delicious.com, flickr.com and citeulike.org. To well organize their resources, users assign tags with their bookmark, pictures or Bibtex files. By browsing through tags, users are able to find other users who share similar interests. Tags thus reflect user behaviors and preferences, and with which ones can easily search, collaborate and form communities with others Sen2006 .
Tagging systems are studied extensively in recent years, but the underlying interaction and dynamics among tag users are still unclear. Mathematically, tagging systems are composed of fundamental units of user-resource-tag triples Cattuto2007 ; Ghoshal2009 ; Zlatic2009 , and each tagging action constitutes one or several hyper-links in a tripartite graph. Such user-resource-tag relations are often referred to as folksonomy. Examples include the use of keywords or PACS numbers in academic papers, which also helps to reveal the structure of citation networks Palla2008 ; ZhangZK2008 . However, how similar papers influence each other on the choice of keywords is still an open question. To reveal the tagging dynamics, Cattuto et al Cattuto2009 suggested to consider the process of social annotation as a collective yet uncoordinated exploration of the underlying semantic space through a series of random walks. In Ref. Lambiotte2006 , Lambiotte et al modeled folksonomy in terms of tripartite graphs. Zhang and Liu ZhangZK2010 proposed a model to explain some statistical properties in folksonomy, in which users can search for resources via tags. Many of these studies consider individual tag assignment, while ignoring the interaction among peer tag users.
In this paper, we propose a model to investigate the dynamics and interaction among individuals in a tagging system. Specifically, individuals imitate each other in tagging which results in a self-organized state. We found that when users are of low confidence, they self-organize to attain a steady state of active tagging. On the other hand, the system ends with inactive tagging when users are confident of their own tagging practice. In addition, a phase transition is observed with a critical level of user confidence, when the system changes from one regime to the other. Furthermore, we compare distributions of post length from the proposed model to two real datasets obtained from delicious.com and flickr.com, which show good agreements.
II Model
We consider a model of tagging system with users. At each step, each user posts one resource and assign tags to the resource. The tendency of which the user assigns tags is characterized by , which is the probability that the user continues with tag assignment for the resource. In other words, the probability that user assigns tags at time is given by
| (1) |
where . Large corresponds to a high tendency to assign tags and vice versa. We thus call the tagivity, which characterizes the tendency of user in tag assignment. Given that remains unchanged, follows a geometric distribution with parameter . We model the self-organization of user by assuming that users adjust their based on the observation of , the average tagivity over all users at time .
As one main purpose for tagging is to facilitate the search of resources for others, users would tend to adopt a more typical tagging practice. They thus adjust their own tagivity in order to imitate the observed average tagivity over users. We denote the combination of tags associated with a resource to be a post. Based on observations, users obtain an estimated distribution of post length, which is the number of tags associated with each post. We assume that the users estimate the distribution based on the average user tagivity, as given by
| (2) |
where corresponds to the observed post length. With this distribution in mind, user randomly picks a post and imitates its length in the next step. Suppose user assigns tags at time , the probability that he/she picks a post of length less than is given by
| (3) |
On the other hand, the probability that user picks a post of length larger than is given by
| (4) |
With probability , user picks a post of length equals to his/her own post length at time .
Users imitate the post they pick up by changing their tagivities. For instance, user increases his/her tagivities if is smaller than , and vice versa. We denote the probabilities of which user increases, maintains or decreases his/her tagivity as , and , given by
| (5) | |||||
| (6) | |||||
| (7) |
where ensures . The parameter can be considered as the confidence of user on his own tagivity: corresponds to the case with unconfident users who tend to change their choice of tagivities every time step, and corresponds to the case with confident users who stay with their tagivities every time step. Increasing from 0 to 1 characterizes the increase in user confidence, such that users are more reluctant to changes.
We propose two response functions based on which the tagivity is updated. In the first case, the tagivity is updated linearly by
| (8) |
where , , respectively with probabilities , , , and is a parameter which characterizes the extent the tagivity is changed. When or , the tagivity increases or decreases. The parameter can be interpreted as the adaptability of the users. Large corresponds to faster adaptation to the typical behaviors.
In the second case, the complementary tagivity is updated multiplicatively by
| (9) |
where serves the same role as in linear update. A more explicit implication of this multiplicative updating can be obtained by the relation , where is the expected value of based on the geometric distribution. Equation (9) thus implies
| (10) |
In other words, the expected value of respectively increases by a factor of , remains unchanged or decreases by a factor of with .
III Simulation results
To reveal the dynamics underlying self-organization in the model, we conduct numerical simulations. We start with random initial for all users. At time , is drawn according to the probabilities in Eq. (1), such that , and are evaluated according to Eqs. (5)-(7). The tagivity for each user is then updated according to Eq. (8) in the case of linear update or Eq. (9) in the case of multiplicative update. Unless specified, the results are obtained when the system converges, i.e. becomes steady. We observed that has a slight fluctuation around a time average value and the fluctuation is dependent on and .
III.1 Convergence time
We first study the relation between the convergence time and the parameters , and . The self-organized state in our context corresponds to the state in which becomes steady. The convergence time is thus defined by the relation , for all and some sufficiently large .
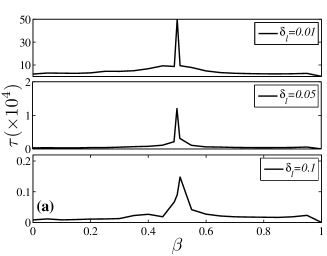
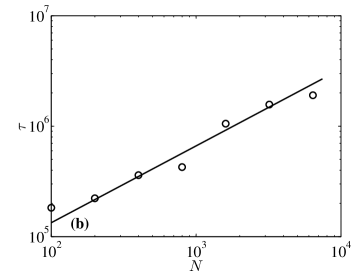
The convergence time is plotted in Fig. 1(a) as a function of confidence . As similar results are obtained from the two update rules, we present only the results obtained from the linear update. As shown in Fig. 1(a), the larger the adaptability , the faster the convergence time. The prominent peaks of convergence time observed at suggest the possibility of a phase transition at as dynamics slows down. Furthermore, peak positions are similar at different values of . It implies that, when the weight in Eqs. (5) - (7) to modify tagivity is equal to that to maintain tagivity, the users are confused and the self-organization slows down. As the convergence time is also dependent on system size, we plot in log-log scale as a function of at in Fig. 1(b), as studies Holme2006 ; Medvedyeva2003 suggest a conventional scaling of in the proximity of phase transition. These results suggest that on top of the self-organization, there is a phase transition in the range close to .
III.2 Steady distributions of tagivity
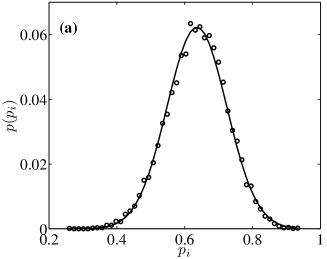
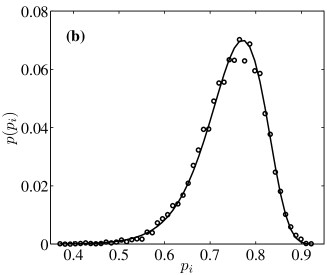
As mentioned in Sec. II, each user at each step randomly picks a post and imitates its length, their tagivities thus fluctuate around the average values. We show in Fig. 2 the stable distribution of tagivity after the system converges. Figure 2(a) shows that the stable distribution from linear update resembles Gaussian distribution. The simulation results are obtained by and and the parameter of Gaussian fit are and . The results are not as obvious as Eq. (8) suggests in the case when is a random variable. In such case, would result in an infinite variance of , as compared to the finite variance observed in Fig. 2(a). The finite variance of comes from the restoring process of around the typical behaviors, as given by the probabilities in Eqs. (5) - (7). Figure 2(b) shows the stable distribution of tagivity obtained from the multiplicative update, where approximately follows the log-normal distribution. Simulation results are obtained by and , with log-normal fitting of and . The origin of the log-normal distribution is similar to that of Gaussian distribution and can be seen by taking algorithm of Eq. (9).
IV Phase transition and Self-organization
Though analytic solutions for the general case are difficult to obtain, we can write down a simple description of the steady state when or . In this case we assume for all user . We further introduce a quantity which characterizes the tendency for to increase or decrease, as given by
| (11) |
describes the difference between and when the average user tagivity is . A positive corresponds to a tendency for to increase, and vice versa. Substitutions of Eqs. (5) and (7) for and into Eq. (11) lead to the following expression
| (12) |
We numerically evaluate the summation in Eq. (12) and obtain the values of when , i.e. when there is no tendency for to increase or decrease and the system becomes steady.
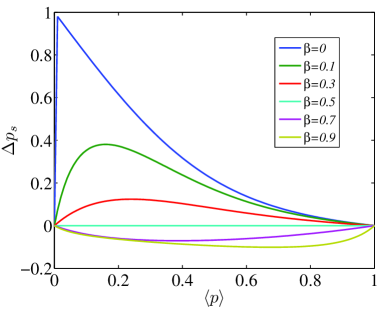
Figure 3 shows as a function of for different . These results imply that for all , are solutions of . The fixed points of or respectively correspond to the cases when all users in the system stop active tagging or assign infinite number of tags. When , we get for all , which implies that the tendency to increase tagivity is higher than that to decrease tagivity, leading to a stable fixed point at . On the other hand, when , we get which implies that the tendency for the tagivity to decrease is larger than that to increase, leading to an opposite result of stable fixed point at . This drastic change of the self-organized state corresponds to a phase transition at from a regime with active tag assignment to one with inactive tag assignment. It is also interesting to note that when , for all in Eq. (12) such that is guaranteed by the identity
| (13) |
for all values of . It implies that at the critical point of , the system does not have a unique fixed point of , unlike the cases with .
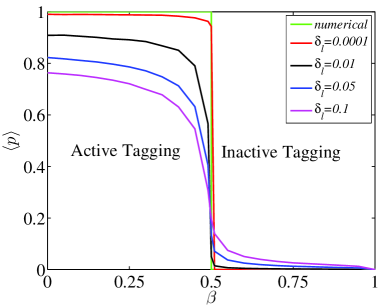
These analytical predictions of with are compared to simulation results with . As the results obtained from the two update rules are similar, we present only the results obtained from the linear update. The green line in Fig. 4 shows the analytical stable fixed points of with . We find that simulations with small agrees well with the analytical limit, and for , decreases with increasing as well as increasing . As we can see, all the simulation results show an abrupt change in at , suggesting the existence of a phase transition as predicted by the analytical results. We remark that corresponds to the case in Eqs. (5) - (7) where the weight to imitate others equal to that to stay unchanged. These results imply that when users have low confidence, they tend to imitate each other in tagging which leads to a steady state of active tag assignment. However, when users are confident and are stubborn for changes, they stay with their own practice and result in a steady state with inactive tagging. These two behaviors are connected by an abrupt change when confidence increases across .
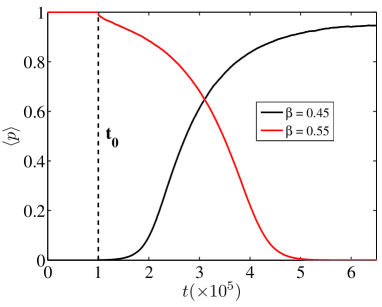
To show explicitly how users self-organize to attain the steady state, we start the system at the unstable fixed point and examine how it evolves to the stable fixed point after a slight perturbation. The black line in Fig. 5 corresponds to the average tagivity for the case when confident users (i.e. ) are initialized with zero tagivity. At time , one of the users assigns a tag which initiates others to imitate. As we can see, the average tagivity slowly increases after and saturates at a non-zero steady value, correspond to the self-organization from inactive to active tagging. On the contrary, the red line shows the case when users are initialized with and large confidence (i.e. ). A maximum post length is set to avoid infinite tagging. At time , one user assigns the minimum number of tags which initiates others to imitate. As we can see, the average tagivity slowly decreases after and becomes steady at zero, corresponds to the self-organization from active to inactive tagging.
V Empirical results
As it is difficult to define and obtain the tagivity for real users, other well-defined quantities are used for comparison. We compare the distributions of post length obtained from the model with two real datasets: (1) delicious.com, a social bookmarking website for saving, sharing and discovering bookmarks associated with tags; (2) flickr.com, an image hosting website which encourages users to organize their pictures with tags.
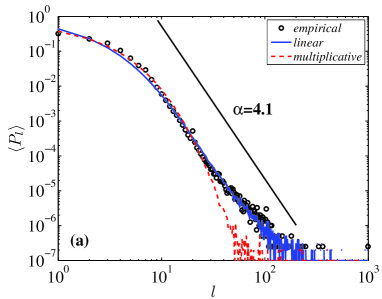
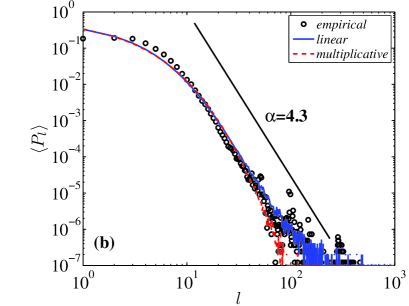
We show in Fig. 6 (a) and (b) the distributions of the post length (as open circles) obtained respectively from delicious.com and flickr.com. The posts without tags are removed from the statistics. It is interesting to note that the two distributions display similar behaviors: an initial fast decay with post length less than , followed by a power-law decay for intermediate post length, and then a high tail. The exponents of the power law decay are and respectively in delicious.com and flickr.com, with average post length approximately 2.9 and 3.4. The simulated distributions are plotted in Fig. 6 as blue and red lines respectively for linear and multiplicative update, all with . These results may suggest that real users are of low confidence and tend to imitate each other in tag assignment.
As we can see, the simulation results based on the linear update have better agreement with empirical data than that of the multiplicative update. With the linear update, the high tails of empirical data are also well fitted. According to Fig. 2, the tagivity distribution obtained from the linear update shows a slower decay at large , as compared to the faster decay in the multiplicative case. The slow decay at large , i.e. more users are found with large tagging tendency, may explain the high tail in the post length distributions.
VI Conclusions and Discussion
In this paper, we proposed a model to illustrate the self-organization of tagging behaviors in social tagging systems, where individuals imitate each other in tag assignment and eventually result in a self-organized state. With linear update on the tagging tendency, namely tagivity, the corresponding steady distribution resembles Gaussian distribution. On the other hand, the steady distribution resembles log-normal distribution when multiplicative update is employed. In addition, we found that when users are of low confidence, they tend to imitate others and the system ends with a steady state of active tagging. By contrast, when users are of high confidence, the system will reach a steady state of inactive tagging. Abrupt changes are observed when user confidence increases and the system changes from one regime to the other, suggesting a phase transition separating the active and inactive tagging. Analyses on convergence time suggest a slow dynamics around the parameter range of phase changes, which provides further evidence for the transition. Finally, the post length distributions of the model are compared to two real datasets obtained from delicious.com and flickr.com, which show good agreements.
Social tagging systems have been studied with approaches ranging from graph theory to statistics, which may overlook the interactions and dynamics among individuals. The present model introduced in this paper provides a simple yet interesting description of evolving social tagging systems, which might be generalized to other systems where self-organizations are observed. The proposed model may also shed light on applications (e.g. recommender systems ZhangZK20102 ; ZhangZK20103 ) which combine statistical physics and agent-based models Bonabeau2002 in understanding tagging systems as well as other social systems Castellano2000 .
Acknowledgment
This work was partially supported by the Program for New Century Excellent Talents in University (NCET-07-0288), the Fundamental Research Funds for the Central Universities and QLectives projects (EU FET-Open Grants 213360 and 231200). ZKZ acknowledges the National Natural Science Foundation of China (Grant nos. 60973069 and 90924011).
References
References
- (1) S.N. Dorogovtsev and J.F.F. Mendes, Phys. Rev. E 63, 025101 (2001).
- (2) D. Chowdhury and A. Schadschneider, Phys. Rev. E 59, R1311 (1999).
- (3) C. H. Yeung and K. Y. M. Wong, Eur. Phys. J. B 74, 227 (2010).
- (4) S. A. Golder and B. A. Huberman, J. Info. Sci. 32, 198 (2006).
- (5) C. Cattuto, V. Loreto, and L. Pietronero, Proc. Natl. Acad. Sci. USA 104, 1461 (2007).
- (6) S. Sen, S. K. Lam, A. M. Rashid, D. Cosley, D. Frankowski, J. Osterhouse, F. M. Harper, and J. Riedl, Proc. 20th Anniversary Conf. Computer Supported Cooperative Work, pp. 190 (2006).
- (7) G. Ghoshal, V. Zlatić, G. Caldarelli, and M. E. J. Newman, Phys. Rev. E 79, 066118 (2009).
- (8) V. Zlatić, G. Ghoshal, and G. Caldarelli, Phys. Rev. E 80, 036118 (2009).
- (9) G. Palla, I. J. Farkas, P. Pollner, I. Deréyi, and T. Vicsek, New J. Phys. 10, 123026 (2008).
- (10) Z.-K. Zhang, L. Lü, J.-G. Liu, and T. Zhou, Eur. Phys. J. B 66, 557 (2008).
- (11) C. Cattuto, A. Barrat, A. Baldassarri, G. Schehr, and V. Loreto, Proc. Natl. Acad. Sci. USA 106, 10511 (2009)
- (12) R. Lambiotte and M. Ausllos, Lect. Notes Comput. Sci. 3993, 1114 (2006).
- (13) Z.-K. Zhang and C. Liu, J. Stat. Mech. P10005 (2010).
- (14) P. Holme and M. E. J. Newman, Phys. Rev. E 74, 056108 (2006).
- (15) K. Medvedyeva, P. Holme, P. Minnhagen, and B.J.Kim, Phys.Rev.E 67, 036118 (2003).
- (16) Z. -K. Zhang, T. Zhou, and Y. -C. Zhang, Physica A 389, 179 (2010)
- (17) Z. -K. Zhang, C. Liu, T. Zhou, and Y. -C. Zhang, EPL 82, 28002 (2010)
- (18) E. Bonabeau, Proc. Natl. Acad. Sci. USA 99, 7280 (2002)
- (19) C. Castellano, M. Marsili and A. Vespignani, Phys. Rev. Lett. 85, 3536 (2000)