Accretion-induced luminosity spreads in young clusters: evidence from stellar rotation
)
Abstract
We present an analysis of the rotation of young stars in the associations Cepheus OB3b, NGC 2264, NGC 2362 and the Orion Nebula Cluster (ONC). We discover a correlation between rotation rate and position in a colour-magnitude diagram (CMD) such that stars which lie above an empirically determined median pre-main sequence rotate more rapidly than stars which lie below this sequence. The same correlation is seen, with a high degree of statistical significance, in each association studied here. If position within the CMD is interpreted as being due to genuine age spreads within a cluster, then the stars above the median pre-main sequence would be the youngest stars. This would in turn imply that the most rapidly rotating stars in an association are the youngest, and hence those with the largest moments of inertia and highest likelihood of ongoing accretion. Such a result does not fit naturally into the existing picture of angular momentum evolution in young stars, where the stars are braked effectively by their accretion discs until the disc disperses.
Instead, we argue that, for a given association of young stars, position within the CMD is not primarily a function of age, but of accretion history. We show that this hypothesis could explain the correlation we observe between rotation rate and position within the CMD.
keywords:
accretion, accretion discs, stars:pre-main-sequence planetary systems: protoplanetary discs1 Introduction
The rate at which star formation occurs is still an area of ongoing debate. The two competing paradigms of rapid star formation on dynamical timescales (e.g Elmegreen, 2000; Hartmann, 2001), and slow star-formation on timescales of several Myr (e.g Shu et al., 1987), are difficult to choose between on observational grounds. One argument in favour of slow star-formation (SSF) has been the observation of apparent age spreads in young clusters and associations (e.g Herbst & Miller, 1982; Sung et al., 1998; Pozzo et al., 2003; Dolan & Mathieu, 2001). These apparent age spreads manifest themselves as a spread in the location of young stars within a Hertzsprung-Russell (H-R) or a colour-magnitude diagram (CMD); at a given luminosity stars with a range of effective temperatures are observed, implying a range of radii or a spread in ages. Palla & Stahler (2000) have used ages obtained from the H-R diagram to argue that star formation takes place over 10 Myr and accelerates towards the present day. However, the reality of these apparent age spreads has been questioned by various authors. Hartmann (2001) suggested a number of factors which could produce a spread in the CMD or H-R diagram without requiring a genuine spread in ages. These included photometric variability, inadequate correction for variable extinction and the presence of unresolved binaries. Since then, Burningham et al. (2005) have shown that photometric variability cannot explain the observed spreads; nor can carefully controlling for the effects of binarity, variable reddening and contaminating light from the accretion disc explain the observed spreads in the Orion Nebular Cluster (Da Rio et al., 2010a) or LH 95 in the Large Magellanic Cloud (Da Rio et al., 2010b). In addition Jeffries (2007) used a novel geometrical technique to show that the apparent age spreads in the H-R diagram of the ONC are associated with a genuine spread in stellar radii. These recent results have added support to the idea that the luminosity spreads observed in young clusters and associations are a genuine phenomenon, and not an observational artifact. However, as accretion can affect the evolution of the central star, inducing a spread of luminosities and radii in a population which is co-eval, such spreads may not be attributable to a spread in ages. Most studies agree that current accretion rates typically observed in pre-main-sequence objects cannot cause the significant spreads in luminosity (or radius) observed in stellar populations (e.g. Tout et al., 1999; Hartmann et al., 1997; Siess et al., 1999). However, accretion and infall rates during the early, ‘assembly’ phase of star formation are expected to be much larger than those observed for more evolved stars.
Baraffe et al. (2009) demonstrate that assembly phase accretion can significantly affect the radius of the central star, causing accelerated contraction. Since the star’s radius changes on the thermal timescale, which also governs the contraction of the star towards the main sequence, a star’s radius will carry the imprint of this elevated protostellar accretion for a large fraction of its pre-main-sequence lifetime. Baraffe et al. (2009) find that apparent age spreads of up to 10 Myr can be produced by accretion rates of 10-4M⊙ yr-1. Such extreme accretion rates would cause young stars to be much brighter than observed. However, Baraffe et al. (2009) show that episodic accretion events with similar rates can still reproduce the observed luminosity spreads, without causing a luminosity problem. There is growing evidence that accretion onto young stars shows large variations in accretion rate (e.g. Enoch et al., 2009). Episodic accretion in not a prerequisite for significant luminosity spreads, but it can simultaneously explain the observed luminosity spreads without causing anomolously high luminosities and is more consistent with our current understanding of star formation and disc evolution (Vorobyov & Basu, 2006, 2010; Zhu et al., 2009).
Obtaining observational evidence for accretion-induced radius spreads is not a straightforward task, as the accretion history of a young star is not easily determined. One property which may be related to accretion history is the stellar rotation rate. Young stars typically rotate with periods in the range of 1–10 days, which is a fraction of their breakup speed. Whilst the underlying physical mechanism is not yet clear (see Matt et al., 2010, for a discussion), there is strong observational evidence that the population of stars with discs rotate more slowly than those without disks (e.g. Edwards et al., 1993; Herbst et al., 2000; Littlefair et al., 2005; Rebull et al., 2005; Cieza & Baliber, 2007). The modelling work of Rebull et al. (2004) showed that the period distribution of young stars can be explained if accretion from a disc results in a constant stellar spin period of around 7 days. Thus, the currently accepted view of spin evolution of young stars is that stars which are accreting are braked by the star-disc interaction and rotate slowly. Once the disc disperses, or the accretion rate drops below some critical threshold, the star will spin up again as it contracts towards the main-sequence. This spin-up is slow; it is a direct result of the contraction of the star and thus proceeds on the thermal timescale. Therefore, the present day rotation rate of the star depends upon the accretion history, although the exact relationship will depend on the details of the braking mechanism and be complicated by additional factors such as the stellar magnetic field strength.
If both luminosity and rotation rates are functions of the accretion history, it is possible that a correlation between rotation and luminosity exists. Motivated by this argument, we present an analysis of the link between rotation rate and luminosity for four star forming regions; the ONC, NGC 2264, Cep OB3b and NGC 2362.
2 Results
The ONC, NGC 2264, Cep OB3b and NGC 2362 are all young ( Myr) star forming regions in which large numbers of rotation periods have been measured. For the analysis presented here we take rotation periods from Herbst et al. 2002 (ONC), Lamm et al. 2004, 2005 (NGC 2264), Irwin et al. 2008 (NGC 2362) and Littlefair et al. 2010 (Cep OB3b). We concentrate on the higher mass stars (M⊙) in these clusters, since these stars show the clearest difference in rotation rate between stars with discs and those without (see Cieza & Baliber, 2007, for example), and show little dependence between rotation rate and stellar mass (e.g Littlefair et al., 2010). Masses for stars in each association were calculated in a consistent manner, using the extinction and distance-corrected -band magnitudes and the models of Baraffe et al. (1998) - see Littlefair et al. (2010) for more details. For the ONC, individual extinction values from Hillenbrand (1997) were used, but for the other associations a single extinction value was adopted for all stars. This is unlikely to be a realistic assumption, but fortunately the reddening vector lies approximately along the isochrones in a V, V-I diagram and so it is unlikely to affect our analysis.
We divided our data into bright and faint sub-samples using the following method. First we calculated the median colour in several magnitude bins, and a first-order polynomial was fitted to define the median magnitude as a function of colour. Stars with magnitudes brighter than this were assigned to the bright sub-sample and vice-versa. The results are shown in figure 1. We note here that the results in this letter are robust against changes in the method described above. Our results do not change significantly if we fit the median colour in a series of magnitude bins, or the median magnitude in a series of colour bins. Nor does the result depend on the order of the polynomial used to fit the median values.
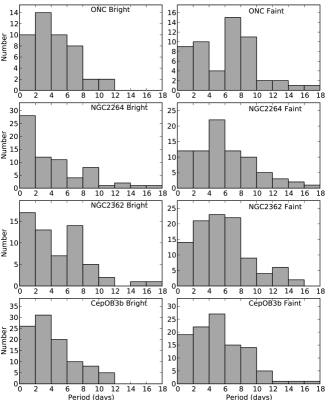
The period distributions for our data are shown in figure 2. It is readily apparent to the eye that, within each star forming region, the period distributions of the bright and faint sub-samples differ markedly. For example, in the ONC, the bright sub-sample lacks the characteristic bi-modal distribution observed in this cluster, showing instead a rising distribution towards short periods. By contrast, the faint sub-sample shows the familiar bi-modal distribution, with a secondary peak of slow rotators at 6–10 days.
We tested the null-hypothesis that the bright and faint sub-samples were drawn from the same parent distribution using a 1-D K-S test. The null hypothesis was rejected with 99.8 percent confidence for the ONC, 99.3 percent confidence for NGC 2264, 99 percent confidence for Cep OB3b and 98 percent confidence for NGC 2362. In all cases, the median period of the faint sub-sample is larger than the median period of the bright sub-sample. Whilst the period distributions of bright and faint sub-samples overlap substantially, we conclude that, on average, the more luminous stars in an association rotate more rapidly than the fainter stars.
It is well known that the lowest mass stars in an association rotate faster than the high mass stars (see Irwin et al., 2008; Littlefair et al., 2010; Herbst et al., 2002, for examples). Our sample was carefully chosen to avoid this confounding factor; the link between rotation and mass is weak or absent for masses greater than 0.4 M⊙. Furthermore, our bright and faint sub-samples have very similar mass distributions, a 1-D K-S test gives no evidence that the distributions are different, and the two samples show identical median masses. Nevertheless, we tested to see if a residual mass effect could be causing the correlation observed in figure 2. We divided the data from each cluster into higher mass and lower mass sub-samples, by splitting the data around the median mass. In all cases, a 1-D K-S test provided no evidence that the high-mass and low-mass sub-samples were drawn from different parent distributions. We can therefore rule out the mass-dependence of rotation as the cause of the correlation between luminosity and rotation rate.
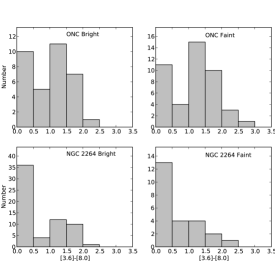
It is also possible that luminosity is correlated with the absence or presence of ongoing accretion. Since rotation rate is itself strongly correlated with the presence or absence of accretion discs, we might be observing a secondary correlation arising as a result. To check this we compared the distribution of Spitzer [3.6]-[8.0] colours (taken from Cieza & Baliber, 2007) for our bright and faint sub-samples in those clusters with sufficient existing Spitzer data (ONC and NGC 2264, see Figure 3). We found that the fraction of sources displaying an infrared excess was indistinguishable between the bright and faint sub-samples. This was confirmed with a 1d K-S test, which showed no evidence that the distribution of [3.6]-[8.0] colours in the bright and faint sub-samples were drawn from different parent distributions.
Lastly, we consider the possibility that the bright and faint sub-samples are affected differently by contamination from field star populations. For NGC 2264 and Cep OB3b, multiple colour cuts were used to remove background objects from the samples, so we believe this is unlikely in the case of those two associations. Since the correlation we report is common to all associations, we therefore rule out contamination by field stars as an explanation.
We conclude that a correlation between rotation rate and luminosity is a genuine and widespread property of young stellar associations.
3 Discussion
If we assume that luminosity spreads in a star forming region correspond to genuine age spreads, the results presented in section 2 are not compatible with the “disc locking” model for the spin evolution of young stars. Since accretion discs disperse over time, the youngest and hence brightest stars are more likely to possess discs and should rotate more slowly. This is compounded by the fact that young stars will be larger and will have larger moments of inertia. Therefore, if age spreads in star-forming environments are real, we expect the older (and less luminous) stars to be rotating more rapidly than the younger (and brighter) stars. This is the opposite trend to that observed. Therefore, either the luminosity spreads in star forming regions do not primarily reflect differences in stellar ages, or our understanding of the spin evolution of young stars needs revising.
The observed correlation between luminosity and rotation is more easily explained if we start from the assumption of a co-eval population within which luminosity spreads are introduced due to differing accretion histories. Starting from this assumption, there are three plausible mechanisms that can explain our results, which we refer to as scenarios A, B and C respectively.
3.1 Scenario A
In the models of Baraffe et al. (2009), stars accrete large fractions of their final mass during the assembly phase which lasts from 10,000 to 100,000 years depending on whether accretion is episodic or not, although estimates of the lifetimes of the evolutionary stages of young stars strongly favour episodic accretion lasting for years (see Baraffe et al., 2009, and references therein). The heavy accretion rates in the assembly phase drive stars away from thermal equilibrium. Luminosity spreads are introduced because stars accrete different fractions of their final mass during this phase; stars which accrete a large fraction of their final mass are further from thermal equilibrium, and are much smaller than stars which accrete a small fraction of their final mass during this phase.
We assume that all stars emerge from the assembly phase locked to their discs, and at similar rotation rates, and consider the ensuing spin-up towards the main sequence once disc-locking ceases. Stars which rapidly accrete large fractions of their mass during the assembly phase are already quite small, and undergo limited contraction and spin up as they approach the main sequence. A star which accretes a smaller fraction of its final mass during the assembly phase undergoes much more contraction, and hence spins up significantly as it approaches the main sequence. Case A thus naturally produces small, faint stars which are rotating more slowly than their larger, brighter counterparts.
3.2 Scenario B
In this scenario, we assume that the stars which accrete large fractions of their final mass during the assembly phase are likely to be those in dense environments surrounded by massive discs. We further assume that these stars are more likely to emerge from the assembly phase surrounded by massive discs which will in turn be longer-lived and supply the pre-main-sequence star with material at a higher accretion rate. These stars are most likely to remain locked to their discs and will show slow rotation rates. Since they experienced heavy assembly phases, they are also the smallest, faintest stars.
By contrast, stars which are rotating rapidly at a few Myr must, according to the disc-locking model, have been released from their discs after yr. The most rapidly rotating stars in an association are therefore those stars with shortest disc lifetimes. Under scenario B, these stars also accreted a small fraction of their final mass during the assembly phase and are therefore the largest, brightest stars.
3.3 Scenario C
Some authors have suggested (e.g. Hartmann & Kenyon, 1996; Kley & Lin, 1999) that, contrary to the results of Baraffe et al. (2009) phases of rapid accretion can dramatically increase the size (and luminosity) of a young star. Such a star would look much younger in a CMD than a non-accreting counterpart with the same initial mass and radius. The accreting star’s Kelvin-Helmholtz timescale drops as a result of the increased size and luminosity. Thus, over a given time period the accreting star contracts and spins up more than it’s non-accreting counterpart. Thus, some time after the accretion event, the accreting star looks younger, and will be rotating more rapidly than, the non-accreting star. In other words, such a scenario can also explain the correlations presented here.
In summary, there are three plausible scenarios which explain the correlation between luminosity and rotation. Each starts from a co-eval population into which luminosity spreads are injected through varying accretion histories. We therefore argue that the observed correlation between luminosity and rotation is strong evidence that luminosity spreads in star forming region are primarily caused by a range of accretion histories, instead of a spread in ages.
In principle, it ought to be possible to determine if accretion-induced luminosity spreads can explain the full extent of the observed luminosity spreads in star forming regions by simultaneously modelling the affects of accretion on the stellar luminosity and spin rate. The difficulty with such an analysis at present lies in the fact we do not know how accretion at a given rate effects the spin of the central object. Proper modelling of this result will therefore require a fuller understanding of the physical mechanism(s) by which the star-disc interaction governs stellar rotation. In addition, some of the scatter seen in figure 1 results from variability, extinction and binarity. This scatter might also explain some of the substantial overlap between the period distribution of bright and faint samples. Any analysis would have to include a careful treatment of these confounding factors.
3.4 Alternatives
Can any other mechanisms plausibly explain the sense of the correlation we observe here? One potential mechanism is the effect of magnetic activity on stellar radius. Observations of low-mass stars in eclipsing binaries show that they are over-sized by some 5–10 percent (see Ribas, 2006, for a review). Several authors have argued that this could be the result of magnetic activity (López-Morales, 2007; Ribas et al., 2008), and Chabrier et al. (2007) showed that this discrepancy could be explained by magnetic effects, including starspots. Since pre-main-sequence stars are magnetically highly active (e.g. Donati et al., 2010) it is plausible this mechanism operates in pre-main-sequence stars too. We can speculate that the influence of magnetic fields on stellar structure might cause a correlation similar in sense to that presented in this paper. The effect of starspot coverage is to increase the stellar radius and reduce the effective temperature, at roughly constant luminosity (Chabrier et al., 2007). If the lower effective temperature produces redder V-I colour, and if rapid rotators have larger spot coverage than slower rotators, this could explain the correlation observed here. However, neither of these conditions are likely to be satisfied. So far, there is little evidence for a link between rotation and activity for pre-main-sequence stars Scholz et al. (2007); it is likely that most pre-main-sequence stars show saturated levels of activity across a wide range of rotation rates. Even if rapid rotators did have higher spot coverages, it is far from clear that the ensuing drop in effective temperature would cause a change in V-I colour. At the typical effective temperatures within our sample (T K), a cool starspot reduces both the V-band and I-band flux, and can leave V-I unchanged. Good evidence that this in fact the case comes from the CMD of intermediate age clusters like NGC 2547 (e.g. Jeffries et al., 2004), which have a very tightly defined pre-main-sequence locus in a V, V-I CMD, and contain many stars with saturated levels of magnetic activity (Jeffries et al., 2006). Therefore, we believe it is unlikely that starspots are the origin of the correlation presented within this paper.
4 Conclusions
We have presented an analysis of the rotation of young stars in the associations Cepheus OB3b, NGC 2264, NGC 2362 and the Orion Nebula Cluster (ONC). The rotation rate shows a significant correlation with position in a CMD, in the sense that stars with below average luminosity are rotating more slowly than stars with above average luminosity. If position within the CMD is interpreted as being due to genuine age spreads within a cluster, then the implication is that the youngest stars in the cluster (those with the largest moments of inertia and highest likelihood of ongoing accretion) are the most rapidly rotating. Such a result is in conflict with the existing picture of angular momentum evolution in young stars, where the stars are braked effectively by their accretion discs until the disc disperses.
Instead, we argue that, for a given association of young stars, position within the CMD is not primarily a function of age, but of accretion history. We have shown that this hypothesis can, in principle, explain the correlation we observe between rotation rate and position within the CMD. Since variations in accretion history can lead to spreads in radii and luminosity matching those observed, evidence for age spreads in star forming regions must currently be viewed sceptically. Furthermore, this implies that masses and ages, which are inferred by comparison to non-accreting evolutionary tracks, may be in error. If true, the initial mass functions and ages of star forming regions may need significant revision.
Acknowledgements
SPL is supported by an RCUK fellowship. This research has made use of NASA’s Astrophysics Data System Bibliographic Services.
References
- Baraffe et al. (1998) Baraffe I., Chabrier G., Allard F., Hauschildt P. H., 1998, A&A, 337, 403
- Baraffe et al. (2009) Baraffe I., Chabrier G., Gallardo J., 2009, ApJ, 702, L27
- Burningham et al. (2005) Burningham B., Naylor T., Littlefair S. P., Jeffries R. D., 2005, MNRAS, 363, 1389
- Chabrier et al. (2007) Chabrier G., Gallardo J., Baraffe I., 2007, A&A, 472, L17
- Cieza & Baliber (2007) Cieza L., Baliber N., 2007, ApJ, 671, 605
- Da Rio et al. (2010a) Da Rio N., Robberto M., Soderblom D. R., Panagia N., Hillenbrand L. A., Palla F., Stassun K. G., 2010a, ApJ, 722, 1092
- Da Rio et al. (2010b) Da Rio N., Gouliermis D. A., Gennaro M., 2010b, ApJ, 723, 166
- Dolan & Mathieu (2001) Dolan C. J., Mathieu R. D., 2001, AJ, 121, 2124
- Donati et al. (2010) Donati J., Skelly M., Bouvier J., Gregory S., Grankin K., Jardine M., Hussain G., Menard F., Dougados C., Unruh Y., Mohanty S., Auriere M., Morin J., Fares R., the MaPP collaboration 2010, MNRAS, 409, 1347
- Edwards et al. (1993) Edwards S., Strom S. E., Hartigan P., Strom K. M., Hillenbrand L. A., Herbst W., Attridge J., Merrill K. M., Probst R., Gatley I., 1993, AJ, 106, 372
- Elmegreen (2000) Elmegreen B. G., 2000, ApJ, 530, 277
- Enoch et al. (2009) Enoch M. L., Evans N. J., Sargent A. I., Glenn J., 2009, ApJ, 692, 973
- Hartmann (2001) Hartmann L., 2001, AJ, 121, 1030
- Hartmann et al. (1997) Hartmann L., Cassen P., Kenyon S. J., 1997, ApJ, 475, 770
- Hartmann & Kenyon (1996) Hartmann L., Kenyon S. J., 1996, ARA&A, 34, 207
- Herbst et al. (2002) Herbst W., Hamilton C. M., Vrba F. J., Ibrahimov M. A., Bailer-Jones C. A. L., Mundt R., Lamm M., Mazeh T., Webster Z. T., Haisch K. E., Williams E. C., Rhodes A. H., Balonek T. J., Scholz A., Riffeser A., 2002, PASP, 114, 1167
- Herbst et al. (2000) Herbst W., Maley J. A., Williams E. C., 2000, AJ, 120, 349
- Herbst & Miller (1982) Herbst W., Miller D. P., 1982, AJ, 87, 1478
- Hillenbrand (1997) Hillenbrand L. A., 1997, AJ, 113, 1733
- Irwin et al. (2008) Irwin J., Hodgkin S., Aigrain S., Bouvier J., Hebb L., Irwin M., Moraux E., 2008, MNRAS, 384, 675
- Jeffries (2007) Jeffries R. D., 2007, MNRAS, 381, 1169
- Jeffries et al. (2006) Jeffries R. D., Evans P. A., Pye J. P., Briggs K. R., 2006, MNRAS, 367, 781
- Jeffries et al. (2004) Jeffries R. D., Naylor T., Devey C. R., Totten E. J., 2004, MNRAS, 351, 1401
- Kley & Lin (1999) Kley W., Lin D. N. C., 1999, ApJ, 518, 833
- Lamm et al. (2004) Lamm M. H., Bailer-Jones C. A. L., Mundt R., Herbst W., Scholz A., 2004, A&A, 417, 557
- Lamm et al. (2005) Lamm M. H., Mundt R., Bailer-Jones C. A. L., Herbst W., 2005, A&A, 430, 1005
- Littlefair et al. (2005) Littlefair S. P., Naylor T., Burningham B., Jeffries R. D., 2005, MNRAS, 358, 341
- Littlefair et al. (2010) Littlefair S. P., Naylor T., Mayne N. J., Saunders E. S., Jeffries R. D., 2010, MNRAS, 403, 545
- López-Morales (2007) López-Morales M., 2007, ApJ, 660, 732
- Matt et al. (2010) Matt S. P., Pinzón G., de la Reza R., Greene T. P., 2010, ApJ, 714, 989
- Palla & Stahler (2000) Palla F., Stahler S. W., 2000, ApJ, 540, 255
- Pozzo et al. (2003) Pozzo M., Naylor T., Jeffries R. D., Drew J. E., 2003, MNRAS, 341, 805
- Rebull et al. (2005) Rebull L. M., Stauffer J. R., Megeath T., Hora J., Hartmann L., 2005, American Astronomical Society Meeting Abstracts, 207,
- Rebull et al. (2004) Rebull L. M., Wolff S. C., Strom S. E., 2004, AJ, 127, 1029
- Ribas (2006) Ribas I., 2006, in C. Aerts & C. Sterken ed., Astrophysics of Variable Stars Vol. 349 of Astronomical Society of the Pacific Conference Series, Binaries as Astrophysical Laboratories: Open Questions. pp 55–+
- Ribas et al. (2008) Ribas I., Morales J. C., Jordi C., Baraffe I., Chabrier G., Gallardo J., 2008, Mem. Soc. Astron. Italiana, 79, 562
- Scholz et al. (2007) Scholz A., Coffey J., Brandeker A., Jayawardhana R., 2007, ApJ, 662, 1254
- Shu et al. (1987) Shu F. H., Adams F. C., Lizano S., 1987, ARA&A, 25, 23
- Siess et al. (1999) Siess L., Forestini M., Bertout C., 1999, A&A, 342, 480
- Sung et al. (1998) Sung H., Bessell M. S., Lee S., 1998, AJ, 115, 734
- Tout et al. (1999) Tout C. A., Livio M., Bonnell I. A., 1999, MNRAS, 310, 360
- Vorobyov & Basu (2006) Vorobyov E. I., Basu S., 2006, ApJ, 650, 956
- Vorobyov & Basu (2010) Vorobyov E. I., Basu S., 2010, ApJ, 719, 1896
- Zhu et al. (2009) Zhu Z., Hartmann L., Gammie C., 2009, ApJ, 694, 1045