The Carina Project. IV. radial velocity distribution11affiliation: Based on spectra collected with the spectrograph FORS2 available at the ESO Very Large Telescope (VLT), Cerro Paranal, (072.D-0671(A) PI: Bono – 078.B-0567(A) PI: Thévenin)
Abstract
We present new and accurate radial velocity (RV) measurements of luminous stars of all ages (old horizontal branch, intermediate–age red clump, and young blue plume, as well as red giants of a range of ages; 20.6V22) in the Carina dwarf spheroidal galaxy, based on low-resolution spectra collected with the FORS2 multi-object slit spectrograph at the VLT. This data set was complemented by RV measurements based on medium and high-resolution archive spectra of brighter (V20.6) Carina targets collected with the GIRAFFE multi-object fiber spectrograph at the VLT. The combined sample includes more than 21,340 individual spectra of 2,000 stars covering the entire body of the galaxy. The mean (RV=220.40.1 km s-1) and the dispersion (=11.70.1 km s-1) of the RV distribution of candidate Carina stars (1,210 objects, 180260 km s-1, 4) agree quite well with similar measurements available in the literature. To further improve the statistics, the accurate RV measurements recently provided by Walker et al. (2007) were also added to the current data set. We ended up with a sample of 1,370 RV measurements of candidate Carina stars that is 75% larger than any previous Carina RV sample. We found that the hypothesis that the Carina RV distribution is Gaussian can be discarded at 99% confidence level. The mean RV across the body of the galaxy varies from 220 km s-1 at a distance of 7′ (200 pc) from the center to 223 km s-1 at 13′ (400 pc, 6 level) and flattens out to a constant value of 221 km s-1 at larger distances (600 pc, 4 level). Moreover and even more importantly, we found that in the Carina regions where the mean RV is smaller the dispersion is also smaller, and the RV distribution is more centrally peaked (i.e. the kurtosis attains larger values). The difference in mean RV is more than 4 km s-1 (9 level), when moving from E to W, and more than 3 km s-1 (7 level), when moving from N to S. The RV gradient appears to be in the direction of the Carina proper motion. However, this parameter is affected by large uncertainties to reach a firm conclusion. There is evidence of a secondary maximum in RV across the Carina center (200 pc). The occurrence of a secondary feature across the Carina center is also supported by the flat-topped radial distribution based on the photometric catalog. These findings are reminiscent of a substructure with transition properties, already detected in dwarf ellipticals, and call for confirmation by independent investigations.
Subject headings:
galaxies: individual (Carina) — galaxies: stellar content — galaxies: dwarf — Local Group — galaxies: kinematics and dynamics — techniques: radial velocities1. Introduction
Dwarf galaxies are fundamental laboratories to investigate the influence of the environment on star formation and on chemical evolution in stellar systems that are several order of magnitudes smaller than giant galaxies. Empirical evidence indicates that in the Local Group together with the dwarf ellipticals (dE, M32-like) and the dwarf spirals (dS, M33-like) we are facing three different dwarf morphological types. The dwarf spheroidals (dSphs) show either single (Cetus, Monelli et al. 2010a; Tucana, Monelli et al. 2010b) or multiple star formation events (Carina, Bono et al. 2010), are spheroidal in morphology and devoid of neutral hydrogen (Bouchard et al. 2005). The dwarf irregulars (dIs) host a mix of old and young stellar populations, but they have recently experienced an intense SF episode (Sanna et al. 2009; Cole 2009), moreover, they have irregular morphology and host a significant fraction of neutral hydrogen. The transition dwarfs have properties between the dSphs and the dIs. The observational scenario concerning the dwarfs in the LG was recently enriched by the discovery of ultra-faint dSphs in the SDSS (Zucker et al. 2006; Tolstoy et al. 2009; Wyse 2010), but their properties still need to be investigated in detail. Although the morphological classification appears robust, we still lack firm quantitative constraints concerning the evolution/transition between different dwarf morphological types. Kormendy (1985, 1987) found a well defined dichotomy between ellipticals (Es) and spheroidals (Sphs, Kormendy et al. 2009). Early type galaxies are distributed along a sequence moving from cD to dEs, while spheroidals are distributed along a sequence that overlaps with spirals and dwarf irregulars (see Fig. 1 in Kormendy et al. 2009). This empirical dichotomy seems to suggest that E and Sph galaxies are stellar systems that underwent different formation and evolution processes. In particular, the Sphs might be either spirals or irregulars that lost their gas or transformed it into stars. However, there is no general consensus concerning the E–Sph dichotomy, since the correlation between the shape of the brightness profile and the galaxy luminosity is continuous when moving from Es to Sphs (Jerjen & Binggeli 1997; Gavazzi et al. 2005; Ferrarese et al. 2006).
Theoretical and empirical uncertainties affect our understanding of several empirical correlations. More than twenty years ago it was suggested by Skillman et al. (1989) that the luminosity of dwarfs is correlated with their mean metallicity. However, it is not clear whether this correlation is linear over the entire metallicity range or shows a plateau in the metal-poor regime (Helmi et al. 2006; Mateo et al. 2008; Kirby et al. 2008). More recently, it was suggested by Woo et al. (2008) that dEs/dSphs in the LG, at fixed total visual luminosity, show larger mass-to-light (M/L) ratios (see their Fig. 1). The same systems are, at fixed total stellar mass, more metal-rich than dIs (see their Fig. 10 and Mateo 1998).
Precise and homogeneous photometric and spectroscopic data are required to address the above open issues concerning the formation and evolution of these systems. The advent of multi-object spectrographs at the 8-10m class telescopes provided the unique opportunity to collect sizable samples of low-, medium- and high-resolution spectra covering the entire body of nearby dwarf galaxies. By using hundreds of radial velocity (RV) measurements it has been suggested by Kleyna et al. (2004) that Sextans dSph host kinematic substructures, in particular, they found that the RV dispersion of the stellar population located across the center of this system is close to zero and increases outside the core. A different kinematic status has also been suggested by Battaglia et al. (2008) for the two distinct stellar populations in the Sculptor dSph.
Moreover, evidence of a fall-off in the velocity dispersion at large galactic distances was suggested in Sextans, Draco and Ursa Minor (Kleyna et al. 2003; Wilkinson et al. 2004, 2006). However, Walker et al. (2009), using large and homogeneous samples of RV measurements based on high-resolution spectra collected with Mike Multi Fiber Spectrograph (MMFS) at Magellan (Walker et al. 2007, hereinafter W07), found that the RV profile in several dSphs (Carina, Draco, LeoI, LeoII, Ursa Minor) are flat at large projected radii (R1 kpc), while Fornax, Sculptor and Sextans show a gentle decline.
The observational scenario is far from being settled, and indeed, Łokas et al. (2008) and Łokas (2009) using the same RV measurements provided by Walker et al. (2007), but a different algorithm to reject tidally stripped stars, found a significant decline in the RV dispersion profile of Carina, Fornax, LeoI, Sculptor and Sextans. Furthermore, it was also suggested that kinematic status of Carina (Muñoz et al. 2006) and Bootes (Belokurov et al. 2006) might be disturbed by the Milky Way. In this context, Carina plays a key role because it is relatively close (=20.10 mag), shows at least two well separated SF episodes (t=1-6 and 12 Gyr) and it is metal-poor ([Fe/H]–1.7 dex).
Our group is involved in a long-term project on the evolutionary properties, variable stars, kinematic and abundances of stellar populations in the Carina dSph. This is the fourth paper of a series and it is focused on the radial velocity distribution of candidate Carina stars. The structure of the paper is as follows. In Section 2, we discuss in detail the different spectroscopic data sets we collected for this experiment, together with the approach we adopted to reduce the data. Section 3 deals with radial velocity measurements and with the observational strategy we adopted to validate radial velocities based on low-, medium- and high resolution spectra. In Section 4 we lay out the selection criteria adopted to identify candidate Carina stars and their radial velocity distribution. In Section 5, we investigate the velocity distribution, the velocity dispersion and the kurtosis of candidate Carina stars as a function of the projected radial distance. In this section, we also address the similarity between spectroscopic and photometric radial distributions. Finally, in Section 6 we summarize the results of this investigation and briefly outline possible future extensions of this photometric and spectroscopic experiment.
2. Spectroscopic data sets and data reduction
To collect low-resolution spectra of old (Horizontal Branch [HB], V20.75 mag), intermediate (Red Clump [RC], V20.5 mag) and young (Blue Plume [BP], V22 mag) stellar tracers (see Fig. 1) we observed five fields with FORS2 at VLT (Appenzeller et al. 2008) in service mode111ESO programs 072.D-0671(A), P.I.: Bono; 078.B-0567(A), P.I.: Thévenin. The program was almost completed by one of us (M.N.) during a Visitor mode observations in December 2004. A significant fraction of FORS2 spectra were collected using the 1400V grism, which covers Hβ (=4861.34 Å) and MgI Triplet (MgIT222MgIT: =5167.32, 5172.68, 5183.62 Å) lines, with a nominal resolution of 2100 (=5200 Å). The slits used were 0′′.6 length, and typically 10′′. long, with a wavelength coverage 4560–5860 Å. The exposure times range from 22 minutes (short) to more than one hour (long).
During the December 2004 run, the 1028z grism was also used with a wavelength coverage 7730–9480 Å. Its nominal resolution is 2560 (=8600 Å) and covers the near-infrared (NIR) calcium triplet (CaT333CaT: = 8498.02, 8542.09, 8662.14 Å). Using the 1400V grism we secured in 19.12 hrs of exposure time 743 individual spectra of 356 stars with DIMM seeing ranging from 0′′.35 to 1′′.27, while using the 1028z grism we secured in 1 hr of exposure time 113 spectra of 73 stars with seeing 0′′.38–0′′.59. Most of the stars with 1028z spectra also have 1400V spectra. We ended up with a total sample of 359 stars either with single or multiple FORS2 spectra. In particular, the LR data set collected with the grism 1400V includes 356 stars and among them eleven have a single spectrum, while the others a number of spectra ranging from two to twelve. The LR data set collected with the grism 1028z includes 73 stars and among them 39 have single spectra, while the others a number of spectra ranging from two to three. In total the LR data set includes 359 stars of which eleven have a single spectrum and the others a number of spectra ranging from two to 14. Table 1 gives the log of the observations of the spectra collected with FORS2. From left to right are listed the date, the pointing, the coordinates, the grism, the exposure time and the seeing.
These data were complemented by archival medium and high-resolution spectra of Red Giant (RG) and RC stars collected with GIRAFFE (Pasquini et al. 2002) at VLT444ESO programs 074.B-0415(A), P.I.: Shetrone; 171.B-0520(B), P.I.: Gilmore; 180.B-0806(B), P.I.: Gilmore and covering the entire body of the galaxy (see Fig. 1). The GIRAFFE spectra (Koch et al. 2006) were collected using the grating LR8 with a nominal resolution of 6,500 centered on the NIR CaT. This data set (hereinafter GMR03) includes 10,394 individual fiber spectra of 1,070 stars and were secured with a total exposure time of 95.4 hrs with seeing condition of 0′′.4–2′′.2. Note that this data set was also adopted by Muñoz et al. (2006) in their analysis of Carina radial velocity distribution.
We also use the high-resolution spectra collected with the gratings: HR10 (R=19,800, 53395619 Å), HR13 (R=22,500, 61206405 Å) and HR14A (R=17,740, 63086701 Å). This data set (hereinafter GHR) includes 2,002 individual spectra of 98 stars, secured with a total exposure time of 24 hrs and seeing 0′′.57–3′′.20. The above data were complemented by a new set of GIRAFFE spectra collected with LR8 and including 8,092 individual spectra of 959 stars. This data set (hereinafter GMR08) was secured with 48.4 hrs of exposure time and seeing of 0′′.54–1′′.94. We ended up with a total sample of 1,931 stars either with single or multiple GIRAFFE spectra.
The GMR (GMR03GMR08, weighted mean) data set includes 1,887 stars and only one star has a single spectrum, while the others have multiple spectra ranging from two to 35. The HR data set includes 98 stars and all of them have multiple spectra ranging from seven to nine. Moreover, the GHR and the GMR03 spectra have 38 objects in common, while 125 objects are in common between GHR plus GMR03 and GMR08 spectra. The LR resolution data set has 145 objects in common with the GIRAFFE (GHR plus GMR) data set. The objects in common were adopted to calibrate GMR and LR spectra.
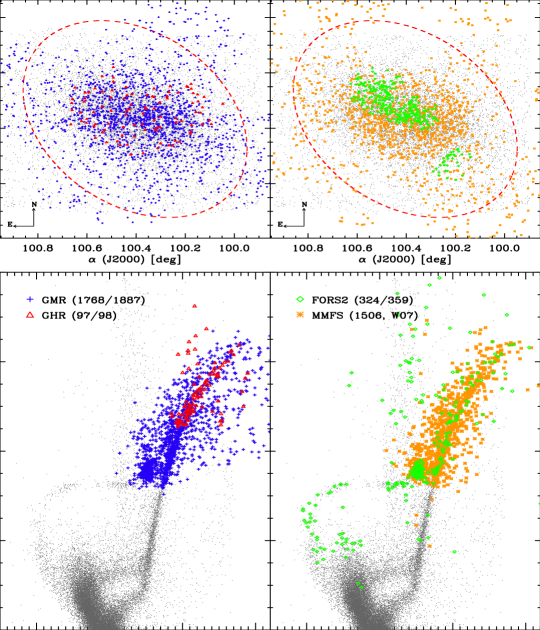
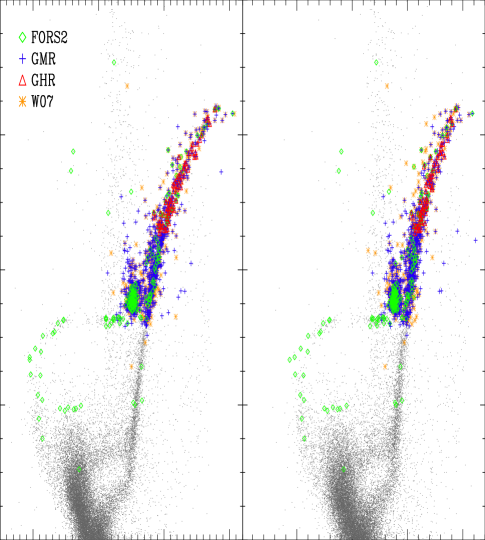
Data plotted in the top panels of Fig. 1 show the spatial coverage of the different data sets, while the bottom panels show the location of the targets in the V,B–I Color-Magnitude Diagram (CMD, Bono et al. 2010). The numbers in parenthesis give the number of stars for which we estimated the radial velocity and the total number of stars for which we collected at least one spectrum.
Data plotted in the bottom panels of Fig. 1 show several interesting features: i) Stellar tracers – The FORS2 spectra cover old, intermediate and young stellar tracers (V22, 359 RVs). ii) Statistics – Although the exposure time of the GIRAFFE spectra is a factor of 4-8 longer than the FORS2 spectra, their limiting magnitude is V20.6 (fibers vs slits). This means that this data set does not cover young (BP) and truly old (HB) tracers. The RGs are, indeed, a mix of old and intermediate–age stellar tracers. However, the sample of RV measurements based on GIRAFFE spectra (1,985 vs 359) is more than a factor of five larger than FORS2 (FoV 25 vs 5 arcmin squared). iii) Multiplicity – A significant fraction of our targets have multiple spectra. This means that we can provide robust estimates of intrinsic errors. iv) – A significant overlap of low, medium and high-resolution spectra – We can constrain the occurrence of possible systematic errors in RV measurements using spectra collected with different instruments and different gratings/grisms.
We reduced our FORS2 data using standard IRAF555IRAF is distributed by the National Optical Astronomy Observatory, which is operated by the Association of Universities for Research in Astronomy, Inc., under cooperative agreement with the National Science Foundation. tasks, using day time associated bias frames, flat field and calibration lamps. The wavelength calibration was carried out using the task identify, daytime lamp frames and a set of 8-12 calibration lines. We typically end up with an accuracy better than 0.02–0.04 Å, 2.5 km s-1. However, we found systematic shifts up to 1 pixel, corresponding to 30 km s-1 in radial velocity, for the two adopted grisms. To overcome the problem, we adopted the approach suggested by Kelson (2003). A model of the sky for each slit was created and subtracted from the reduced 2D spectrum. This model was also used to estimate and correct the systematic shifts from the daytime wavelength calibration lamps, using night sky lines, mainly OI 5577.34 Å for the 1400V grism and a set of isolated skylines for the 1028z grism.
Yet another potential source of systematics in RV estimates was the centroiding (see, e.g. Tolstoy et al. 2001). Thanks to the special care in the mask design, based on previous FORS2 preimaging of selected Carina fields, and to the very precise tracking of VLT, this effect was limited at the level of 5-10 km s-1. To estimate the shift between the centroid of the star and the slit we adopted the slit image which is acquired just before the spectrum. For each target the centroid of the slit is evaluated by collapsing the slit along its width and neglecting the pixels belonging to the star. The collapsed slit is then subtracted away from the pixels belonging to the star, whose centroid is then estimated with the task center in IRAF. It is worth mentioning that we also acquired slit images, for a couple of masks, soon after we collected the spectra. These slit images were adopted to confirm that our estimates of the centroids were minimally affected by tracking problems. The details of the pre-reduction and reduction of FORS2 spectra will be discussed in a forthcoming paper (Nonino et al. 2011, in preparation).
The GIRAFFE raw data were retrieved from the ESO Archive. These data were reduced using IRAF. After the standard bias and flat correction, the spectra were extracted using the traces from flats. Wavelength calibration is based on daily calibration lamps: the formal solution rms was 0.02 Å, corresponding to a systematic 1 km s-1 in RV. After the fiber-spectra assignment, performed using the table associated with the raw data, all the spectra were visually inspected in order to remove bad spectra. A master sky for each exposure was created from sky fibers, after the spectra had been cross-correlated to remove shifts and scaled using the intensity of selected night sky lines in the wavelength range 8250–8750 Å, to better match the region with stellar absorption lines. Subsequently the master skies were cross correlated with the targets spectra, scaled in intensity and subtracted. The cross correlation among the stacked skies showed that the relative accuracy in wavelength calibration could give systematics of the order of 500 m s-1 in RV. We finally coadded all the individual spectra of the same target using the task scombine, after correcting for the barycentric motion.
The GIRAFFE spectra taken with the high resolution grisms were reduced following a similar approach.
3. Radial velocity measurements
To measure the RV of GMR and GHR spectra we fit individual spectral lines in the coadded spectra. The RV of the LR spectra was measured on individual spectra and the final RV was estimated as a weighted mean among the multiple spectra, when available, of the same object. All spectra were normalized to the continuum and the fit to single or multiple lines performed using either a Gaussian or a Moffat function. The interactive code developed to perform the RV measurements will be described in a forthcoming paper (Fabrizio et al. 2011, in preparation). We selected by visual inspection several spectral lines for each data set, namely Hβ and MgI triplet for FORS2/1400V spectra (see the spectra plotted in the panels d) of Fig. 2), the CaT for FORS2/1028z and GMR spectra (see the spectra plotted in the panels c) and b) of Fig. 2) and several strong FeI lines for GHR spectra (see the spectra plotted in the panels a) of Fig. 2). The quoted lines were typically fit with a Moffat function with =2, to properly account for the contribution of the wings in the line fit.
This preliminary estimate of the RV was validated by eye inspection and when judged satisfactory it was adopted to perform an automatic estimate of the RV using a large set of iron and heavy element lines. We adopted the line list for iron, - and heavy-elements recently provided by Romaniello et al. (2008) and by Pedicelli et al. (2010). The lines were selected according to the wavelength range and the spectral resolution of the different instruments and grisms. We ended up with a sub-sample of 30–70 lines for LR (grisms: 1028z, 1400V) spectra, with 35 lines for GMR spectra and with 90 lines for the GHR spectra. For each spectrum we estimate the RVs as a weighted mean of the lines with the highest S/N ratio. This on average means 1-2 dozens of lines for LR and GMR spectra and approximately 40 lines for the GHR spectra.
The error in the RV based on individual lines was assumed equal to the sigma of the fitting function666In particular, we assume =c/ km s-1. The RV of the entire spectrum was estimated as a weighted mean over the different fitted lines. The error in the radial velocity of coadded spectra (GMR,GHR) is the error of the weighted mean. The RV of the LR spectra was estimated following the same approach for stars with a single spectrum and as a weighted mean among the different mean measurements for the stars with multiple spectra.
Data plotted in Fig. 3 show that the intrinsic error of the RV measurements based on GHR spectra is on average (biweight mean)777Following the referee’s suggestion, we adopted the biweight location estimator (Andrews et al. 1972), since it is a robust indicator insensitive to outliers in both Gaussian and non-Gaussian distributions. We adopted the definition given by (Beers et al. 1990), which includes data up to four standard deviations from the central location. This method is based on an iterative solution, but the process only requires a few steps to convergence. 1 km s-1 (panels a,b,c) and becomes of the order of 5 km s-1 for GMR03 spectra (panel d). Note that the intrinsic error of GMR08 spectra is larger and 6 km s-1. The difference is mainly due to the S/N ratio, since the latter sample is on average 0.5 mag fainter and its total exposure time is almost a factor of two shorter.
The intrinsic error of the RVs based on LR spectra is slightly larger and ranges from 11 km s-1 (grism 1028z, panel f) to 10 km s-1 (grism 1400V, panel g). The difference between the FORS2 data sets is expected. The first two lines of the CaT, at the typical RV of Carina stars, are contaminated by atmospheric OH emission lines. Therefore, the RV measurements based either on low-resolution spectra or on medium-resolution, low S/N ratio spectra might be affected by slightly larger uncertainties in case the sky lines are not precisely subtracted. The reader, interested in a more detailed discussion, is referred to Nonino et al. (2007) and to Walker et al. (2007). Moreover, the 1028z spectra have a number of repeats that are approximately a factor of two smaller than the number of repeats of the 1400V spectra (see §2).
The fraction of objects for which we measured the RV is quite high, and indeed the fraction ranges from 98% for GHR and GMR03 spectra, to 90% for LR (1400V) spectra and to more than 80% for GMR08 and LR (1028z) spectra. Typically the stars with no RV measurements have either low S/N or noisy spectra (see §2) or missing identification in the photometric catalog. Eventually, the RV was measured in 2,165 out of the 2,323 GIRAFFE spectra (93%) and in 381 out of the 429 (89%) FORS2 spectra (see Fig. 3). In total the RV was measured in 1,812 stars using GIRAFFE spectra and in 324 stars using FORS2 spectra (see Fig. 1). The final catalog includes RV measurements for 1,979 stars.
To validate the approach adopted to measure the RVs, we decided to use real spectra. This approach has several indisputable advantages when compared with artificially generated spectra, since the different spectroscopic data sets we are dealing with partially overlap. We can constrain the precision of RVs based on HR spectra, since for each object we have three spectra with similar spectral resolutions and covering three different wavelength regions (HR10, HR13, HR14A, see §2). The panels a) and b) of Fig. 4 show the internal comparison of our RV measurements as a function of the V-magnitude. The difference and the RV dispersion of the entire sample and of the candidate Carina stars (red dots, 180RV260 km s-1, see §4) are minimal.
We can also constrain the precision of the GMR03 spectra, since this subsample has more than three dozens of stars in common with the GHR spectra. The panel c) shows the difference between the RVs based on the GHR and those based on the GMR03 spectra (weighted mean). The mean (biweight) of the difference is 0.1 km s-1 for the candidate Carina stars (26) and smaller than 1 km s-1 for the entire sample (35). The GMR03 RVs were corrected for the difference.
The panel d) shows the difference between the RVs based on GHR plus GMR03 (weighted mean) spectra and RVs based on GMR08 spectra. We have more than 120 stars in common and all of them are candidate Carina stars. The difference is smaller than –3 km s-1 and the 8 km s-1. The difference with the RVs based on GMR03 spectra is mainly due to the fact that the GMR08 spectra have a lower S/N ratio and are on average fainter. The GMR08 RVs were corrected for the difference.
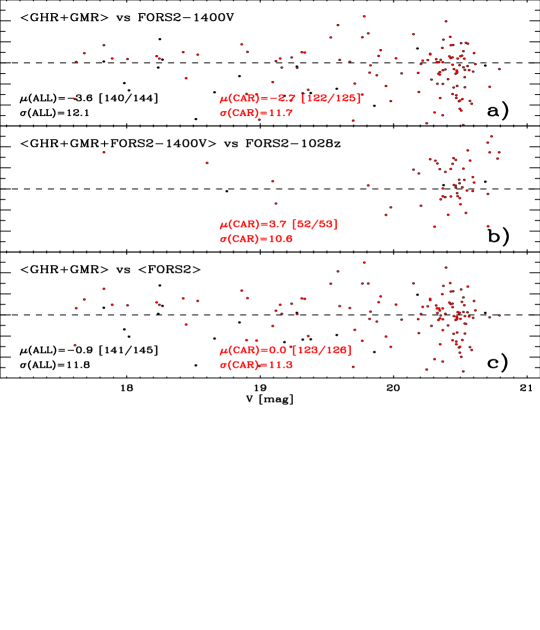
The panel a) of Fig. 5 shows the difference between the RVs based on the GIRAFFE (GHR+GMR, weighted mean) spectra and on the FORS2-1400V spectra (internal comparison). The mean difference (biweight) over the entire sample of stars in common (140/144) is –3.6 km s-1 and smaller (–2.7 km s-1) for the candidate Carina stars (122/125), while the dispersion is of the order of 12 km s-1. The RVs based on FORS2-1400V were accordingly corrected. The panel b) shows the difference between the RVs based on GIRAFFE and on FORS2 (GHR+GMR + 1400V, weighted mean) and RVs based on FORS2-1028z spectra. The difference in RV and dispersion are similar to the RVs based on the 1400V grism and they were also corrected. Data plotted in panel c) show the difference between the RVs based on the GIRAFFE (GHR+GMR, weighted mean) and on the FORS2 (1028z+1400V, weighted mean) spectra after the corrections have been applied. The two samples have more than 140 stars in common and the difference is 1 km s-1 for the entire sample and vanishing for candidate Carina stars.
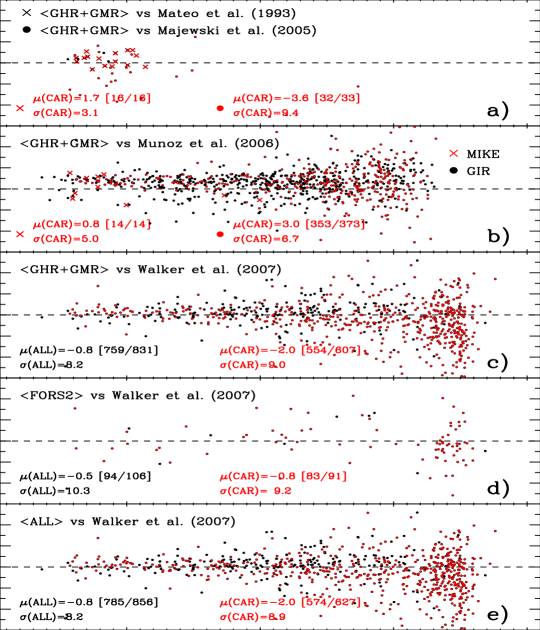
The Fig. 6 shows the comparison between our RVs based on GIRAFFE spectra –GHR+GMR– with different RV measurements available in the literature (external comparison). The panel a) shows the comparison with the RVs based on echelle (+2D at LCO2.5m, Mateo et al. 1993, crosses) and on multi-fiber spectra (HYDRA at CTIO 4m Blanco, Majewski et al. 2005, filled circles). The difference with the Mateo sample is quite small both in the mean (biweight) and in the velocity dispersion. The difference with the Majewski sample is larger (=–3.6, =9.4 km s-1), and it is caused by the lower S/N ratio of the spectra they adopted to estimate the RVs.
The panel b) shows the comparison between our RVs and RVs based either on high-resolution spectra collected with MIKE at Magellan (crosses) or on medium-resolution spectra collected with GIRAFFE at VLT (filled circles) provided by Muñoz et al. (2006). The MIKE spectra were collected in slit mode with a resolution of 19,000 (red arm) and the RV measurements are based on the NIR calcium triplet. The GIRAFFE spectra adopted by Muñoz et al. (2006) are the same GMR03 spectra we also included in this investigation. The difference with RVs based on MIKE spectra is minimal (1 km s-1), but the sample of stars in common is limited (14). The difference with the RVs based on GIRAFFE spectra is larger 3 km s-1 if we account for the entire sample of stars in common (850/889 stars, =5.7 km s-1) and for candidate Carina stars (353/373 stars, =6.7 km s-1). The reasons for this difference are not clear, apart from the fact that we adopted a different approach to prereduce the spectra and to measure the RVs.
The panel c) shows the comparison with the RVs provided by W07. The RV measurements provided by W07 are based on high-resolution (20,000–25,000) spectra collected with MMFS at Magellan. These spectra sample the region across the magnesium triplet (5140–5180Å). We have more than 550 candidate Carina stars in common and the data plotted in this panel show that the two samples of RV measurements agree, within the errors quite well. The difference is –2 km s-1 (biweight) and the RV dispersion is smaller than 10 km s-1. The same outcome applies to the RVs based on FORS2 spectra (see panel d). We have more than 80 candidate Carina stars in common and the difference is 1 km s-1, while the dispersion 11 km s-1.
We ended up with a data set including RV measurements for 1979 stars. For the objects with RVs based on both GIRAFFE and FORS2 spectra we performed a weighted mean, using as weights the inverse square of the radial velocities standard errors of the GMR, GHR and LR spectra. As a final test, we compared our entire RV data set with the RVs provided by W07. Data plotted in panel e) further support the agreement between the two different sets of RV measurements, and indeed the difference ranges from less than 1 km s-1 for the entire sample (785 objects in common) to 2 km s-1 for candidate Carina stars (574), while the dispersion is 9 km s-1. The estimates of the mean difference are based, once again, on the biweight and the number of neglected objects is smaller than 9%. The precision of both internal and external validations, and in particular the good agreement with the RVs provided by W07, support the approach we adopted to measure the RVs.
The referee asked us to comment the impact of binaries stars on the current RV measurements. The occurrence of binary stars among RG stars in dSph galaxies is a highly debated topic and their impact on the RV dispersion ranges from a sizable (Queloz et al. 1995) to a small error (Olszewski et al. 1996; Hargreaves et al. 1996) when compared with the statistical error. However, in a recent investigation Minor et al. (2010) found, by using a detailed statistical approach, that dSph galaxies with RV dispersions ranging from 4 to 10 km s-1can be inflated by no more than 20% due to the orbital motion of binary stars. It is worth noting that the current LR spectra cover a time interval of three years (2004-2007) and the number of repeats ranges from two to 14 (only eleven stars with a single spectrum). The GMR spectra cover a time interval of five years (2003-2008) and the number of repeats ranges from two to 35 (only 1 star with a single spectrum). The GHR spectra were collected in 2005 and the number of repeats ranges from seven to nine. The three different data sets have 145 objects in common. This means that a significant fraction of stars in our sample have spectra collected on a time interval of several years. Therefore, the current RV measurements are less prone to significant changes caused by binary stars. Moreover, the conclusions of the current investigation are minimally affected by a possible uncertainty of the order of 20% in the RV dispersion.
4. Carina radial velocity distribution
The top panel of Fig. 7 shows the RV distribution of the entire (GIRAFFE+FORS2) data set. The well defined primary peak located at RV220 km s-1 includes candidate Carina stars. The current radial velocity distribution is soundly supported by the radial velocity distribution recently provided by W07, but based on a smaller number of stars (see the middle panel of Fig. 7). This evidence and the minimal difference in the RV of the stars in common allowed us to merge the two RV catalogs. For the objects in common weighted mean RVs were computed using as weights the inverse square standard errors in the individual RV measurements. We ended up with a sample of 2,629 stars (see the bottom panel of Fig. 7).
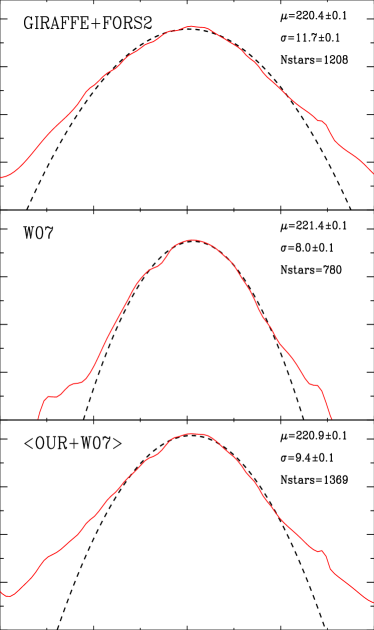
To further constrain the radial velocity distribution of the candidate Carina stars we ran a Gaussian kernel on each star with a equal to the RV uncertainty. The solid red line plotted in the top panel of Fig. 8 was computed by summing the individual Gaussians over the entire data set. We estimated the mean and the by fitting the smoothed RV distribution with a Gaussian (dashed black line). We found that the peak (220.40.1 km s-1) in the RV distribution agrees quite well, within the errors, with similar estimates available in the literature (Koch et al. 2006; Muñoz et al. 2006; Walker et al. 2007, 2009). The same outcome applies to the RV dispersion. Note that current estimate is based on a homogeneous sample of candidate Carina stars (180RV260 km s-1, 4, 1208 stars) that is 55% larger than any previous sample of RVs.
The middle panel of Fig. 8 shows the RV distribution of candidate Carina stars, but based on the RV measurements (780 candidate Carina stars) provided by W07. The two data sets provide, within the errors, very similar kinematic properties. Note that by merging the two data sets of RV measurements we ended up, according to the quoted selection criterion, with a sample of 1378 candidate Carina stars. This sample of Carina RVs is 75% larger than any previous RV sample. To overcome subtle uncertainties in the estimate of the RV due to the possible presence of outliers in the final data set, we estimated the biweight mean of this sample and we found 220.90.1 km s-1. This estimate is based on 1369 stars and this is the sample that we will adopt in the following to estimate the RV distribution (red line in the bottom panel of Fig. 8). The mean based on the Gaussian fit (dashed line) agrees quite well with the biweight mean. However, the tails of the smoothed RV distribution appear shallower than the tails of the fitting Gaussian. There is also evidence that the low-velocity tail might be shallower than the high-velocity one. To provide a more quantitative estimate, we estimated the of the two curves, and we found that the hypothesis that the smoothed distribution is Gaussian can be discarded at 99% confidence level.
The referee has expressed concerns about the possible dependence of the Carina RV distribution on the different samples of RV measurements. To constrain this effect we estimated the RV distribution of Carina stars using stars brighter than V=20.25 mag (651). We fit the smoothed distribution with a Gaussian and we found a mean RV =221.30.1 km s-1 and a =8.70.1 km s-1. We also performed a new test including only stars brighter than V=20.50 mag (1050) and we found =220.90.1 km s-1 and a =8.90.1 km s-1. The quoted values agree quite well with the estimates based on the entire sample. The two RV distributions based on smaller samples of brighter objects also show asymmetric wings when compared with a Gaussian distribution.
To further constrain the plausibility of the selection criterion to pin point candidate Carina stars, we plotted the kinematic candidates in the V,B–I (left panel of Fig. 9) and in the V,V–I (right panel of Fig. 9) CMDs. The symbols of the different spectroscopic data sets are the same as in Fig. 1. Data plotted in this figure show quite clearly the accuracy of the kinematic selection, and indeed the bulk of the candidate Carina stars are located along the expected evolutionary sequences (RG, RC, HB, blue plume). The new sample also provides a clear separation between RG and Asymptotic Giant Branch (AGB, V20, B–I1.6–1.9 mag) stars. Moreover and even more importantly, data plotted in Fig. 9 soundly support the results recently provided by Bono et al. (2010) concerning the metallicity distribution of Carina stars. The quoted authors found, using a color-color plane (U–V, B–I) to select candidate Carina stars, that the spread in color of RG stars is significantly smaller than suggested by spectroscopic measurements. The very narrow distribution in color of candidate Carina RGs is further supported by the kinematic selection. There are a few RGs that attains colors redder than typical Carina RGs. They might be either variables stars or misidentified objects.
5. Discussion
In order to constrain whether the occurrence of asymmetries in the radial velocity distribution is caused by the presence of substructures in Carina, we investigated the change in the RV distribution as a function of the projected radial distance (). To avoid spurious fluctuations in the mean RV, we ranked all the candidate Carina stars as a function of and estimated the mean (biweight) and the median using the first 200 objects. The of each subsample was estimated as the mean over the individual distances of the same 200 stars. We estimated the same quantities by moving of one object in the ranked list until we accounted for the most distant 200 stars in our sample located inside the tidal radius (28.83.6′, Mateo 1998). The error on the mean RV for individual bins is smaller than one tenth of km s-1. In order to provide robust constraints on the possible uncertainties introduced by the number of stars per bin and by the number of stepping stars we performed a series of MonteCarlo simulations. The estimated mean dispersion is plotted as cyan shaded area across the RV mean in the bottom panel of Fig. 10. Note that changes in the binning criteria can change the extent of the secondary features, but their relative positions are minimally affected.
A glance at the data plotted in the bottom panel of Fig. 10 shows that the mean RV attains a well defined minimum –RV219.5 km s-1– for 7′ (200 pc)888Projected distance on Carina were estimated assuming a true distance modulus of 20.100.12 mag (Dall’Ora et al. 2003; Pietrzyński et al. 2009) together with the inclination angle and the axes ratio (Mateo 1998). from the galaxy center and increases up to 222.60.4 km s-1 for 13′ (400 pc, 6 level) and a plateau of 221.40.4 km s-1 at larger distances (600 pc, 4 level). This evidence is robust, since the mean (biweight, black line) and the median (blue line) attain very similar values and intrinsic errors. To further constrain the change of the kinematic status across the body of the galaxy we also estimated the radial velocity dispersion (, solid line middle panel of Fig. 10). Note that to avoid subtle uncertainties caused by asymmetric radial velocity distributions we also estimated for each bin the semi-interquartile range (SIQ, dashed-dotted line in the middle panel of Fig. 10). Data plotted in the middle panel of Fig. 10 show that both the and the SIQ show very similar radial trends, but the former dispersion parameter attains values that are 50% larger. The difference indicates that the velocity dispersion should be cautiously treated in dealing with asymmetric RV distributions (Strigari et al. 2010). We also found that the dispersion is larger in the innermost regions, decreases in coincidence of the minimum in the mean RV and after a mild increase attains an almost constant value in the outermost galaxy regions. Note that the cyan shaded areas across the RV dispersion and the SIQ display the intrinsic error on individual bin according to MonteCarlo simulations. There is a hint that the dispersion could increase in the outskirts, thus supporting the finding by W07. However, more data are required to constrain the change in the projected radial velocity dispersion across the tidal radius.
Interestingly enough, the kurtosis plotted in the top panel of Fig. 10 shows a mirror trend compared with the projected radial velocity dispersion and with the mean RV. This evidence is suggesting that in the Carina regions where the mean RV is smaller, the dispersion is also smaller and the radial velocity distribution more centrally peaked. The opposite trend characterizes the regions in which the mean RV is larger. The outermost regions show flat trends in the quoted parameters. Evidence of kinematic and photometric substructures have already been found in several LG dwarfs (Monelli et al. 2003; Kleyna et al. 2004; Walker et al. 2009). In particular, Battaglia et al. (2008) found evidence of a radial velocity gradient in Sculptor, that they interpreted as an indication of internal rotation. The current data indicate that the RV distribution across the body of Carina shows a radial gradient and possible evidence of rotation. However, the RV distribution is far from being uniform, possibly suggestive of the occurrence of well defined spatial substructures.
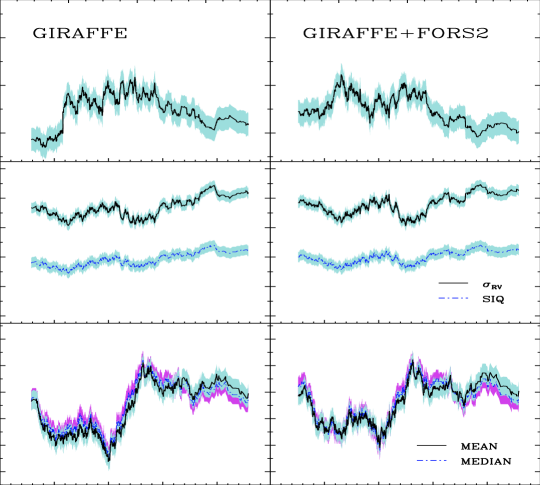
The referee has expressed concerns about the approach we adopted to estimate the weighted mean between the GIRAFFE and the FORS2 spectra. To clarify this key point, Fig. 11 shows the same data of Fig. 10, but the parameters plotted in the left panels are only based on the GIRAFFE spectra, while those plotted in the right panels are based on the weighted mean between GIRAFFE and FORS2 spectra. The trends of the plotted parameters as a function of the radial distance are the same. They are only slightly more noisy due to the decrease in the sample size.
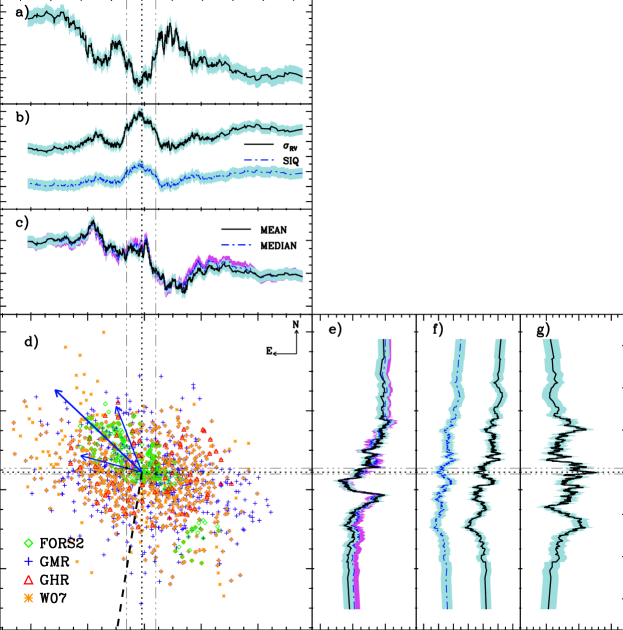
To further constrain the spatial extent of possible kinematic substructures we investigated the same parameters, but they were estimated as a function of right ascension () and declination (). Data plotted in panel c) of Fig. 12 show the marginal of the radial velocity along the right ascension axis. We found that the mean RV, when moving from E (750 pc from the galaxy center) to W (–1060 pc from the center), decreases from 221.90.4 to 219.80.4 km s-1. The difference is equal to 2.1 km s-1 (4 level) and increases by almost a factor of two (4.5 km s-1, 9 level) if we take into account the absolute maximum (223.30.4 km s-1, 320 pc from the center) and the absolute minimum (218.80.4 km s-1, -280 pc from the center) of the mean RV.
It is worth mentioning that the increase in the mean velocity both in the external regions and outside the galactic center appears to be in the same direction of the Carina proper motion (large blue arrow in panel d) of Fig. 12, Piatek et al. 2003; Walker et al. 2009). However, the uncertainty affecting current estimates of the Carina proper motion is quite large (see small blue arrows). Note that the increase in the mean RV cannot be in the direction of the Galactic center (heavy dashed line). Moreover and even more importantly, we found that in a region of 200 pc across the galactic center the RV shows a secondary maximum that is strongly correlated with the velocity dispersion (panel b) and anticorrelated with the kurtosis (panel a).
The change in the mean RV along the declination axis is similar to the change in the right ascension axis. The mean RV decreases, when moving from N to S (panel e), from 221.90.4 (630 pc from the center) to 219.80.4 km s-1 (-650 pc from the center). The difference is at least at 4 level, while the difference between maximum and minimum (222.30.4 km s-1, 238 pc; 219.10.4 km s-1, 41 pc) is more than 3 km s-1(7 level). The absolute minimum is located close to the center in the IV quadrant and associated to the absolute minimum in RA. The radial trend outside this region shows the quoted secondary maximum and a constant smooth trend at larger distances from the center. The dispersion (panel f) and the kurtosis (panel g) are once again correlated/anticorrelated with the behavior of the mean RV. It is noteworthy, that the quoted findings are minimally affected by the FORS2, GIRAFFE and W07 data sets adopted to estimate the RVs of candidate Carina stars.
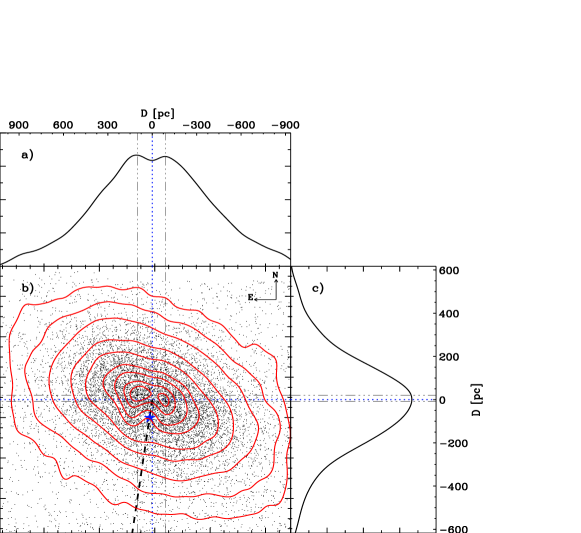
To explain the occurrence of a kinematically cold population close to the center of Sextans, Kleyna et al. (2004) suggested, using also photometric radial distributions, that it could be the aftermath of a merging with a globular cluster. To further constrain the nature of the above kinematic peculiarities we investigated the Carina radial distributions, using the same approach adopted by Monelli et al. (2003) and the recent photometric catalog by Bono et al. (2010). The isocontour levels (panel b) and the marginal (panel a) along the right ascension axis plotted in Fig. 13 show that the radial distribution is flat-topped across the Carina center. Note that the bright field star HD48652 (V=9.14 mag) minimally affects this feature, since it is located at 2′.77 from the Carina center. On the other hand, the radial distribution is symmetric and with a well defined peak along the declination axis. We drew three vertical lines across the center and the two secondary maxima. Interestingly enough, the same lines include the secondary maximum detected along the right ascension axis in the mean RV. These empirical evidence indicates that the regions across the galaxy center might form a substructure probably reminiscent of a transition between a bulge-like and/or a disk-like substructure.
6. Summary and conclusions
We presented new radial velocity measurements of Carina dSph stars based on low-resolution spectra (R2500) collected with the FORS2 multi-object slit spectrograph at the VLT. The key advantage of the current sample is that for the first time we collected spectra of old (HB, V20.75 mag), intermediate (RC, V20.5 mag) and young (BP, V22 mag) stellar tracers. The bulk of the spectra were collected using the 1400V grism covering the and the MgI triplet. For a fraction (20%) of these targets we also collected spectra using the 1028z grism centered on the NIR CaT. We secured 856 spectra of 359 stars with 20 hours of exposure time.
The above data were complemented by medium (R6500) and high-resolution (R18000–23000) spectra collected with the GIRAFFE multi-object fiber spectrograph at the VLT. The targets of this spectroscopic data set are RG and RC stars (V20.6 mag). The medium resolution spectra are centered on the NIR CaT, while the high-resolution ones cover a broad wavelength region (53006700 Å). In total this data set includes 20,488 spectra of 1931 stars collected with 168 hours of exposure time.
The radial velocity distribution based on the above spectra agrees quite well with similar data available in the literature. By assuming candidate Carina stars the objects with RVs ranging from 180 to 260 km s-1 (4) we ended up with a sample of 1,210 stars. By fitting these objects with a Gaussian we found a mean RV –RV=220.40.1 km s-1– and a velocity dispersion –=11.70.1 km s-1– that agree, within the errors, with similar measurements provided by Walker et al. (2007).
The above kinematic selection was firmly supported by the position of the candidate Carina stars along the expected evolutionary sequences (RG, AGB, RC, HB, Blue Plume) of the CMD. The narrow distribution in color of the candidate Carina RG stars confirms the recent findings by Bono et al. (2010), based on photometric selection criteria, that the spread in metallicity of Carina stars is smaller than suggested by spectroscopic measurements (Koch et al. 2006).
The current catalog of Carina RV measurements was complemented by similar measurements recently provided by Walker et al. (2007). The stars in common were averaged and we ended up with a sample of 1,370 RV measurements of candidate Carina stars that is 75% larger than any previous Carina RV sample. We found that the hypothesis that the Carina RV distribution is Gaussian can be discarded at the 99% confidence level. A more detailed investigation of the RV across the body of the galaxy indicates that the mean RV changes from 220 km s-1 at a distance of 7′ (200 pc) from the center to 223 km s-1 at 13′ (6 level) and attains an almost constant value of 221–222 km s-1 at larger distances (3–5 level). Moreover, we found that in the Carina regions where the mean RV is smaller the dispersion also attains smaller values and the RV distribution is more centrally peaked (larger kurtosis).
The mean RV at large distances from the galactic center decreases, when moving from E to W, by more than 2 km s-1 (4 level). The difference increases by almost a factor of two (4 km s-1, 9 level) if we account for the difference between the absolute maximum and the absolute minimum of the mean RV. The change in the mean RV, when moving from N to S, is similar. The difference increases from more than 2 km s-1 (4 level) in the outermost regions to more than 3 km s-1 (7 level) across the galaxy center. The RV gradient appears to be in the direction of the Carina proper motion. However, this parameter is still affected by large uncertainties to reach a firm conclusion.
Furthermore, there is also evidence of a secondary maximum in RV across the Carina center (200 pc). The occurrence of a secondary feature across the Carina center is also supported by the flat-topped radial distribution (photometric catalog) along the right ascension axis. In particular, the two secondary maxima cover the same galaxy regions of the secondary maximum in the RV radial variation. These results, once independently confirmed, are probably reminiscent of a substructure with transition properties.
Evidence of substructures in dwarf galaxies dates back to Jerjen et al. (2000) who detected a spiral structure in the Virgo dE IC3328 using deep, ground-based R-band images. This discovery was soundly confirmed by Lisker et al. (2007) who found that a significant fraction of bright () early-type dwarfs in Virgo are characterized by disk-like features (spiral arms, bars). Furthermore, they also found that the properties of dE in clusters are also correlated with environmental density. This evidence supports numerical simulations of galaxy harassment indicating that late-type galaxies undergo a significant transformation when accreted in a cluster (Mastropietro et al. 2005; Kormendy et al. 2009). It was also suggested that dEs with disk-like features might be the low-luminosity tail of normal disk galaxies (Lisker et al. 2006). This working hypothesis was recently supported by new and accurate kinematical data of IC3328 suggesting that the observed velocity dispersion is the aftermath of two distinct substructures, namely a thin stellar disk and a dynamically hot component. However, no robust conclusion could be reached due to limited radial coverage (Lisker & Fuchs 2009).
Irregular kinematic properties have also been found in the recently discovered ultra-faint dwarf galaxy –Willman I– by Willman et al. (2010) using both photometric and spectroscopic data. They found that galaxy stars located in innermost regions show a radial velocity offset of 8 km s-1 when compared with the outermost ones. Moreover, they also found initial hints of asymmetries in the radial velocity distribution, but their spectroscopic sample is too small to reach firm conclusions.
If the complex kinematic properties of Carina will be supported by future more accurate and deep data sets then the occurrence of disk-like features might be considered a wide spread property of gas-poor dwarf galaxies. A detailed comparison between observed and predicted radial velocity distribution and radial velocity dispersion profile is required to constrain the nature of Carina kinematics.
References
- Appenzeller et al. (2008) Appenzeller et al. 1998, The Messenger 94, 1
- Andrews et al. (1972) Andrees, D. F., Bickel, P. J., Hampel, F. R., Rogers, W. H. & Tukey, J. W. 1972, Robust Estimates of Location: Survey and Advances (Princeton: Princeton University Press)
- Battaglia et al. (2008) Battaglia, G., Helmi, A., Tolstoy, E., Irwin, M., Hill, V., & Jablonka, P. 2008, ApJ, 681, L13
- Beers et al. (1990) Beers, T. C., Flynn, K., & Gebhardt, K. 1990, AJ, 100, 32
- Belokurov et al. (2006) Belokurov, V., et al. 2006, ApJ, 647, L111
- Bono et al. (2010) Bono, G., et al. 2010, PASP, 122, 651 (paper III)
- Bouchard et al. (2005) Bouchard, A., Jerjen, H., Da Costa, G. S., & Ott, J. 2005, AJ, 130, 2058
- Cole (2009) Cole, A. A. 2010, PASA, 27, 234
- Dall’Ora et al. (2003) Dall’Ora, M., et al. 2003, AJ, 126, 197 (paper I)
- Ferrarese et al. (2006) Ferrarese, L., et al. 2006, ApJS, 164, 334
- Gavazzi et al. (2005) Gavazzi, G., Donati, A., Cucciati, O., Sabatini, S., Boselli, A., Davies, J., & Zibetti, S. 2005, A&A, 430, 411
- Hargreaves et al. (1996) Hargreaves, J. C., Gilmore, G., & Annan, J. D. 1996, MNRAS, 279, 108
- Helmi et al. (2006) Helmi, A., et al. 2006, ApJ, 651, L121
- Jerjen & Binggeli (1997) Jerjen, H., & Binggeli, B. 1997, The Nature of Elliptical Galaxies; 2nd Stromlo Symposium, 116, 239
- Jerjen et al. (2000) Jerjen, H., Kalnajs, A., & Binggeli, B. 2000, A&A, 358, 845
- Kelson (2003) Kelson, D. 2003 PASP, 115,688
- Kirby et al. (2008) Kirby, E. N., Simon, J. D., Geha, M., Guhathakurta, P., & Frebel, A. 2008, ApJ, 685, L43
- Kleyna et al. (2003) Kleyna, J. T., Wilkinson, M. I., Gilmore, G., & Evans, N. W. 2003, ApJ, 588, L21
- Kleyna et al. (2004) Kleyna, J. T., Wilkinson, M. I., Evans, N. W., & Gilmore, G. 2004, MNRAS, 354, L66
- Koch et al. (2006) Koch, A., Grebel, E. K., Wyse, R. F. G., Kleyna, J. T., Wilkinson, M. I., Harbeck, D. R., Gilmore, G. F., & Evans, N. W. 2006, AJ, 131, 895
- Kormendy (1985) Kormendy, J. 1985, ApJ, 292, L9
- Kormendy (1987) Kormendy, J. 1987, Structure and Dynamics of Elliptical Galaxies, 127, 17
- Kormendy et al. (2009) Kormendy, J., Fisher, D. B., Cornell, M. E., & Bender, R. 2009, ApJS, 182, 216
- Lisker et al. (2006) Lisker, T., Grebel, E. K., & Binggeli, B. 2006, AJ, 132, 497
- Lisker et al. (2007) Lisker, T., Grebel, E. K., & Binggeli, B. 2007, IAU Symposium, 235, 118
- Lisker & Fuchs (2009) Lisker, T., & Fuchs, B. 2009, A&A, 501, 429
- Łokas et al. (2008) Łokas, E. L., Klimentowski, J., Kazantzidis, S., & Mayer, L. 2008, MNRAS, 390, 625
- Łokas (2009) Łokas, E. L. 2009, MNRAS, 394, L102
- Majewski et al. (2005) Majewski, S. R.,Muñoz, R. R., Westfall, K. B., & Patterson, R. J. 2005, Stellar Astrophysics with the World’s Largest Telescopes, 752, 194
- Mastropietro et al. (2005) Mastropietro, C., Moore, B., Mayer, L., Debattista, V. P., Piffaretti, R., & Stadel, J. 2005, MNRAS, 364, 607
- Mateo (1998) Mateo, M. L. 1998, ARA&A, 36, 435
- Mateo et al. (1993) Mateo, M., Olszewski, E. W., Pryor, C., Welch, D. L., & Fischer, P. 1993, AJ, 105, 510
- Mateo et al. (1998) Mateo, M., Hurley-Keller, D., & Nemec, J. 1998, AJ, 115, 1856
- Mateo et al. (2008) Mateo, M., Olszewski, E. W., & Walker, M. G. 2008, ApJ, 675, 201
- Minor et al. (2010) Minor, Q. E., Martinez, G., Bullock, J., Kaplinghat, M., & Trainor, R. 2010, ApJ, 721, 1142
- Monelli et al. (2003) Monelli, M., et al. 2003, AJ, 126, 218 (paper II)
- Monelli et al. (2010a) Monelli, M., et al. 2010, ApJ, 720, 1225
- Monelli et al. (2010b) Monelli, M., et al. 2010, ApJ, 722, 1864
- Muñoz et al. (2006) Muñoz, R. R., et al. 2006, ApJ, 649, 201
- Nonino et al. (2007) Nonino, M., et al. 2007, in The Future of Photometric, Spectrophotometric and Polarimetric Standardization, ed. C. Sterken, (San Francisco: ASP), 364, 295
- Ochsenbein et al. (2000) Ochsenbein, F., Bauer, P., & Marcout, J. 2000, A&AS, 143, 221
- Olszewski et al. (1996) Olszewski, E. W., Pryor, C., & Armandroff, T. E. 1996, AJ, 111, 750
- Pasquini et al. (2002) Pasquini, L. et al. 2002, The Messenger 110, 1
- Pedicelli et al. (2010) Pedicelli, S., et al. 2010, A&A, 518, A11
- Piatek et al. (2003) Piatek, S., Pryor, C., Olszewski, E. W., Harris, H. C., Mateo, M., Minniti, D., & Tinney, C. G. 2003, AJ, 126, 2346
- Pietrzyński et al. (2009) Pietrzyński, G., Górski, M., Gieren, W., Ivanov, V. D., Bresolin, F., & Kudritzki, R.-P. 2009, AJ, 138, 459
- Queloz et al. (1995) Queloz, D., Dubath, P., & Pasquini, L. 1995, A&A, 300, 31
- Romaniello et al. (2008) Romaniello, M., et al. 2008, A&A, 488, 731
- Sanna et al. (2009) Sanna, N., et al. 2009, ApJ, 699, L84
- Skillman et al. (1989) Skillman, E. D., Terlevich, R., & Melnick, J. 1989, MNRAS, 240, 563
- Strigari et al. (2010) Strigari, L. E., Frenk, C. S., & White, S. D. M. 2010, MNRAS, 408, 2364
- Tolstoy et al. (2001) Tolstoy, E. et al., 2001, MNRAS, 327, 918
- Tolstoy et al. (2009) Tolstoy, E., Hill, V., & Tosi, M. 2009, ARA&A, 47, 371
- Walker et al. (2007) Walker, M. G., Mateo, M., Olszewski, E. W., Gnedin, O. Y., Wang, X., Sen, B., & Woodroofe, M. 2007, ApJ, 667, L53 (W07)
- Walker et al. (2009) Walker, M. G., Mateo, M., & Olszewski, E. W. 2009, AJ, 137, 3100
- Wilkinson et al. (2004) Wilkinson, M. I., Kleyna, J. T., Evans, N. W., Gilmore, G. F., Irwin, M. J., & Grebel, E. K. 2004, ApJ, 611, L21
- Wilkinson et al. (2006) Wilkinson, M. I., Kleyna, J. T., Wyn Evans, N., Gilmore, G. F., Read, J. I., Koch, A., Grebel, E. K., & Irwin, M. J. 2006, EAS Publications Series, 20, 105
- Willman et al. (2010) Willman, B., Geha, M., Strader, J., Strigari, L. E., Simon, J. D., Kirby, E., & Warres, A. 2010, AJ, submitted, arXiv:1007.3499
- Woo et al. (2008) Woo, J., Courteau, S., & Dekel, A. 2008, MNRAS, 390, 1453
- Wyse (2010) Wyse, R. F. G. 2010, AN, 331, 526
- Zucker et al. (2006) Zucker, D. B., et al. 2006, ApJ, 650, L41


| Date | Pointing | aaRight Ascension (J2000), the units are hours, minutes and seconds. | bbDeclination (J2000), the units are degrees, arcminutes and arcseconds. | Grism | E.T.ccExposure time (seconds). | SeeingddInitial and final DIMM seeing (arcseconds) during the exposure time. |
|---|---|---|---|---|---|---|
| 17-Feb-2004 | s3 | 06:41:41.0 | -50:56:03.6 | 1400V | 1360 | 0.69-0.79 |
| 17-Feb-2004 | l3 | 06:41:39.0 | -50:55:35.7 | 1400V | 4200 | 0.55-0.84 |
| 18-Feb-2004 | s3 | 06:41:41.1 | -50:56:03.3 | 1400V | 1360 | 0.75-0.80 |
| 18-Feb-2004 | l3 | 06:41:38.9 | -50:55:35.0 | 1400V | 4200 | 0.78-0.83 |
| 20-Feb-2004 | l4 | 06:41:27.3 | -50:57:13.0 | 1400V | 4200 | 0.43-0.76 |
| 20-Feb-2004 | s4 | 06:41:26.8 | -50:57:31.4 | 1400V | 1360 | 0.43-0.47 |
| 21-Feb-2004 | l4 | 06:41:27.4 | -50:57:12.6 | 1400V | 4200 | 0.52-0.68 |
| 21-Feb-2004 | l3 | 06:41:38.9 | -50:55:34.9 | 1400V | 4200 | 0.55-1.51 |
| 22-Feb-2004 | l5 | 06:40:51.0 | -51:07:56.4 | 1400V | 4200 | 0.77-0.83 |
| 23-Feb-2004 | s3 | 06:41:41.1 | -50:56:03.3 | 1400V | 1360 | 1.27-1.77 |
| 23-Feb-2004 | s2 | 06:42:00.5 | -50:50:27.3 | 1400V | 1360 | 1.26-1.59 |
| 13-Mar-2004 | s3 | 06:41:41.0 | -50:56:03.5 | 1400V | 1360 | 1.10-1.14 |
| 06-Dec-2004 | l1 | 06:42:04.0 | -50:53:21.2 | 1400V | 1800 | 0.35-0.66 |
| 06-Dec-2004 | l1 | 06:42:04.0 | -50:53:21.2 | 1028z | 1500 | 0.38-0.60 |
| 07-Dec-2004 | l1 | 06:42:04.0 | -50:53:21.2 | 1400V | 2700 | 0.49-0.73 |
| 07-Dec-2004 | l1 | 06:42:04.0 | -50:53:21.2 | 1028z | 900 | 0.51-0.54 |
| 08-Dec-2004 | s1 | 06:42:06.0 | -50:54:00.0 | 1400V | 1800 | 0.80-0.92 |
| 09-Dec-2004 | l2 | 06:42:04.7 | -50:49:57.3 | 1400V | 2400 | 0.42-0.44 |
| 09-Dec-2004 | l2 | 06:42:04.7 | -50:49:57.3 | 1028z | 1200 | 0.53-0.59 |
| 11-Dec-2004 | l2 | 06:42:04.7 | -50:49:57.3 | 1400V | 2400 | 0.55-0.56 |
| 14-Mar-2007 | f3 | 06:41:35.4 | -50:55:55.2 | 1400V | 8130 | 0.48-0.65 |
| 15-Mar-2007 | f3 | 06:41:35.5 | -50:55:55.1 | 1400V | 2710 | 0.70-1.67 |
| 15-Mar-2007 | f3reeThe pointings f3 and f3r are the same, but the latter was rotated by 180 degrees (Nonino et al. 2011, in preparation). | 06:41:31.5 | -50:56:35.5 | 1400V | 5420 | 1.02-1.16 |
| 16-Mar-2007 | f3reeThe pointings f3 and f3r are the same, but the latter was rotated by 180 degrees (Nonino et al. 2011, in preparation). | 06:41:31.5 | -50:56:35.6 | 1400V | 8130 | 0.51-0.95 |