Detection of C60 in the proto-planetary nebula IRAS 01005+7910
Abstract
We report the first detection of buckminsterfullerene (C60) in a proto-planetary nebula (PPN). The vibrational transitions of C60 at 7.0, 17.4, and 18.9 m are detected in the Spitzer/IRS spectrum of IRAS 01005+7910. This detection suggests that fullerenes are formed shortly after the asymptotic giant branch but before the planetary nebulae stage. A comparison with the observations of C60 in other sources is made and the implication on circumstellar chemistry is discussed.
1 Introduction
Fullerenes, together with other forms of carbon such as graphite, diamonds, and carbynes, are expected to be a important components of the interstellar medium (Henning & Salama, 1998). The most stable fullerene is buckminsterfullerene (C60) which has a soccer-ball like structure (Kroto et al., 1985). Fullerenes have been proposed as possible carriers of diffuse interstellar bands (e.g. Kroto et al., 1985; Léger et al., 1988), the origin of which is a long-standing mystery (see Herbig, 1995, for a review). Foing & Ehrenfreund (1994) found that the laboratory spectrum of C in argon and neon matrices shows approximate matches with two diffuse interstellar bands in the near infrared spectra of stars. Possible formation processes of fullerenes in space that have previously been discussed include condensation in supernova gas, shock-induced decomposition of hydrogenated amorphous carbon grains, cold interstellar gas-phase chemistry, etc (see Moutou et al., 1999; Sellgren et al., 2010, and references there in). The carbon-rich hydrogen-poor circumstellar envelopes, such as Wolf-Rayet (WR) stars and R Coronae Borealis stars, have also been proposed as favorable sites for the synthesis of fullerenes (Cherchneff. et al., 2000; Goeres et al., 1992). However, none of these theoretical predictions have been confirmed observationally.
The search for fullerenes in space started soon after their synthesis in the laboratory. The early efforts to search for the electronic transitions of C60 in the optical and UV wavelengths have resulted in no definite evidence showing its presence in space (e.g. Snow & Seab, 1989; Herbig, 2000; Sassara et al., 2001). Another approach is to search for the infrared vibrational modes of the molecule (Clayton et al., 1995). Kwok et al. (1999) noted a faint feature at 17.85 and 18.90 m in the ISO-SWS spectrum of the proto-planetary nebula (PPN) IRAS 07134+1005 and suggested that they could correspond to the and vibrational modes of the C60 molecule. However, these features are not confirmed by subsequent Spitzer observations. A search of these bands in the reflection nebula NGC 7023 with ISO was also not successful (Moutou et al., 1999). Only very recently, C60 was unambiguously detected in the planetary nebula (PN) Tc 1 (Cami et al., 2010) and the reflection nebulae NGC 7023 and NGC 2023 (Sellgren et al., 2010). This was followed by the detections of C60 in four more PNs (García-Hernández et al., 2010).
These detections of C60 in objects at the late stages of stellar evolution raise the concrete question of how C60 is formed in circumstellar environment. Since the element C is synthesized in Asymptotic Giant Branch (AGB) stars and many C-based molecules have been detected in the outflow of AGB stars, it is reasonable to expect the C60 can also be one of the products of circumstellar molecular synthesis. Laboratory results show that the formation efficiency of fullerenes depends on the content of hydrogen and this has led to the suggestion by Cami et al. (2010) that under hydrogen-poor environment, the formation of C60 is favored, and otherwise the chemical pathway favors the formation of Polycyclic Aromatic Hydrocarbon (PAH) molecules. This scenario is supported by the fact that the infrared spectrum of Tc 1 does not exhibit the aromatic infrared bands (AIBs) commonly assigned to as arising from PAH molecules. However, contrary to this scenario, C60 was detected in hydrogen-containing PNs showing the AIBs (García-Hernández et al., 2010). The detection of C60 in NGC 7023 (Sellgren et al., 2010), an object with strong AIB emissions, also confirms that C60 and the AIB carriers can coexist. As an alternative explanation, García-Hernández et al. (2010) suggested that both PAH molecules and fullerenes are formed from the destruction of hydrogenated amorphous carbon (HAC), and the non-detection of AIBs in Tc 1 is due to the longer survival time of C60 molecules. A search for C60 in a large sample of R Coronae Borealis (R Cor Bor) stars was performed by García-Hernández et al. (2011). C60 is clearly detected in one of the R Cor Bor stars showing AIBs, but C60 is absent in the most hydrogen-poor ones. These results further support the premise that fullerene and the carrier of the AIBs can coexist.
PPNs are the descendants of the asymptotic giant branch (AGB) stars and the immediate precursors of PNs (Kwok, 1993). The changes of infrared spectroscopic properties in AGB stars, PPNs, and PNs have been known as a consequence of evolution (Kwok, 2004). Thus PPNs can provide a unique opportunity to investigate the formation history of C60 in circumstellar envelopes. We have obtained infrared spectra of a sample of PPNs (Zhang et al., 2010) which cover the wavelengths of four C60 vibrational transitions at 7.0 (), 8.5 (), 17.4 (), and 18.9 m () (Nemes et al., 1994). These spectra therefore can serve as a platform to search for C60 in PPNs.
In this paper we report a new detection of C60 in a PPN, IRAS 01005+7910. Unlike the other sources in our sample, IRAS 01005+7910 does not show the 21-m feature and its central star has a higher temperature ( K), suggesting that it a PPN about to enter the PN stage (Zhang et al., 2010). Hu (2002) classified it as a B2 Ie star with V magnitude of 10.85. Its hydrogen Balmer lines show P Cygni profiles. Through a study of the high-resolution spectrum, Klochkova et al. (2002) concluded that it is a carbon-rich PPN with a luminosity at a distance about 3 kpc.
2 Data
The study makes use of the infrared spectra retrieved from the Spitzer Heritage Archive (SHA) 111http://sha.ipac.caltech.edu/applications/Spitzer/SHA/. The observations were conducted with the Infrared Spectrograph (IRS; Houck et al. 2004) on the Spitzer Space Telescope (Spitzer; Werner et al., 2004) in 2004 and 2006. We have carried out a systematic search for C60 in the ten PPNs studied by Zhang et al. (2010) and found that among the studied sample IRAS 01005+7910 is the unique one that clearly exhibits the C60 features. The spectra of IRAS 01005+7910 was obtained with the short-wavelength low-resolution module (SL; 5–14.5 m) as part of the program 30036 (PI: G. Fazio), and the short-wavelength high-resolution module (SH; 9.5–19.5m) as part of the program 93 (PI: D. Cruikshank). Details of the data processing have been described elsewhere (e.g. Hrivnak et al., 2009; Cerrigone et al., 2009) and are not repeated here. However, no observation utilizing long-wavelength high-resolution module (LH; 18.7–37.2 m) was made for IRAS 01005+7910.
3 Results
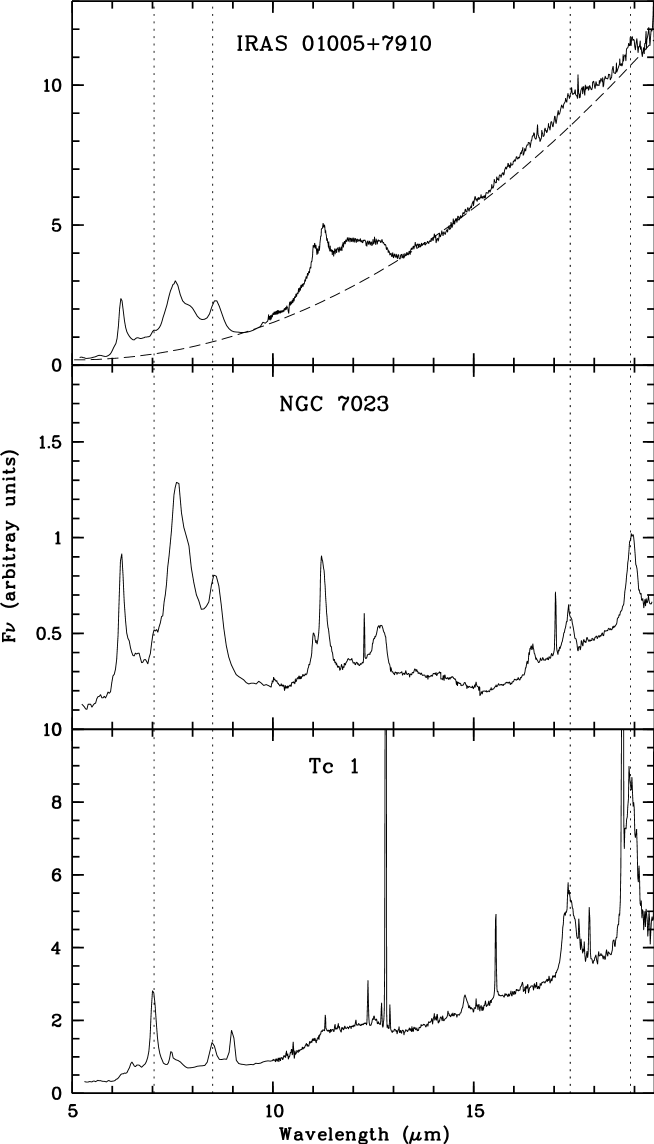
Figure 1 shows that the Spitzer/IRS spectrum of IRAS 01005+7910 is dominated by a thermal dust continuum, the 11.5 m SiC emission, the aromatic infrared bands (AIBs) at 6.2, 7.7–7.9, 8.6, 11.3, and 12.7 m, and the 15–20 m plateau feature. The AIB and the broad plateau emission features have been previously detected and discussed by Cerrigone et al. (2009) and Zhang et al. (2010). In this paper, we report the detection of the C60 features at , , and m. The fourth expected C60 feature at 8.5 m feature is badly blended with the AIB 8.6 m feature. These C60 features have a width of m, much broader than the spectral resolution. The measured widths of the C60 features are similar to those seen in other PNs (see Table 1, García-Hernández et al., 2010). These C60 features are not found in any other PPNs in our sample. This suggests that these features likely share a common origin, and thus strengthens the identification of C60 as their carrier.
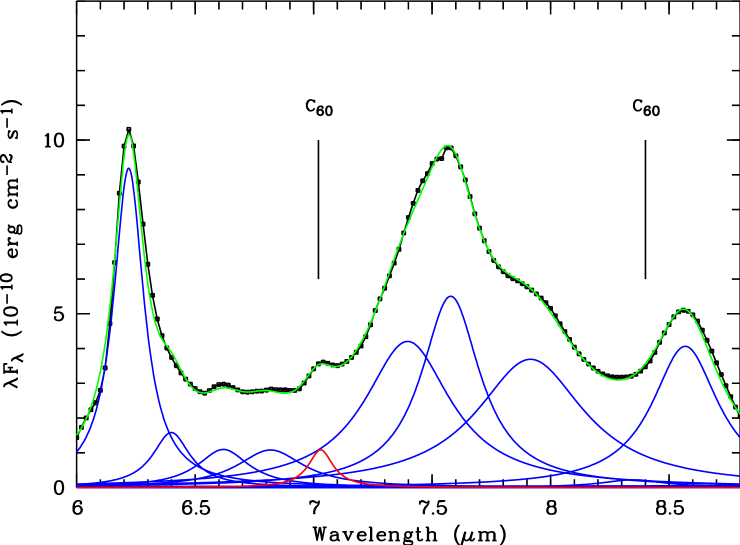
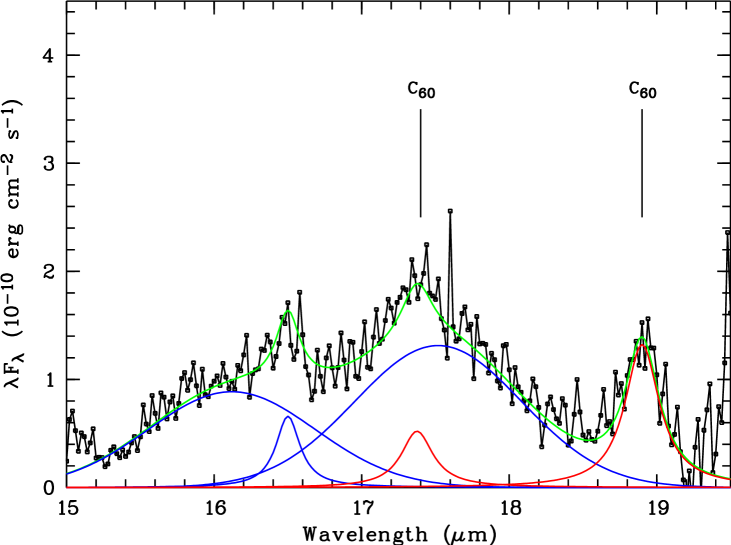
The continuum was fitted using the feature-free spectral regions, and was subtracted from the observed spectrum. As the features in PPN spectra are usually broad and blended with each other, we conducted a spectral decomposition using the IDL package PAHFIT developed by Smith et al. (2007) in order to accurately measure the feature fluxes. Drude profiles are assumed for the AIBs and C60 features. The actual profile of the 15–20 m plateau, where C60 17.4 and 18.9 m features are superimposed, is poorly known. We have assumed two broad Gaussian profiles having a width of 1.3 m and peaked at 16.1 and 17.5 m for the plateau (this causes only slight uncertainty in the flux measurements since the C60 features are much narrower than the plateau). For the fitting, we have taken into account the AIBs at 6.2, 6.4, 6.6, 6.8, 7.4, 7.6, 7.9, 8.3, 8.6, and 16.5 m. Figures 2 and 3 give the zoomed-in view of these C60 features and the fitting results. From the fitting results, we derived fluxes of W/m2, W/m2, and W/m2 for the C60 7.0, 17.4, and 18.9 m features, respectively. The errors of the fluxes were estimated using the full covariance matrix of the least-squares parameters. Sellgren et al. (2010) found that the C60 m transition in the spectrum of NGC 7023 is partially blended with an AIB feature. If this is also the case for IRAS 01005+7910, the estimated strength of the m feature would be the upper limit.
Hrivnak et al. (2000) presented the ISO-SWS spectrum of IRAS 01005+7910 covering a wavelength range of 2.4–45.4 m. Due to the lower sensitivity of the ISO SWS compared to the IRS, the C60 features are completely overwhelmed by the noise in the ISO spectrum. However, a strong feature at 30 m is detected by ISO, and its presence was subsequently confirmed by the Spitzer/IRS spectrum (Cerrigone et al., 2009; Zhang et al., 2010). This seems to support the finding by García-Hernández et al. (2010) that all the C60 sources exhibit the 30 m feature. However, this correlation only applies to circumstellar sources as the Spitzer archive spectra of the reflection nebulae NGC 2023 and NGC 7023 (program 40276, PI: K. Sellgren) do not show the 30 m feature. The 30 m feature is commonly seen in carbon-rich AGB stars, PPNs, and PNs (Forrest et al., 1981; Volk et al., 2002), and has been attributed to solid magnesium sulfide (MgS; Goebel & Moseley, 1985). However, the identification of MgS as the carrier of the 30 m feature is debatable as this feature is only detected in carbon-rich sources. Recently, Zhang et al. (2009) found that the MgS dust mass in circumstellar envelopes is not enough to account for the observed feature strength. Therefore, carbonaceous compounds might be more likely to be the carrier of the 30 m feature. In order to establish a connection between the 30 m feature with the C60 features, more C60 sources need to be discovered.
In Figure 1, we compare the Spitzer/IRS spectra of IRAS 01005+7910 with two other C60 sources, NGC 7023 (Sellgren et al., 2010) and Tc 1 (Cami et al., 2010). All three sources have a strong infrared excess and IRAS 01005+7910 and Tc 1 have a very red (low color temperature) continuum. IRAS 01005+7910 and NGC 7023 show strong AIB features, which are absent in Tc 1. The fact that IRAS 01005+7910 does not show the narrow atomic lines as seen in the spectrum of Tc 1 is consistent with the object being a PPN and its central star is not hot enough to ionize the surround envelope. After subtracting the continuum, we found that the spectral shape of IRAS 01005+7910 is similar to that of NGC 7023. Cami et al. (2010) also detected a few weaker C70 features in Tc 1, which are not seen in IRAS 01005+7910 and NGC 7023. Assuming that all the sources have the same C70/C60 strength ratio, the C70 features in IRAS 01005+7910 should be well below the detection limit.
4 Discussion
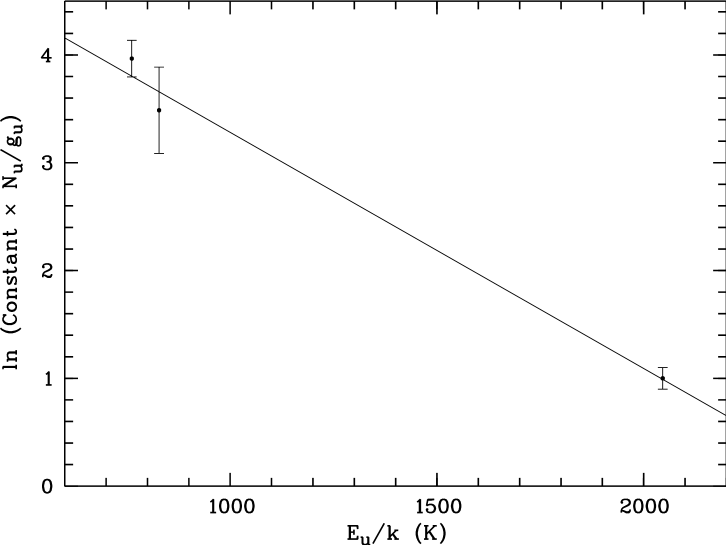
The relative intensities of the C60 lines reflect the excitation conditions of the molecule. Assuming a thermal distribution of the vibrational states, Cami et al. (2010) determined the excitation temperature of Tc 1 to be K, and suggested that the C60 molecules are in a solid. Similar temperature values were also derived in the PNs studied by García-Hernández et al. (2010). Using a similar procedure as Cami et al. (2010) and García-Hernández et al. (2010), we have constructed a vibrational diagram for IRAS 01005+7910 from the observed fluxes of the three C60 lines (Figure 4). An excitation temperature of K is derived.
The C60 line ratios in IRAS 01005+7910 are and , which are very close to the values found by in NGC 7023 ( and ; Sellgren et al., 2010). Since the central star of IRAS 01005+7910 has a similar temperature as NGC 7023 ( K), it is possible that the C60 molecules in IRAS 01005+7910 and NGC 7023 are excited in a similar manner. Sellgren et al. (2010) suggests that C60 molecules in NGC 7023 are in the gas phase and they are excited by UV photons from the central star followed by radiative cascade. If this is also the case for IRAS 01005+7910, then the excitation temperature derived above is just a representation of population distribution and is not related to other physical quantities such as kinetic temperature of the gas.
Laboratory measurements show that the wavelengths of gas-phase C60 bands shift with temperature (Frum et al., 1991; Nemes et al., 1994). The positions of the four infrared bands , , , and shifts from 6.97, 8.40, 17.41, and 18.82 at 0 K to 7.11, 8.55, 17.53, 18.97 at 1000 K, respectively. Our measurements show that the wavelengths of all C60 bands in IRAS 01005+7910 lie inside these ranges. Assuming that the frequencies of the C60 bands have a linear dependence on the temperature, we can estimate the temperature as 100–600 K. The observed widths of the C60 features are about 0.3 m (see Section 3), which correspond to a wavenumber width of 60 cm-1 and 10 cm-1 for the 7 and 17.4/18.9 m bands respectively. These values can be compared with the laboratory measured widths of about 13 cm-1 of gas-phase C60 (Frum et al., 1991), suggesting that a gas-phase origin of the molecule cannot be ruled out.
We estimate the abundance of C60 following the same method of Sellgren et al. (2010) by calculating the total strength ratios between the C60 and AIB features and assuming that the carrier of the AIB features to contain % of interstellar carbon (Cerrigone et al., 2009). The strength ratio of C60 to AIB emission is 0.01 in the observed wavelength range of IRAS 01005+7910, resulting in a percentage of carbon in C60 of . This value is slightly lower than those obtained in NGC 7023 (Sellgren et al., 2010) and the PN SMP SMC 16 (García-Hernández et al., 2010), but a factor of 25 lower than that of Tc 1 estimated by Cami et al. (2010).
With the detection of C60 in circumstellar envelopes, the next question is how they are formed. In the laboratory, C60 can be effectively produced from the vaporization of graphite in a hydrogen-poor environment. Cami et al. (2010) proposed that fullerenes are produced only in hydrogen-poor envelopes created by a late AGB thermal pulse. However, García-Hernández et al. (2010) argued that C60 can be synthesized under hydrogen-containing environment. As shown in Figure. 1, the spectrum of IRAS 01005+7910 exhibits both hydrogen-containing AIBs and C60 features, supporting the latter hypothesis. García-Hernández et al. (2010) also suggested that both C60 and PAHs are the products of decomposition of HACs. In this scenario, photochemical processing can lead to dehydrogenation of the dust grains and form PAHs and C60 molecules (Scott et al., 1997). On the other hand, the dehydrogenation of dust grains can also induce the formation of H2 in the grain surfaces (e.g. Fleming et al., 2010). The strongest H2 line in the observed wavelength range is the 0–0 S(0) transition at 28 m. This line is not detected in the spectrum of IRAS 01005+7910 (Hrivnak et al., 2000; Cerrigone et al., 2009; Zhang et al., 2010). Moreover, we have detected H2 in two PPNs with no detectable C60 (Zhang et al., 2010). Because of this lack of correlation between the presence of H2 and C60, we are unable to give addition support for the idea that the formation of C60 is the result of dehydrogenation of HACs.
Our detection suggests that fullerenes can be formed in the PPN stage. So far, there is no definite detection of C60 in AGB stars. Although Clayton et al. (1995) noted a possible emission feature centered at 8.6 m in the spectrum of the bright AGB star IRC+10216, the other C60 features were not detected in the ISO-SWS spectrum (Cernicharo et al., 1999). The circumstellar spectra of AGB stars are dominated by silicates or silicon carbide emission features (Kwok et al., 1997). Although there are a small number of AGB stars exhibiting AIBs, the AIBs mainly emerge in the post-AGB phase. Is it possible that the formation of C60 is related to the emergence of the AIB features? Sellgren et al. (2010) found the C60 and AIB emissions in NGC 7023 have different spatial distributions and attributed this to the effect of UV-excitation. It can be argued that the C60 and the AIB carriers are already present in the AGB phase of evolution but are not excited until the stars evolve to the PPN phase. However, comparisons between the spectra of AGB stars, PPNs, and PNs suggest a sequence of molecular synthesis, with acetylenes forming in the late AGB phase, leading to the formation of diacetylenes, triacetylenes, and benzene in the PPN phase (Kwok, 2004). Since these molecules are detected in absorption, the question of excitation does not arise. Since benzene is the first step toward the synthesis of aromatic materials, we can say with confidence that aromatic compounds only form after the AGB. If C60 molecules are synthesized during the AGB, they should be detectable with absorption spectroscopy.
5 Conclusions
The detection of C60 in a PPN as reported in this paper, together with the detection of this molecule in 5 PNs, confirm that the late stages of stellar evolution is a phase of active molecular synthesis. Beginning with simple diatomic molecules such as CO, CN, C2, dozens of gas-phase organic molecules have been seen in the stellar winds from AGB stars. The formation of acetylene during the late AGB phase is believed to lead to the formation of benzene in the post-AGB phase of evolution. This also coincides with the first detection of vibrational modes of aromatic and aliphatic compounds. From this study, we now learn that gas-phase C60 molecules may also form during the same epoch. As the number of C60 detection increases, we would be in better position to study the relationships between C60 and the carriers of other spectral features such as the AIBs, and 21- and 30-m features.
The detection of C60 in the outflows from evolved stars also raises the possibility of the molecule being detected in the diffuse interstellar medium as the molecule is stable and should be able to survive journeys through the interstellar medium (Foing & Ehrenfreund, 1994). The fact that a large variety of presolar grains (e.g., SiC) have been detected in meteorites (Zinner, 1998) raises the possibility that presolar C60 can be incorporated into comets and asteroids and be detected in meteorites. In fact, C60 and C70, as well as higher fullerenes, have been detected in the Allende meteorite (Becker et al., 1999). The evidence for stellar synthesis of C60 in the late stages of stellar evolution as presented in this paper therefore adds further support to the idea of chemical enrichment of the Solar System by stellar molecular products.
References
- Becker et al. (1999) Becker, L., Bunch, T. E., Allamandola, L. J., 1999, Nature, 400, 6741
- Cami et al. (2010) Cami, J., Bernard-Salas, J., Peeters, E., & Malek, S. E. 2010, Science, 329, 1180
- Cernicharo et al. (1999) Cernicharo, José, Yamamura, I., González-Alfonso, E., de Jong, T., Heras, A., Escribano, R., Ortigoso, J. 1999, ApJ, 526, L41
- Cerrigone et al. (2009) Cerrigone, L., Hora, J.L., Umana, G., Trigilio, C. 2009, ApJ, 703, 585
- Cherchneff. et al. (2000) Cherchneff, I., Le Teuff, Y. H., Williams, P. M., & Tielens, A. G. G. M. 2000, A&A, 357, 572
- Clayton et al. (1995) Clayton, G. C., Kelly, D. M., Lacy, J. H., Little-Marenin, I. R., Feldman, P. A., & Bernath, P. F. 1995, AJ, 109, 2096
- Fleming et al. (2010) Fleming, B., France, K., Lupu, R. E., & McCandiss, S. R. 2010, arXiv:1010.0007
- Foing & Ehrenfreund (1994) Foing, B. H. & Ehrenfreund, P. 1994, Nature, 369, 296
- Forrest et al. (1981) Forrest, W. J., Houck, J. R., & McCarthy, J. F. 1981, ApJ, 248, 195
- Frum et al. (1991) Frum, C. I., Engleman, R. J., Heddericha, H. G., Bernath, P. F., Lambb, L. D., & Huffmanb, D. R. 1991, Chem. Phys. Lett. 176, 504
- García-Hernández et al. (2010) García-Hernández, D. A., Manchado, A., García-Lario, P., Stanghellini, L., Villaver, E., Shaw, R. A., Szczerba, R., Perea-Calderón, J. V. 2010, ApJ, 724, 39L
- García-Hernández et al. (2011) García-Hernández, D.A., Kameswara Rao, N., Lambert, D.L. 2011, ApJ, in press
- Goebel & Moseley (1985) Goebel, J. H., & Moseley, S. H. 1985, ApJ, 290, L35
- Goeres et al. (1992) Goeres, A., & Sedlmayr, E. 1992, A&A, 265, 216
- Henning & Salama (1998) Henning, T., & Salama, F. 1998, Sci, 282, 2204
- Herbig (1995) Herbig, G. H. 1995, ARA&A, 33, 19
- Herbig (2000) Herbig, G. H. 2000, ApJ, 542, 334
- Houck et al. (2004) Houck, J. R. et al. 2004, ApJS, 154, 18
- Hrivnak et al. (2000) Hrivnak, B. J., Volk, K., & Kwok, S. 2000, ApJ, 535, 275
- Hrivnak et al. (2009) Hrivnak, B. J., Volk, K., & Kwok, S. 2009, ApJ, 694, 1147
- Hu (2002) Hu, J.-Y. 2002, ChJAA, 2, 193
- Klochkova et al. (2002) Klochkova, V. G., Yushkin, M. V., Miroshnichenko, A. S., Panchuk, V. E., & Bjorkman, K. S. 2002, A&A, 392, 143
- Kroto et al. (1985) Kroto, H. W., Heath, J. R., Obrien, S. C., Curl, R. F., & Smalley, R. E. 1985, Nature, 318, 162
- Kwok (1993) Kwok, S. 1993, ARA&A, 31, 63
- Kwok (2004) Kwok, S. 2004, Nature, 430, 985
- Kwok et al. (1997) Kwok, S., Volk, K., & Bidelman, W.P. 1997, ApJS, 112, 557
- Kwok et al. (1999) Kwok, S., Volk, S., & Hrivnak, B. J. 1999, A&A, 350, L35
- Léger et al. (1988) Léger, A., D’Hendecourt, L., Verstraete, L., & Schmidt, W. 1988, A&A, 203, L145
- Moutou et al. (1999) Moutou, C., Sellgren, K., Verstraete, L. & Léger, A. 1999, A&A, 347, 949
- Nemes et al. (1994) Nemes, L. et al. 1994, Chem. Phys. Let. 218, 295
- Sassara et al. (2001) Sassara, A., Zerza, G., Chergui, M., & Leach, S. 2001, ApJS, 135, 263
- Scott et al. (1997) Scott, A., Duley, W. W., & Pinho, G. P. 1997, ApJ, 489, L193
- Sellgren et al. (2010) Sellgren, K., Werner, M. W., Ingalls, J. G., Smith, J. D. T., Carleton, T. M., & Joblin, C. 2010, ApJ, 722, L54
- Smith et al. (2007) Smith, J. D. T. et al. 2007, ApJ, 656, 770
- Snow & Seab (1989) Snow, T. P., & Seab, C. G. 1989, A&A, 213, 291
- Volk et al. (2002) Volk, K., Kwok, S., Hrivnak, B. J., & Szczerba, R. 2002, ApJ, 567, 412
- Werner et al. (2004) Werner, M., et al. 2004, ApJS, 154, 1
- Zhang et al. (2009) Zhang, K, Jiang, B. W., & Li, A. 2009, ApJ, 702, 680
- Zhang et al. (2010) Zhang, Y., Kwok, S., & Hrivnak, B. J. 2010, ApJ, 725, 990
- Zinner (1998) Zinner, E. 1998, Annual Review of Earth and Planetary Sciences, 26, 147