Crystal and magnetic structure of the superconductor CeNi0.8Bi2
Abstract
We have performed powder neutron diffraction on the new superconductor, CeNi0.8Bi2 with a superconducting transtion temperature 4.2 K. The structural parameters of this compound at room temperature are determined by Rietveld analysis. Below about 5 K, the clear magnetic Bragg peaks with propagation vector =(0 0 0) are observed. The observed intensities of magnetic Bragg peaks can be explained by the magnetic structure that the two Ce moments in the unit cell are antiparallel along axis. The magnetic Bragg peaks are observed in the superconducting state, indicating the coexistence of the antiferromagnetic ordering and the superconductivity in this compound. The intensity of magnetic Bragg peak monotonously increases with decreasing temperature below and does not exhibit apparent anomaly at , obviously different from cases of heavy fermion superconductors in which the magnetic ordering and the superconductivity coexist, for example, Cd-doped CeCoIn5. These results suggest that the 4 electron of the Ce atom is not coupled with the superconducting carrier, and the magnetic ordering is almost independent of the superconductivity in CeNi0.8Bi2.
pacs:
74.25.Ha, 75.25.-j, 61.05.F-, 61.66.FnI Introduction
An iron-based superconductor was first discovered in the LaFeAsO system with a so-called ZrCuSiAs-type structure whose superconductivity is induced by partial substitution of flourine for oxygen.kamihara After this discovery, the development of new materials with an Fe layer in which the superconductivity is considered to appear, have been performed, resulting in the discoveries of other iron-based superconductors, such as the so-called 122 system,rotter FeSe1-xTex,hsu LiFeAs,wang and so on. On the other hand, new superconductors with a ZrCuSiAs-type structure which consist of elements other than Fe are also explored, for example, La1-xSrxNiAsOfang . Recently, Mizoguchi and his collaborators have discovered the superconductivity in CeNi0.8Bi2 with a superconducting transition temperature 4.2 K.mizoguchi
Series compounds CeMBi2 and CeMSb2 have ZrCuSiAs-type structures with space group of corresponding to the so-called 1111 system, where M is a transition metal element such as Mn, Fe, Ni, Cu, Ag, and so on.flandorfer For CeMBi2, Bi1, M, Ce and Bi2 sites correspond to As, Fe, rare earth element and O sites, respectively. The ”parent” compound of CeNi0.8Bi2, CeNiBi2 is a moderately heavy fermion antiferromagnet ; magnetic ordering appears at about 5 K and the electronic specific heat coefficient is relatively large (470 mJ/K2 mol).onuki This parent compound does not exhibit a superconductivity although the electric conductivity is metallic down to the lowest temperature.onuki ; jung
The superconductivity is induced by the deficiency of Ni atom,mizoguchi as the superconductivity in the iron-based superconductor of the so-called 1111 system is induced by oxygen-deficiency.kito The resistivity and superconducting shielding signal in the magnetic field show the superconducting transition at about 4.2 K. At about 5 K, specific heat exhibits a jump of 4 J/K mol. This jump may be attributed to the magnetic ordering of the Ce 4 moment because the entropy estimated by an integration of below 5 K corresponds with ln2, which is expected from the twofold degenerated ground state of the Ce 4 electron. The clear jump of the specific heat is not observed at around because the jump caused by the superconducting transition is much smaller than the jump caused by the magnetic ordering, suggesting that the charge carrier which causes the superconductivity is not coupled with the Ce 4 electron and the mass is not enhanced.mizoguchi
If the Ce 4 electron is coupled with the superconducting carrier in the present compound, the magnetic fluctuation of 4 electron can induce the unconventional superconducting order parameter. In such a case, temperature dependence of the magnetic Bragg peak should have some anomaly at . Then we have performed powder neutron diffraction measurements on CeNi0.8Bi2 in order to investigate the existence of the coupling between the Ce 4 electron and the superconducting carrier. First, we present the structural parameters determined by Rietveld analysis in Sec. IIIA. The elecrtonic state of this compound discussed in Ref. 6 is based on the present result. In Sec. IIIB, we report the magnetic structure and the temperature dependence of the ordered moment of the Ce 4 moment. Our results suggest that the Ce 4 electron does not contribute to the superconductivity in this compound, consistent with the suggestion in ref. 6.
II Experiments
For the compound of CeNixBi2, we found through a series of synthesis experiments that samples synthesized by conventional solid state reaction have a constant Ni-deficiency of x=0.8.mizoguchi A powder sample of CeNi0.8Bi2 for the present neutron measurements was prepared by following method. Ce, Ni and Bi powders with a nominal composition of CeNi0.8Bi2 were used as starting materials. The mixed powder was evacuated in a silica tube and heated at 500 ℃ for 10 h and 750 ℃ 20 h. The obtained powder was ground and pressed into pellets, and it was heated 800 ℃ for 10 h in the evacuated silica tube. Inductively coupled plasma (ICP) spectroscopy was used to confirm the chemical composition, CeNi0.8Bi2, which was consistent with the nominal composition. The sample appears stable thermally in a dry box or an evacuated glass tube, but decomposes in an hour when exposed to an ambient atmosphere. This decomposition would be induced by the reaction of an unusual valence state of Bi ions in the material with water vapor in the atmosphere. Thus, we paid attention so as to avoid decomposition or degradation of the sample. The sample of about 14.3 g was used in neutron diffraction measurements. Electric resistivity and superconducting shielding measurements confirm that value and a volume fraction of shielding signal are the same as the values reported in ref. 6.
The powder neutron diffraction pattern for the analysis on a crystal structure was collected by using the high-resolution powder diffractometer (HRPD) installed in the reactor JRR-3 of Japan Atomic Energy Agency (JAEA). The neutron wavelength was 1.8234 and the collimation was open (effective value of 35’)-40’-S-6’ (S denotes sample). The pattern was collected at room temperature. The powder sample was set in a vanadium holder enclosed in Al cans filled with He gas in order to avoid the decomposition in the atmosphere. Diffraction data for the analysis on the magnetic structure were collected by using the triple-axes spectrometer TAS-2 in reactor JRR-3 of JAEA. The neutron wavelength used was 2.3590 and the collimation was 14’-40’-S-40’-80’. The sample enclosed in Al can was mounted in a closed-cycle refrigerator.
III Results and Discussions
III.1 Analysis of crystal structure
Figure 1 shows the neutron powder diffraction pattern of CeNi0.8Bi2 obtained from the HRPD.
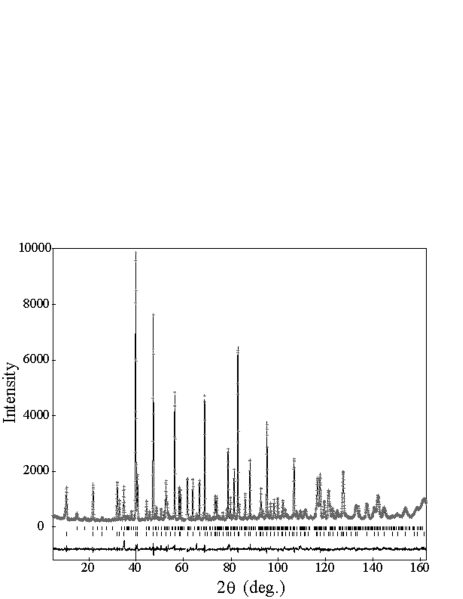
The observed data are shown by crosses. Structural analysis on the neutron powder diffraction pattern is performed by using the program RIETAN2000.izumi The space group of is used because we know that the series compounds of CeMBi2 and CeMSb2 have same structure as, shown in Sec. I. The diffraction pattern is analyzed including NiBi3, NiBi and Ni as impurities. Because a small peak which can not be assigned by above impuries is observed at 2 61.2 °, the intensity data in the 2 range of 60.9-61.5 ° are excluded in the analysis. The occupation factor of Ni is fixed at 0.8 which is determined by ICP spectroscopy. The obtained structural parameters of CeNi0.8Bi2 are shown in Table I.
| Atom | Site | Occ. | (Å2) | |||
|---|---|---|---|---|---|---|
| Ce | 2 | 1 | 1/4 | 1/4 | 0.2691(3) | 0.83(4) |
| Ni | 2 | 0.8 | 3/4 | 1/4 | 1/2 | 1.83(4) |
| Bi1 | 2 | 1 | 1/4 | 1/4 | 0.6384(2) | 0.92(3) |
| Bi2 | 2 | 1 | 3/4 | 1/4 | 0 | 0.66(4) |
The errors of the parameters shown in the table are mathematical standard deviations obtained by the analysis. The diffraction pattern calculated by using refined parameters is shown in Fig. 1 by solid lines. The calculated line can reproduce the observed data. Mass fractions of the impurities are 9.1 for NiBi3, 1.4 for NiBi and 0.8 for Ni, respectively. The larger thermal parameter of Ni relative to other sites may be due to the impurities.
III.2 Magnetic structure and dependence of ordered Ce moment
Results of 2 scan at 11.2 K and 2.9 K, obtained from TAS-2 are shown in Fig. 2(a) by gray and black lines, respectively.
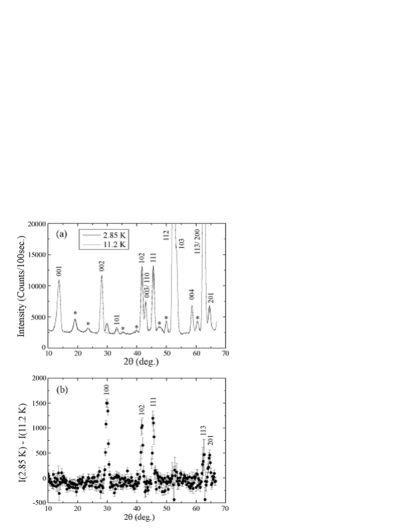
At 2.9 K a clear Bragg peak appears at right-hand side of 002 reflection, corresponding to 100 reflection. The intensities of 102 and 111 reflections are slightly enhanced at 2.9 K. These results show the existence of magnetic ordering at lower temperatures and the coexistence of magnetic ordering and the superconductivity. Figure 2(b) shows the intensity obtained by subtracting the intensity at 11.2 K from the intensity at 2.9 K. Clear magnetic Bragg peaks are observed at lower temperatures at the reciprocal lattice points corresponding to 100, 102, 111, and 201. The data are scattered around 2 53 ° and 63 °, due to large nuclear Bragg intensities of 112/103 and 113/200 reflections whose intensities are about 70000 and 50000 counts at their peak positions, respectively. Magnetic 113 reflection does not have clear peak profile due to the large experimental error mentioned above, although it should have almost the same intensity as the magnetic 201 reflection in the magnetic structure presented below.
From these results, we can consider the magnetic structure at low temperatures. For 10 reflections, the clear magentic Bragg peaks are observed at and they are nearly absent at , indicating that the magnetic moments of two Ce atoms in a unit cell at (1/4 1/4 0.2691) and (3/4 3/4 0.7309) are antiparallel. This intesity modulation of magnetic 10 reflections against also shows that Ni moments are almost independent of the observed magnetic Bragg peaks even if the Ni atoms have magnetic moments. The scattering intensity from the Ni moments should not depend on because two Ni atoms are located on a flat layer at =1/2. In magnetic susceptibility measurements, the contribution of Ni atom to the Curie-Weiss-like susceptibility is nearly absent.mizoguchi2 ; onuki These results suggest that Ni atom is nonmagnetic. The clear peaks are not observed at 00 positions in Fig. 2(b). If the Ce moments are perpendicular to axis, magnetic 00 reflections with must have large intensities. Especially, the intensity of 001 reflection is expected to be about four times as large as the intensity of 100 reflection. The absence of magnetic 00 reflections indicates that the two Ce moments are oriented along axis. It is consistent with the anisotropy of the magnetic susceptibility, indicating that the antiferromagnetic easy-axis is the axis.onuki Then we can get the magnetic structure shown in Fig. 3.
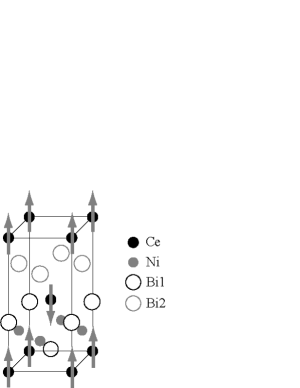
In the figure, Ce atom at (1/4 1/4 0.2691) is located at the origin.
The integrated intensities of observed nuclear and magnetic Bragg reflections, , are shown in Table II. The former intensities are estimated by using the diffraction data at 11.2 K and the latter ones are estimated by using the data shown in Fig. 2(b).
| nuclear Bragg at 11.2 K magnetic Bragg at 2.9 K | |||||
| 0 0 1 | 8354(428) | 10316 | 1 0 0 | 1579(128) | 1594 |
| 0 0 2 | 8354(152) | 8607 | |||
| 1 0 1 | 759(93) | 652 | |||
| 1 0 2 | 7148(301) | 7734 | 1 0 2 | 827(141) | 715 |
| 003/110 | 3643(200) | 3843 | |||
| 1 1 1 | 7490(304) | 5111 | 1 1 1 | 905(149) | 1008 |
| 1 1 2 | 51380(951) | 52171 | |||
| 1 0 3 | 10002(325) | 7569 | |||
| 0 0 4 | 3626(108) | 3520 | |||
| 113/200 | 38757(1001) | 40004 | |||
| 2 0 1 | 2842(231) | 2418 | 2 0 1 | 363(123) | 200 |
The intensities of nuclear Bragg reflections calculated by using the structural parameters shown in table I, , are also shown in right-hand side of in the table. The calculated intensities almost correspond with the observed intensities. To estimate the ordered moment of Ce sites at 2.9 K, the intesities of magnetic reflections obtained from the magnetic structure shown in Fig. 3 are fitted to the observed intensities by using least-squares fitting program. The estimated value of the ordered moment is 1.43(5) . Here, we use the isotropic magnetic form factor of Ce3+.inter The calculated intensities of magnetic Bragg reflections are shown in the right-hand side of the table. The calculated intensities agree with the observed intensities, indicating that present magnetic structure and the obtained ordered moment are reasonable. Although 113 reflection should have the intensity of 200 in the calculation, the observed intensities can not be estimated due to the experimental error, as mentioned above.
The inset of Fig. 4(a) is the temperature () dependence of the peak profile of 100 reflection.
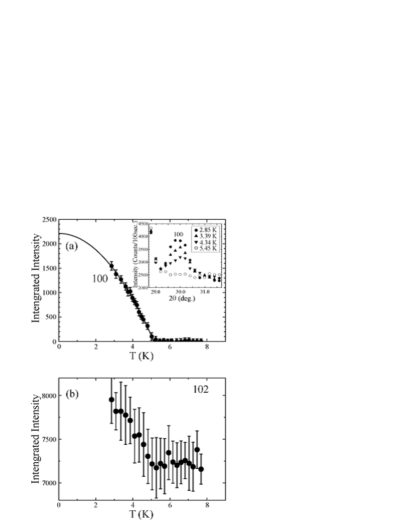
As shown in the inset, 100 reflection appears below 5.45 K and the peak gradually develops with decreasing . Figures 4(a) and 4(b) show the dependences of the integrated intensities of 100 and 102 reflections, respectively. The intensity of 102 reflection has a large error bar in this scale because this reflection includes the nuclear scattering. The intensities of both reflections increase with decreasing below about 5 K, consistent with the temperature at which the jump of the specific heat is observed.mizoguchi As shown in the main panel of Fig. 4(a), the temperature development of the magnetic Bragg intensity is monotonous down to 2.9 K and an anomaly is not observed at the superconducting transtion temperature, 4.2 K. It is quite different from the behaviors observed in heavy fermion superconductors in which the magnetic ordering and the superconductivity coexist. For example, Cd-doped CeCoIn5, CeCo(In1-xCdx)5 with =0.1 and 0.075, exhibit the antiferromagnetic orderings of the Ce moment at Neel temperatures, 3.0 K and 2.5 K, respectively. Superconductivities appear below 1.2 K and 1.7 K, and the antiferromagnetic ordering and the superconductivity coexist below these temperatures.pham In these compounds, the magnetic Bragg peaks appear below and their intensities increase with decreasing . However, the developments of the magnetic Bragg intensities are suppressed and they become almost flat to the temperature below .nicklas ; nair The present dependence of the magnetic Bragg intensity suggests that the Ce 4 electron is almost independent of the superconductivity and this compound is not a heavy fermion superconductor.
The solid line in Fig. 4(a) shows the fitting of data below 5.0 K to the function that the intensity is proportional to and the extrapolation of the fitting function to 0 K. The amplitude of the momtent at 0 K obtained by the fitting is 1.71 . In the experimental accuracy, any structural change is not observed and the tetragonal symmery remains down to 2.9 K. In the tetragonal symmetry, energy levels of the Ce 4 state split into three doublets, , , and , by the crytalline electric field, where the two former doublets consist of linear combination of and states, and the latter consists of state. In the case of CeAgSb2 which also has a ZrCuSiAs-type structure, the ground state is the state, revealed by the measurement of the crytalline electric-field excitation. The amplitude of the antiferromagnetic ordered moment is in good agreement with 0.43 .araki On the other hand, the ordered moment in this compound is much larger than the moment of CeAgSb2, indicating that the ground state of this compound is not the state. Such differences of the amplitude of the ordered moment and/or the ground state are caused by the differences of the structural parameters and constituent elements. Actually, other compounds with a ZrCuSiAs-type structure, CeCuBi2 and CeAgBi2, exhibit antiferromagnetic ordering with easy axes parallel to the direction. Their saturated ordered moments which are estimated by magnetization curves are 1.76 and 2.1 , respectively. These behaviors are similar to the present compound while in CeCuBi2 and CeAgBi2, the superconductivity is not observed and their magnetization curves show metamagnetic behavior which is not observed in the present compound.
CeNi0.8Bi2 has the same crystal structure as the so-called 1111 system which has a maximum of about 55 K among iron-based high- superconductors. Theoretical studies on an iron-based high- superconductor point out that magnetic fluctuation arising from a nesting between Fermi surfaces at and M points in an unfolded Brillioun zone is an origin of the superconductivitymazin ; cvetkovic ; kuroki ; ma . Experimentally, strong corelations between the high- superconductivity and the spin fluctuation are observed in an iron-based high- superconductor. The inelastic neutron scattering measurements on LaFeAsO1-xFx with =0.057, 0.082 and 0.157, show that the spin fluctuation observed in the samples with =0.057 and 0.082, whose are about 30 K, almost disappears in the sample with =0.157 in which the high- superconductivity is almost suppressed.wakimoto On the other hand, the superconductivity may appear without magnetic fluctuation in CeNi0.8Bi2, because Ni is nonmagnetic and the Ce moment is almost decoupled with the superconducting carrier. TheaAbsence of the magnetic fluctuation may indicate that the of CeNi0.8Bi2 is much lower than the values of iron-based superconductors although they have same crystal structures.
IV Summary
We have performed neutron powder diffraction measurements on a new superconductor, CeNi0.8Bi2, with 4.2 K. The structural parameters at room temperature are determined by the Rietveld method. The clear magnetic Bragg peaks are observed at =(0 0 0) below about 5 K. In the magnetic ordering phase, the two Ce moments in the unit cell are antiparallel along the axis and the Ni atom does not contribute to the magnetic Bragg reflections. Below , the superconductivity and antiferromagnetic ordering coexist. The magnetic Bragg intensity monotonously increases with decreasing below about 5 K and does not exbihit an apparent anomaly at 4.2 K, suggesting that the 4 electron of the Ce atom is almost independent of the superconductivity. The saturated ordered moment is about 1.7 .
Acknowledgements.
The authors would like to thank K. Kaneko for his fruitful discussion. This work was supported by the Funding Promgram for World-Leading Innovative R&D on Science and Technology (FIRST), Japan, and also supported by a Grant-in-Aid for Specially Promoted Research 17001001 from the Ministry of Education, Culture, Sports, Science and Technology, Japan.References
- (1) Y. Kamihara, T. Watanabe, M. Hirano, and H. Hosono, J. Am. Chem. Soc. 130, 3296 (2008).
- (2) M. Rotter, M. Tegel, D. Johrendt, Phys. Rev. Lett. 101, 107006 (2008).
- (3) F.-C. Hsu, J.-Y. Luo, K.-W. Yeh, T.-K. Chen, T.-W. Huang, P. M. Wu,Y.-C. Lee, Y.-L. Huang, Y.-Y. Chu, D.-C. Yan, and M.-K. Wu, Natl. Acad. Sci. U.S.A. 105, 14262 (2008).
- (4) X. C. Wang, Q. Q. Liu, Y. X. Lv, W. B. Gao, L. X. Yang, R. C. Yu, F. Y. Li, and C. Q. Jin, Solid State Commun. 148, 538 (2008).
- (5) L. Fang, H. Yang, P. Cheng, X. Zhu, G. Mu and H.-H. Wen, Phys. Rev. B 78, 104528 (2008).
- (6) H. Mizoguchi, S. Matsuishi, M. Hirano, M. Tachibana, E. Takayama-Muromachi, H. Kawaji, and H. Hosono, Phys. Rev. Lett. 106, 057002 (2011).
- (7) H. Flandorfer, O. Sologub, C. Godart, K. Hiebl, A. Leithe-Jasper, P. Rogl, and H. Noël, Solid State Commun. 97, 561 (1996).
- (8) A. Thamizhavel, A. Galatanu, E. Yamamoto, T. Okubo, M. Yamada, K. Tabata, T. C. Kobayashi, N. Nakamura, K. Sugiyama, K. Kindo, T. Takeuchi, R. Settai, and Y. Ōnuki, J. Phys. Soc. Jpn. 72, 2632 (2003).
- (9) M. H. Jung, A. H. Lacerda, and T. Takabatake, Phys. Rev. B 65, 132405 (2002).
- (10) H. Kito, H. Eisaki, and A. Iyo, J. Phys. Soc. Jpn. 77, 063707 (2008).
- (11) F. Izumi and T. Ikeda, Mater. Sci. Forum, 321-324, 198 (2000).
- (12) Magnetic susceptibility of CeNi0.8Bi2 can be fitted by the Curie-Weiss law in the temperature range of 30 300 K. From the Curie constant, the effective moment is 2.80 , which corresponds to the effective moment of single crystal CeNiBi2, 2.88 and 2.60 for and , reported in ref. 8. These values are larger than 2.54 of a free Ce3+ ion. However, if the Ni atom has a local moment and also contributes to the Curie-Weiss-type susceptibility, the Curie constant and/or the effective moment have to be much larger than the observed values.
- (13) P. J. Brown, International Tables for Crystallography, edited by A. J. C. Wilson (Kluwer Academic, Dordrecht, 1992), Vol. C, Chap. 4.
- (14) L. D. Pham, Tuson Park, S. Maquilon, J. D. Thompson, and Z. Fisk, Phys. Rev. Lett. 97, 056404 (2006).
- (15) M. Nicklas, O. Stockert, Tuson Park, K. Habicht, K. Kiefer, L. D. Pham, J. D. Thompson, Z. Fisk, and F. Steglich, Phys. Rev. B 76, 052401 (2007).
- (16) Sunil Nair, O. Stockert, U. Witte, M. Nicklas, R. Schedler, K. Kiefer, J. D. Thompson, A. D. Bianchi, Z. Fisk, S. Wirth, and F. Steglich, Proc. Nat. Acad. Sci. U.S.A. 107, 9537 (2010).
- (17) S. Araki, N. Metoki, A. Galatanu, E. Yamamoto, A. Thamizhavel, and Y. Ōnuki, Phys. Rev. B 68, 024408 (2003).
- (18) I. I. Mazin, D. J. Singh, M. D. Johannes, and M. H. Du, Phys. Rev. Lett. 101 057003 (2008).
- (19) V. Cvetkovic and Z. Tesanovic : Europhys. Lett. 85 37002 (2009).
- (20) K. Kuroki, S. Onari, R. Arita, H. Usui, Y. Tanaka, H. Kontani, and H. Aoki : Phys. Rev. Lett. 101 087004 (2008).
- (21) F. Ma and Z.-Y. Lu, Phys. Rev. B 78 033111 (2008).
- (22) S. Wakimoto, K. Kodama, M. Ishikado, M. Matsuda, R. Kajimoto, M. Arai, K. Kakurai, F. Esaka, A. Iyo, H. Kito, H. Eisaki, and S. Shamoto, J. Phys. Soc. Jpn. 79 074715 (2010).