A Deep Chandra ACIS Study of NGC 4151. I. the X-ray Morphology of the 3 kpc-diameter Circum-nuclear Region and Relation to the Cold ISM
Abstract
We report on the imaging analysis of 200 ks sub-arcsecond resolution Chandra ACIS-S observations of the nearby Seyfert 1 galaxy NGC 4151. Bright, structured soft X-ray emission is observed to extend from 30 pc to 1.3 kpc in the south-west from the nucleus, much farther than seen in earlier X-ray studies. The terminus of the north-eastern X-ray emission is spatially coincident with a CO gas lane, where the outflow likely encounters dense gas in the host galactic disk. X-ray emission is also detected outside the boundaries of the ionization cone, which indicates that the gas there is not completely shielded from the nuclear continuum, as would be the case for a molecular torus collimating the bicone. In the central pc region, the subpixel processing of the ACIS data recovers the morphological details on scales of 30 pc (0.5″) first discovered in Chandra HRC images.
The X-ray emission is more absorbed towards the boundaries of the ionization cone, as well as perpendicular to the bicone along the direction of a putative torus in NGC 4151. The innermost region where X-ray emission shows the highest hardness ratio, is spatially coincident with the near-infrared resolved H2 emission and dusty spirals we find in an color image. The agreement between the observed H2 line flux and the value predicted from X-ray-irradiated molecular cloud models supports photo-excitation by X-rays from the active nucleus as the origin of the H2 line, although contribution from UV fluorescence or collisional excitation cannot be fully ruled out with current data. The discrepancy between the mass of cold molecular gas inferred from recent CO and near-infrared H2 observations may be explained by the anomalous CO abundance in this X-ray dominated region. The total H2 mass derived from the X-ray observation agrees with the measurement in Storchi-Bergmann et al. (2009).
1 Introduction
NGC 4151 (classified as (R)SAB(rs)ab; de Vaucouleurs et al., 1991), one of the nearest ( Mpc, pc; Mundell et al. 1999), and apparently brightest, active galaxy (Seyfert 1.5, Osterbrock & Koski 1976), has been extensively studied in almost all wavebands (see Ulrich 2000 for a review). Because of its proximity, NGC 4151 offers a unique opportunity to examine the fueling of the central supermassive black hole (SMBH) and its impact on the host galaxy.
NGC 4151 is close to face-on (inclination ) with a major axis position angle (P.A.) (Pedlar et al. 1992; Mundell et al. 1999). A biconical extended narrow line region (ENLR) is elongated along the northeast (NE) and southwest (SW) of the active galactic nucleus (AGN), at P.A. 65∘ and 230∘, respectively (Perez et al. 1989; Pérez-Fournon & Wilson 1990; Penston et al. 1990; Evans et al. 1993). Clumpy ionized gas is seen in Hubble Space Telescope (HST) narrow-band images (e.g., [OIII] 5007Å, Boksenberg et al. 1995; Winge et al. 1999) outflowing along the bicone (Schulz 1990; Crenshaw et al. 2000; Kaiser et al. 2000; Das et al. 2005), and extending to 1 kpc away from the AGN. The morphology, kinematics, and line ratio diagnostics from optical studies of NGC 4151’s ENLR (e.g., Robinson et al. 1994; Hutchings et al. 1998; Das et al. 2005) strongly support that AGN radiation in the optical bicone intersects with the host galactic disk, and photoionizes ambient galactic gas that is participating in normal galactic rotation (Pedlar et al., 1992; Evans et al., 1993; Asif et al., 1998; Mundell et al., 1999).
Near-infrared (NIR) emission line mapping of the narrow line region (NLR) of NGC 4151 (e.g., Pa; Storchi-Bergmann et al., 2009, 2010) shows that the ionized gas closely follows the optical bicone, and extends outside the bicone (also found in the HST study by Kraemer et al. 2008). The molecular hydrogen (H2) emission distribution is perpendicular to the bicone axis (Fernandez et al., 1999; Storchi-Bergmann et al., 2009), following approximately the P.A. of a large scale () gas-rich stellar bar (130∘; Pedlar et al., 1992; Mundell et al., 1999). Storchi-Bergmann et al. (2010) propose that H2 emission is potentially excited by X-rays from the AGN or shocks related to the accretion flow along the large scale bar. A spatially resolved study of the 12CO emission (Dumas et al., 2010) finds two prominent CO gas lanes at 1 kpc from the nucleus, but no cold molecular gas in the central 300 pc where the NIR H2 line emission peaks. Dumas et al. (2010) further suggest that the H2 line emission is likely photo-excited by the AGN.
The ENLR of NGC 4151 has been resolved in the soft X-rays with and observations (Elvis, Briel, & Henry 1983; Morse et al. 1995). Early Chandra images show that the extended soft X-ray emission is generally correlated with the optical forbidden line emission (e.g., Ogle et al. 2000; Yang et al. 2001), whereas the nucleus remains unresolved in the hard X-ray band. Our recent deep Chandra observations of NGC 4151 (PI: Fabbiano) on the circum-nuclear region are now providing detailed information on several spatial scales. The Chandra HRC image (Wang et al. 2009) resolves the nuclear X-ray emission on spatial scales of 30 pc, finding evidence for interactions between the radio outflow and NLR clouds111For a comprehensive view of the NGC 4151 nuclear structure, see Mundell et al. (2003).. Our deep ACIS data have led to the discovery of a large scale soft diffuse X-ray emission (Wang et al. 2010a) extending out to 2 kpc from the active nucleus and filling in the cavity in the HI 21 cm emission distribution (Asif et al., 1998; Mundell & Shone, 1999). This extended X-ray emission could be due to either hot gas in the galactic disk heated by the nuclear outflow or gas photoionized by an outburst of the AGN (Komossa 2001; Wang et al. 2010a).
This is the first of a series of papers where we report on the results from deep Chandra ACIS observations of the circum-nuclear region in NGC 4151, focusing on the imaging analysis and relating the X-ray morphology to the cold interstellar medium (ISM) in the host galactic disk. This paper is organized as follows. In § 2 we describe the observations and data reduction; in § 3 we describe the imaging analysis and present the X-ray morphology. In § 4 we discuss the results, in particular the role of the X-ray emission in exciting the molecular material near the AGN. We summarize our findings in § 5. In a forthcoming paper (Wang et al. in preparation; Paper II), we will present the X-ray emission line strength maps, detailed comparison of these maps with the ionized gas distribution using H and [OIII] images, and spatially resolved spectral fitting with self-consistent photoionization models.
2 Observations and Reduction
2.1 data
NGC 4151 was observed with Chandra for a total of 200 ks, using the spectroscopic array of the Advanced CCD Imaging Spectrometer (ACIS-S; Garmire et al. 2003) in 1/8 sub-array mode during March 27-29, 2008. The nucleus of NGC 4151 was placed near the aimpoint on the backside-illuminated S3 chip, which has a high sensitivity to soft X-rays. The data were analyzed following the standard procedures using CIAO222http://cxc.harvard.edu/ciao/ (Version 4.2) with CALDB333http://cxc.harvard.edu/caldb/ (Version 4.2.1) provided by the Chandra X-ray Center (CXC). The lightcurve from regions free of bright sources on the S3 chip was used to remove times of high background count rates. The cleaned data have total good exposure times of 180 ks (116 ks and 63 ks, in ObsID 9217 and ObsID 9218, respectively). Table 1 summarizes the observations used in this paper.
On the 1/8 S3 chip, a total of 24 point sources were detected using a significance threshold with the wavelet-based algorithm wavdetect (Freeman 2002), part of the CIAO tools. The search was performed in wavelet scales from 1 to 16 pixel (0.5″ to 8″) in steps of . These sources are removed from the images when we perform the spectral extraction of the diffuse emission. In addition, matching the positions of the X-ray detections to the Data Release 7 catalog indicates an absolute astrometric accuracy of .
The two ACIS observations of NGC 4151 were taken almost uninterrupted, with identical roll angles. The events were reprojected to the reference frame of ObsID 9217, and merged to create a single image. The pipeline randomization was removed with the CIAO tool . Subpixel event repositioning and binning techniques (Tsunemi et al. 2001; Mori et al. 2001; Kastner et al. 2002; Li et al. 2003, 2004) were applied to improve the effective resolution of the ACIS images to better than (Li et al. 2004). The images with subpixel resolution presented in this paper used the energy-independent shift for the corner split and 2-pixel split events (“static” method in Li et al. 2004).
Spectra and instrument responses were generated using CIAO Version 4.2. The source spectra were analyzed with XSPEC Version 12.5 (Arnaud 1996), taking background spectra from a blank region from the same CCD node outside of the galaxy. Spectra were grouped to have a minimum of 20 counts per energy bin to allow for fitting. When extracting spectra, the BACKSCAL keyword (equal to the fractional area of the chip occupied by the extraction region) was computed for the extended regions using CIAO tool specextract444http://cxc.harvard.edu/ciao/threads/specextract/. We restricted our modeling to photon energies between 0.3 keV and 7 keV, to avoid the instrument calibration uncertainty at lower energies, and the higher background at high energies. The 90% confidence interval for a single interesting parameter is reported for all spectral fitting results.
2.2 Archival Optical/NIR imaging
To examine extinction with a color map of the circum-nuclear region of NGC 4151, we have also retrieved from the Hubble Legacy Archive555http://hla.stsci.edu the ACS-HRC/F550M (-band) and NICMOS-NIC2/F160W (-band) images. These images were acquired as part of the Cycle 12 Program 9851 (PI: Peterson) and Cycle 7 Program 7215 (PI: Thompson), and the details of these observations were published in Onken et al. (2007) and Thompson & Corbin (1999), respectively. Pipeline processed images are further cleaned to remove cosmic rays using the Laplacian Cosmic Ray Identification algorithm (van Dokkum 2001). Model PSFs were generated with the TinyTim tool (Krist 1995) for the specific instrument and filter, and subtracted to remove the unresolved nuclear component. The resolution of the ACS -band image has been degraded to match that of the -band, by convolving with the broader NICMOS PSF ().
3 Imaging Analysis and Results
3.1 The “Raw” ACIS Image
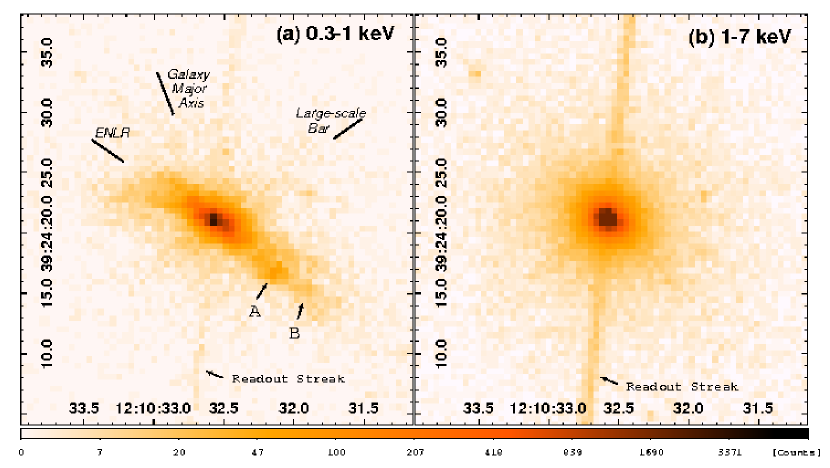
Chandra ACIS images of the central ( kpc) region of NGC 4151 were extracted in the 0.3–1 keV and 1–7 keV energy bands based on its X-ray spectrum. These images, shown in Figure 1, are in good agreement with the ACIS-S image obtained by Yang et al. (2001) and the HETG zero-order image shown by Ogle et al. (2000). However, our deeper images are 7 and 20 times more sensitive than the previously published ACIS images of this circum-nuclear region, respectively. Figure 1 clearly shows the bright nucleus dominating at energies 1 keV and soft resolved extended regions (the streaks on both sides of the nucleus are an artifact of the CCD readout process).
The SW side (along P.A.233∘) of the 0.3–1 keV emission is clumpy and clearly seen to , with fainter diffuse emission extending as far as 20″ from the nucleus. A relatively bright “blob” to the SW, noted in Yang et al. (2001), is located at (380 pc) from the nucleus at a P.A. of 227∘ (Figure 1; indicated as “A” with an arrow). Our image also shows at least one more such clump of X-ray enhancement further out at 10″ from the nucleus (“B” in Figure 1). On the NE side, the soft emission is brightest at and extends to 11″ from the nucleus along P.A.75∘. The soft X-ray emission along the NW–SE directions is fainter than the NE-SW emission by a factor of 2 and is less extended (3″; 200 pc).
3.2 The Nucleus: Photon pile-up and the Nuclear Point Spread Function (PSF)
The Chandra–measured position of the Seyfert X-ray nucleus is , . Given the uncertainty in the absolute astrometry, this position is identical to the optical (, , Clements 1981) and radio nuclear positions (, , Ulvestad et al. 2005).
The nucleus of NGC 4151 is a well known strong X-ray source. During the exposure of a single ACIS frame, two or more photons from such a high count rate X-ray source may be recorded as a single event. This is known as the “pile-up effect”666For more information see Chandra ABC Guide to Pile Up, available at http://cxc.harvard.edu/ciao/download/doc/pileup_abc.ps, which causes the loss of information from the original events, resulting in a hardened source spectrum and grade migration (Davis 2001). Aiming to study the extended X-ray emission as close to the nucleus as possible, our observations were performed using the ACIS “1/8 sub-array” mode (0.6 s frame time) to reduce nuclear pile-up. However, pile-up is still a concern as Yang et al. (2001) showed that, although their observation was taken when NGC 4151 was experiencing a low flux state, pile-up still significantly affects the inner -radius region in the ACIS image in the same mode. Before we proceed to further imaging analysis, we must evaluate the effects of pile-up on the nuclear PSF, to exclude that some of the observed features may be due to pile-up effects.
We first compared the radial profiles of the observed X-ray emission to that expected from a point source. To simulate the nuclear PSF, we need to know the intrinsic spectrum of the heavily piled-up nucleus. The events extracted from the ACIS readout streak do not suffer pile-up as the incoming photons during each frame readout were still recorded by the ACIS CCD with an exposure equivalent to 40 s per frame. We used these readout events to model the spectrum of the nucleus (Wang et al. 2010b) and obtained an absorption corrected luminosity of erg s-1.
This model was used as the input spectrum to the Chandra HRMA777High Resolution Mirror Assembly (van Speybroeck et al. 1997); see http://cxc.harvard.edu/cal/Hrma/users_guide/ for details. ray tracer (ChaRT888http://cxc.harvard.edu/chart/; Carter et al. 2003) which was run with the same observation configurations as our ACIS observations (Table 1). The ChaRT output was then fed into the MARX simulator999http://space.mit.edu/cxc/marx/ to project rays onto the detector and create an event file, with responses applied. We also used MARX to simulate a piled event file using the 35% pile-up fraction found by Wang et al. (2010b), in order to compare with the observed radial profiles. The effectiveness of this procedure was demonstrated by Russell et al. (2010).
Figure 2a compares the observed radial profiles of the nuclear region of NGC 4151 in the 1–7 keV band with the simulated PSF of a point-like nucleus (with and without pile-up). The count rate in the brightest inner 2 arcsec region is significantly lower than the expected values without pile-up, and consistent with the PSF including MARX simulated pile-up. The soft (0.3–1 keV) X-ray emission close to the nucleus is clearly resolved, both along the NE – SW and the NW – SE direction. In both directions, the soft extended emission dominates over the nuclear PSF wings at radii from the nucleus (Figure 2b and 2c). Beyond a radius of 3″ from the nucleus, the piled MARX simulations produced essentially identical results to the simulations without pile-up, so at these larger radii pile-up is not an issue.
As pile-up combines events of different energies and causes grade migration, another way to estimate the importance of pile-up is using the ratio of events with “bad” ASCA grades (1, 5, 7) to those with “good” ASCA grades (0, 2, 3, 4, 6) where a bad/good grade ratio of indicates that pile-up is approximately (Russell et al. 2010). The radial distribution of the bad/good grade ratio is shown in Figure 2d for both the 0.3–1 keV and the 1–7 keV bands, which indicates that, beyond from the nucleus pile-up is no longer significant in the 0.3–1 keV band (and beyond for the 1–7 keV band). We conclude that for our analysis of the extended soft X-ray emission, the effect of pile-up is mild beyond a radius of 2″ from the nucleus, and effectively absent at .
For imaging analysis, the major effect of pile-up on the ACIS on-axis PSF is that, the core (where most of the photons hit) gets suppressed, because some piled events are rejected as bad events, creating a circular “caldera” (e.g., Yang et al. 2001). At the pile-up fraction of 35% encountered in this observation, there is 40% decrease in brightness in the core of the PSF, but little distortion of its circular shape (Gaetz et al., private communication; see the Chandra Proposers’ Observatory Guide [POG]101010Available at http://cxc.harvard.edu/proposer/POG/ Section 6.15.). Thus, although we will discuss the images of extended features in the central 2″ region that are affected by pile-up with caution, deviations from circular shape must be related to real X-ray emission features.
3.3 ACIS Images with Subpixel Binning
Chandra HRMA’s PSF (half-power diameter HPD=0.6″, keV; see the Chandra POG) is undersampled by the ACIS CCD pixels (). To take advantage of the telescope dithering111111see POG Version 12 § 5.8.2, page 75 (2009). to improve the sampling, a fine pixel size (0.0625″, 1/8 of the native ACIS pixel size) was used when extracting the images. This subpixel binning approach is frequently adopted in imaging studies of X-ray jets pushing for the highest spatial resolution (e.g., Harris et al. 2004; Siemiginowska et al. 2007; Perlman et al. 2010). In this section we will also make use of the 50 ks Chandra observation of NGC 4151 with the High Resolution Camera (HRC; Murray et al. 1997) presented in Wang et al. (2009).
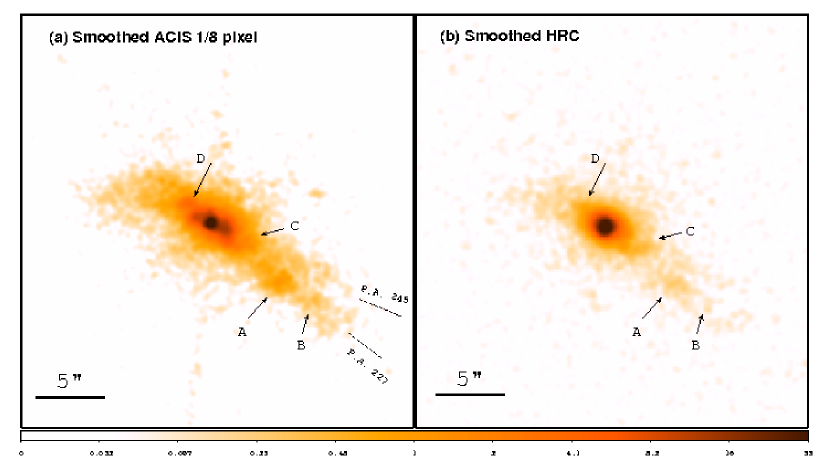
Figure 3 compares the 0.3–1 keV subpixel ACIS and HRC (Wang et al. 2009) images both smoothed with a gaussian kernel. Although the raw soft band ACIS image (Figure 2a) already shows the presence of extended emission along the NE–SW direction and hints of split emission in both NE and SW cones, the subpixel processed ACIS image of Figure 3a reveals more morphological details, especially the presence of several X-ray blobs (marked as “A”, “B”, “C”, and “D” in Figure 3) and the clear bifurcation of both the NE and SW cones. The appearance of the NE–SW soft X-ray emission is an elongated “X”-shape with an acute apex angle, resembling edge-brightened cones (c.f. Figure 1a). We have measured the P.A. of the brighter bifurcated SW X-ray emission: the edges are located at and , with a full opening angle of . The HRC image shows the identical extended morphology for the circum-nuclear region (Figure 3b), validating that subpixel repositioning does not introduce unwanted artifacts.
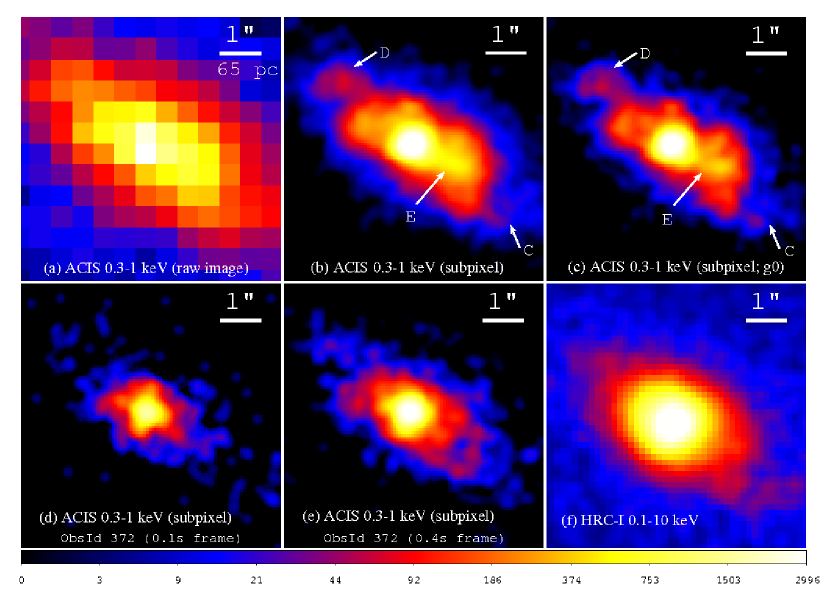
Figures 4a and b zoom in on the inner (390 pc390 pc) nuclear region, with and without subpixel resolution. The X-ray emission on scales of 200 pc () is clearly extended along the NE-SW direction. This extent is in good agreement with the overall morphology of the [OIII] emission (e.g. Kaiser et al. 2000; Wang et al. 2009). The ACIS images with subpixel binning (e.g., Figures 3a and 4b) reveal curvy extensions 2″ away from the nucleus (labelled as “C” and “D”), which are not discernable in the raw soft ACIS image (Figure 4a).
The subpixel ACIS image also shows a linear feature at P.A.=235∘ (labelled as “E” in Figure 4b) and discrete knots in the inner region (on scales 1″ from the nucleus). The soft X-ray morphology is similar to that of the NLR clouds seen in HST optical images of NGC 4151 (e.g., Evans et al. 1993, Winge et al. 1999; see Wang et al. 2009 for a Chandra/HRC and HST/WFPC2 image comparison). Corresponding outer clouds were previously detected in deep HST images (Hutchings et al. 1998; Kaiser et al. 2000). Comparison of these features to the [OIII] emission line clouds and radio outflows (e.g., Pedlar et al. 1992; Mundell et al. 2003), and emission modeling will be presented in Paper II.
We emphasize that although the inner 2″ region is affected by pile-up (§ 3.2) in the 0.3–1 keV band, the ACIS features seen in the soft X-ray emission are not observation specific or pile-up artifacts, for the following reasons:
-
1.
For the on-axis nucleus, the PSF with pile-up simulated with MARX is circular, thus the elongated features (4″ across) seen in the soft band cannot be due to pile-up related PSF distortion;
-
2.
Using only the single pixel events (grade 0), which give the best spatial resolution and are likely to be unaffected by pileup (Ballet 1999; Davis 2001), the extended features are clearly present (Figure 4c);
-
3.
Low pile-up ACIS images from Chandra archival observations of NGC 4151 (ObsID 372) show structures of similar shape and spatial scale as the features seen in our images (Figures 4d and e). Because of the short frame time (0.1 s and 0.4 s) and a factor of two lower nuclear flux, the estimated pile-up fraction is 6% and 11% in these observations, respectively (Yang et al., 2001; González-Martín, 2008). We also examined the HETG zero-order images of NGC 4151. Although some suffer significant pile-up due to longer frame time and a brightened nucleus (ObsID 7830), extended emission along NE–SW with similar substructures as we detect is seen in ObsIDs 335 and 7829;
-
4.
The PSF-deconvolved HRC image (Figure 2 in Wang et al. 2009), which is not affected by pile-up, shows the same extended morphology and small-scale enhancements within 2″ from the nucleus that are not seen in ACIS without subpixel binning.
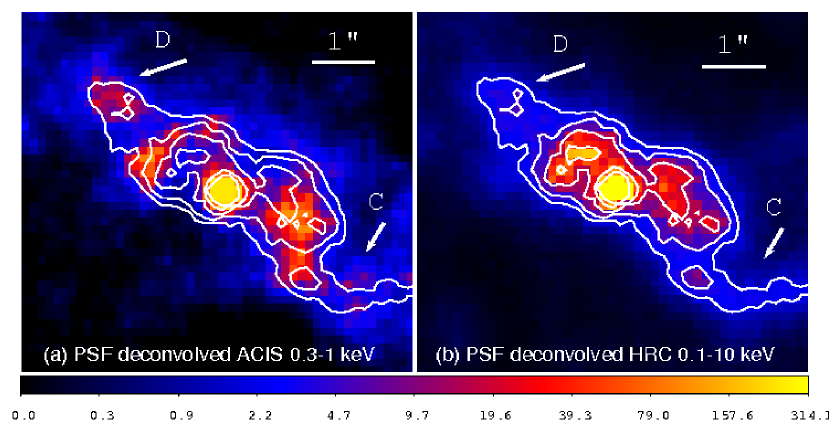
We applied two image reconstruction techniques to the ACIS data, the Richardson-Lucy (R-L) algorithm (Richardson 1972; Lucy 1974) and the Expectation through Markov Chain Monte Carlo (EMC2) method (Esch et al. 2004; Karovska et al. 2007). Both show similar extended morphology, although the R-L deconvolution produces more grainy restoration of extended features. Figure 5 compares the EMC2 PSF deconvolved ACIS image with the similarly deconvolved HRC image from Wang et al. (2009). The resemblance of the NE-SW elongation and substructures (such as the curvy feature “C” and NE clump “D” marked in Figure 3a) between the subpixel ACIS images and the deconvolved HRC strengthens our confidence that the resolved features are real. However, we noticed that the X-ray clump 1″ NE of the nucleus in the ACIS image is displaced in the HRC image (0.3″ closer to the nucleus). The morphology of the enhancement located 1″ SW to the nucleus is also different in two reconstructed images: it is mostly a linear north-south elongation in the ACIS image, whereas in the HRC image it shows a tail towards SW). Two factors may cause these discrepancies: (1) The region within 1″radius of the nucleus in the ACIS image is affected by pile-up, but the accuracy of the piled PSF on this scale has not been calibrated; yet this inaccuracy may have an impact on the reconstructed image; (2) HRC is sensitive to photons in the energy range of 0.1–10 keV, therefore may reveal real structures that are not seen in the 0.3–1 keV ACIS image.
3.4 Hardness Ratio Image of the Central 3 kpc-diameter Region
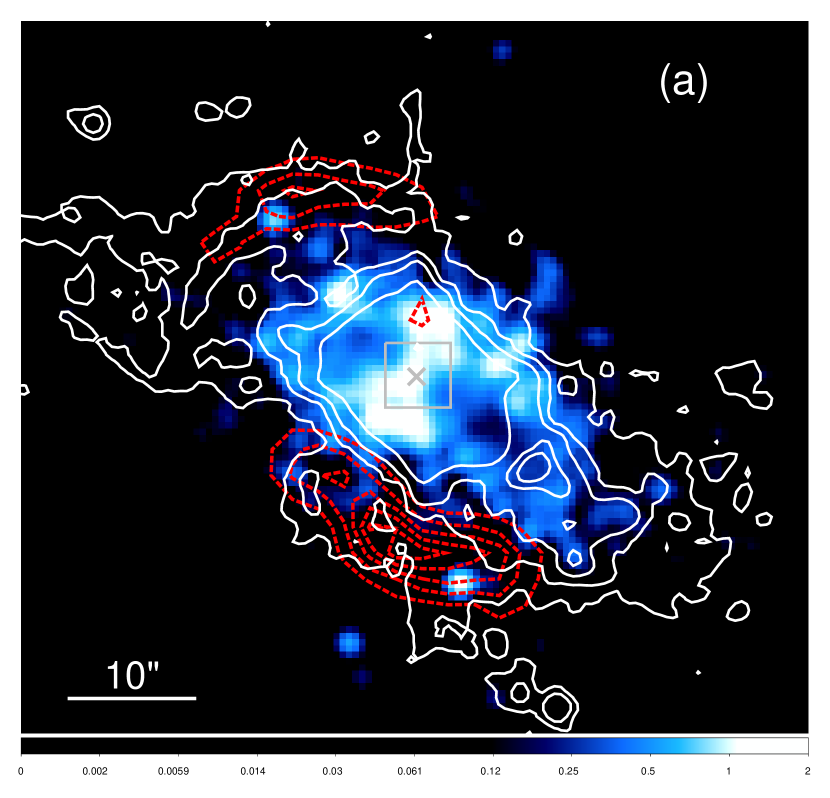
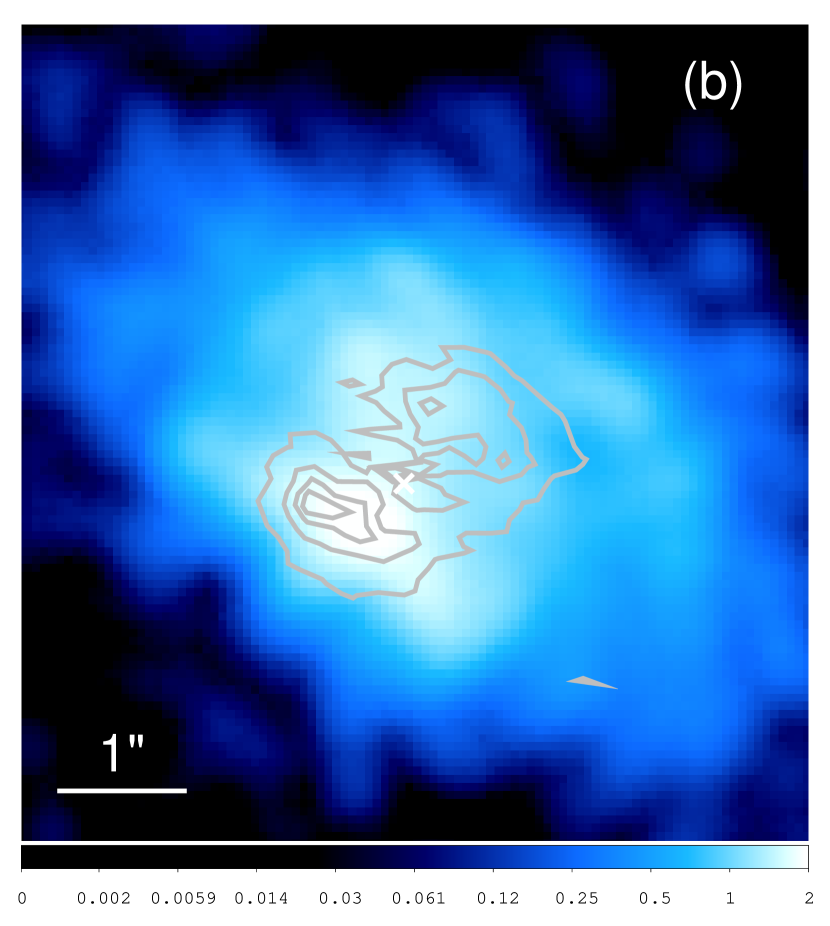
To find regions of harder spectral index or higher X-ray obscuration, we extracted Chandra images in the 0.3–1.0 keV and 1.0–2.0 keV bands and derived the counts ratio over . These bands are sensitive to hydrogen column densities of the order of cm-2, and the relative changes in the ratio map have been demonstrated to reflect variations in the X-ray absorption (Bianchi et al. 2007). The resulting hardness ratio map of the central (3.2 kpc) diameter region is shown in Figure 6a, with H (Knapen et al., 2004) and CO (Dumas et al., 2010) contours outlining the ionized gas and the cold molecular gas lanes, respectively. Figure 6b shows the hardness ratio map of the inner 6″ (400 pc) diameter region.
One obvious feature in Figure 6a is the harder (white) region extended in the NW–SE direction (P.A. 150∘). This is approximately the P.A. of the minor axis of the galaxy and the weak bar (Mundell & Shone 1999), and perhaps also the direction of a putative nuclear torus, mapped in H2 emission by Storchi-Bergmann et al. (2009) (contours in Figure 6b; see also Fernandez et al. 1999). Thus higher obscuration is plausible in this region. Coincident with the higher hardness ratio region across the nucleus (Figure 6b) is a dark dust patch in the image (Asif et al., 1998; Ohtani et al., 2001), noted by Terlevich et al. (1991) in their image as “the red bar” (P.A.=150∘; 1″ in length).
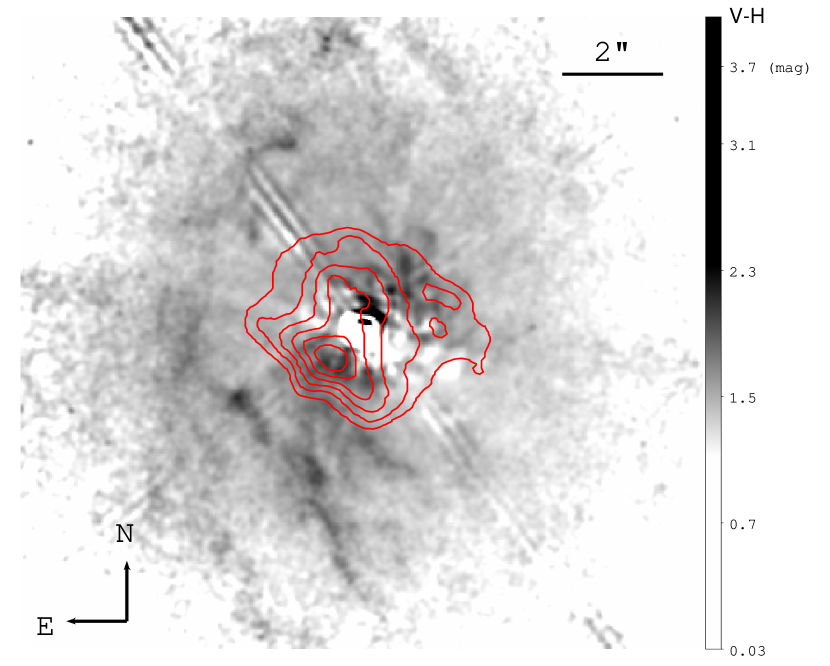
To examine the extinction of the nuclear region of NGC 4151, we created the color map using HST images (§ 2.2), covering the central of NGC 4151 (Figure 7). Dark spiral features of higher extinction are clearly revealed towards the nucleus perpendicular to the bicone direction, thanks to the high spatial resolution afforded by HST. Adopting the extinction curve in Cardelli et al. (1989), the observed suggests a range between 0.5 and 1 for , which is equivalent to (mag).
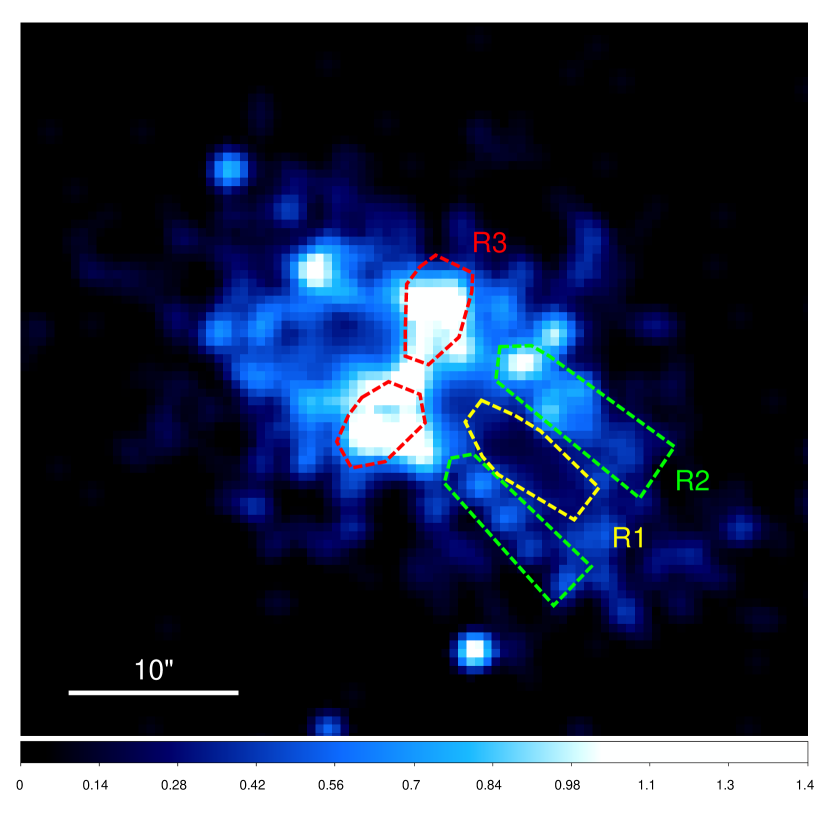
Another notable feature in Figure 6a is that the edges of the ENLR show harder emission than the inner region. To obtain quantitative constraints on the hardness ratios, we calculated the uncertainties using the Bayesian estimation of Hardness Ratios (BEHR; Park et al. 2006) tool provided by the California-Harvard Astro-Statistics Collaboration121212http://hea-www.harvard.edu/AstroStat/, where the hardness ratio, , is defined in BEHR as . For the inner part of the cone (named R1) , for the edges of the optical outflow (R2) , and for the highest hardness ratio region perpendicular to the cone-axis (R3) . Thus the hardness ratios differ significantly for each of these regions. This is consistent with the hollow bi-cone geometry proposed in Das et al. (2005) (see also Evans et al. 1993; Robinson et al. 1994; Hutchings et al. 1998; Storchi-Bergmann et al. 2010), where clumpy outflowing material is mostly located along the boundaries of the bi-cone. One side of the cone is expected to intersect an area of the host galactic disk, and the projected appearance will be an illuminated narrow sector (e.g., region R1) with higher absorption along the edges, which is indeed observed here (region R2).
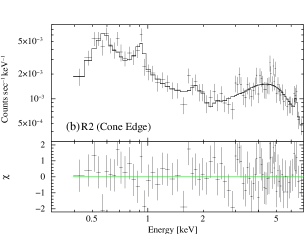
To further investigate these absorption column density variations, spectra from the three regions above were extracted using the hardness ratio map, as outlined in Figure 8. Because the PSF scattered emission is not negligible for the bright nucleus, we fit the spectra with a simple model consisting of an absorbed soft thermal component and a nuclear component (Wang et al. 2010b), allowing the normalization of the nuclear component to vary to account for contribution from the PSF wings. Figure 9a-c show the spectra and the fits; the fitting results are summarized in Table 2. These spectra confirm the wide range of X-ray absorption suggested by the hardness ratio map. The edges of the cone (R2) indeed show a higher absorbing column ( cm-2) than the inner cone region (R1), for which only a Galactic column ( cm-2; Murphy et al. 1996) is required. The highest column density, cm-2, is found across the nucleus (R3) and is approximately equivalent to adopting cm-2 mag-1 (Bohlin et al., 1978). This value is significantly higher than the average found in the NLR (Storchi-Bergmann et al., 2009) and the found in the map. Mundell et al. (1995) find an HI absorption column density of cm-2 towards the radio nucleus; the factor 15 higher X-ray suggests that most of the intervening hydrogen is in the form of or high abundances .
4 Discussion
4.1 Extended X-ray Morphology
This is the first time such a high sensitivity high resolution X-ray spectral imaging of the NGC 4151 nuclear region has been obtained. The HRC image provides no spectral information, and previous ACIS images (Ogle et al. 2000; Yang et al. 2001) either lack sensitivity to convincingly identify the X-ray features seen in subpixel resolution, or suffer from heavy pile-up in the inner 3″.
The morphological features of the X-ray emission of NGC 4151 are summarized as follows: (1) By pushing the spatial resolution of the ACIS image with subpixel resolution techniques, X-ray enhancements in the innermost nuclear region () seen in the PSF-deconvolved HRC image are recovered; (2) The extended soft X-ray emission shows the same biconical morphology as the optical ENLR out to a radius (20″; 1.3 kpc) larger than seen in earlier X-ray studies (c.f. 14″; 900 pc, Yang et al. 2001); (3) There is also firm detection of extended X-ray emission at angles beyond the boundaries of the optical ENLR ionization cone; (4) The observed X-ray emission is more absorbed towards the edge of the cone and perpendicular to the cone axis at the apex of the cone.
The two-sided, bifurcated X-ray emission morphology is consistent with the model described in Das et al. (2005) and Storchi-Bergmann et al. (2010), in which clouds are outflowing along the walls of a hollow bicone inclined to the line of sight. One side of the cone is expected to exit the plane at 21∘, intersecting an elongated area of the host galactic disk. The projected appearance (c.f. Figure 9 in Storchi-Bergmann et al., 2010) closely resembles the observed morphology here.
The extended X-ray emission seen perpendicular to the ENLR, along the NW-SE direction, was first suggested to be “unresolved or marginally resolved” in Yang et al. (2001). The definitive resolved emission at angles beyond the edges of the bicone (Figure 2c) indicates that the gas there is not completely shielded from the continuum, as would be the case for a molecular torus collimating the bicone. This agrees well with the detection of significant optical emission outside the emission-line bicone in the HST [OIII] and [OII] images, where Kraemer et al. (2008) were able to model the emission lines with a weaker ionizing continuum, filtered by an ionized absorber partially covering the nuclear continuum, i.e. the accretion disk wind (e.g., Elvis, 2000).
The NE soft X-ray emission reaches as far as 11″ (700 pc) from the nucleus, then the surface brightness decreases rapidly and significantly, by a factor of 5. This location lies near to both the northern CO gas lane and one of the dust arcs identified in the optical color map (Asif et al., 1998, a region not covered by our map). These features are gaseous compressions in circumnuclear gas spiral arms due to the gravitational influence of the large-scale stellar bar (Mundell et al., 1999; Dumas et al., 2010). Since the biconical geometry (Das et al., 2005) implies that both cones are intersecting the host galactic disk, the terminus of the NE X-ray emission is likely to occur where the NE outflow encounters dense ISM in the galactic disk. We will discuss this boundary further in Paper II.
4.2 X-ray Absorption Features and Cold Material for AGN Feeding
The features seen in the hardness ratio map (Figure 6a) also agree well with the bicone models (Das et al., 2005; Storchi-Bergmann et al., 2010). In the geometry illustrated by Das et al. (2005), the more absorbed X-ray emission seen along the bi-cone edges (R2 in Figure 8) can be explained by higher absorption from the clumpy medium outflowing along the wall of the SW cone, as it emerges from the galactic disk. Adopting the conical geometry in Das et al. (2005) with an inner full opening angle of 30∘ and outer full opening angle of 66∘, and assuming that the is due to the extra optical path along the cone wall, we estimate an average cm-3 in the cone wall (c.f. cm-3 for optical clouds; Penston et al. 1990). The region perpendicular to the bi-cone axis (R3 in Figure 8) may represent the inward extension of the CO gas lanes.
The innermost region (P.A.150∘) of high X-ray hardness ratio (Figure 6b) is spatially coincident with the H2 m emission (grey contours; Storchi-Bergmann et al., 2009; Fernandez et al., 1999) and the dusty spirals in the color map (Figure 7), which may trace inflowing material feeding the AGN. Next we discuss three mechanisms that were considered by Storchi-Bergmann et al. (2009) for the origin of H2 line emission: (1) fluorescence by FUV photons; (2) thermal excitation by shocks in the accretion flow towards the nucleus, or (3) photo-excitation by X-rays from the AGN.
(1) Fluorescence by FUV photons is ruled out by Storchi-Bergmann et al. (2009) based on the H2 2-1 S(1)/1-0 S(1) line ratio and strong evidence for thermal equilibrium ( K; Storchi-Bergmann et al., 2009) in the H2 lines. However, it is worth noting that the peak density of – cm in the H2 emitting region, taken at the measured value within the inner 0.5 arcsec in Storchi-Bergmann et al. (2009), is above the critical density of the rotational-vibrational transitions of H2 ( cm-3; Tielens 2005). It implies that thermalization by collisions effectively erases the signature of fluorescent excitation (Black & van Dishoeck 1987; Draine & Bertoldi 1996; Hollenbach & Tielens 1999), therefore the line ratio diagnostics used at lower densities may become uncertain to distinguish whether UV fluorescence or collisional excitation is dominating the H2 emission.
(2) H2 excitation by shocks in the accretion flow is not favored by current data. Mundell & Shone (1999) interpreted the H2 emission as being associated with the molecular torus obscuring the AGN which would explain its orientation perpendicular to the radio jet. The inflows observed in HI observations (Mundell & Shone 1999) are only traced to the inner part of the oval bar (; Asif et al. 1998). On the 1 kpc scale, most of the cold molecular gas is distributed along the curved CO lanes 15″ away from the nucleus (Dumas et al. 2010) with kinematics consistent with the disk and the bar (e.g., Mundell et al. 1999). No strong kinematic shocks are expected, which is also consistent with the gravitational potential that shows no important non-axisymmetric component on the relevant scales. Moreover, the detection of H2 in this relatively high density region ( cm-3) is evidence against the presence of relatively strong shocks ( km s-1) in this region, which would dissociate the molecular hydrogen collisionally. However, it remains possible that weaker shock flows exist and contribute to the H2 excitation.
(3) Photo-excitation of H2 by the AGN can be evaluated more quantitatively following Riffel et al. (2008) and Storchi-Bergmann et al. (2009), using the line intensities calculated for X-ray-irradiated molecular gas by Maloney et al. (1996) and our measured parameters. A key parameter is the effective ionization parameter, (Equation 12 in Maloney et al., 1996), where is the incident X-ray flux, is the cloud density in units of cm-3 and is the absorption column in units of cm-2. For erg cm-2 s-1 ( erg s-1; Wang et al. 2010b) at the H2 emission peak (30 pc from the nucleus; Storchi-Bergmann et al., 2009), , and (Table 2), we obtain and an emerging H2 1-0 S(1) intensity of erg cm-2 s-1 sr-1. For the aperture ( arcsec2 or sr) used by Storchi-Bergmann et al. (2009), the expected value is erg cm-2 s-1. This is a factor of two higher, but likely consistent with, the observed line flux for the same transition ( erg cm-2 s-1; Storchi-Bergmann et al., 2009), given the uncertainties in our assumptions and the models. Thus, excitation by the X-rays from AGN can reasonably explain the observed H2 line emission, in agreement with the conclusion drawn in Storchi-Bergmann et al. (2009). This also indicates the X-ray radiation received by the H2 gas is comparable to that observed along our line-of-sight, which is not blocked by a molecular torus in this direction.
The X-rays from the AGN may also explain the non-detection of CO gas in contrast to the molecular gas estimated by Storchi-Bergmann et al. (2010). Dumas et al. (2010) showed that no CO gas was detected within the inner 300 pc of the active nucleus, where strong H2 line emission arises. Using a standard Galactic CO-to-H2 conversion factor of cm-2 (K km s-1)-1 (Solomon & Barrett 1991), Dumas et al. (2010) derived a 1- upper limit of for the cold molecular gas mass. They suggested that CO itself may not be a good tracer of molecular gas in X-ray dominated regions (XDR) close to an active nucleus, where equilibrium molecular abundances are affected (Meijerink & Spaans 2005, 2007).
Model 3 in Meijerink & Spaans (2005) calculated the CO/H2 abundance ratio for erg cm-2 s-1 and cm-3 (the model parameters most close to the flux and density seen here), which is at column densities below cm-2. For clouds closer to the nucleus or immersed in diffuse X-ray emission, can be higher, and a CO/H2 ratio of can only be found at column densities cm-2 (model 4 in Meijerink & Spaans 2005). Given that the absorption column from the spectral fit is cm-2, the lack of CO perhaps can be explained by a low CO abundance relative to H2 in the XDR.
Assuming that most intervening material is in the form of H2, the X-ray derived indicates a total H2 mass of M⊙ in the (200 pc diameter) nuclear region imaged by Storchi-Bergmann et al. (2009). This value agrees well with the lower end of total H2 mass ( M⊙) in Storchi-Bergmann et al. (2009), which was derived using the mass of “hot” H2 (240 M⊙) detected in the near-IR.
One clear prediction of the XDR scenario is that, like in shocks, the [OI] 63m/[CII] 158m ratio is higher () than generally found in PDRs (Maloney et al., 1996). This can be tested with new observations using far-infrared (FIR) facilities such as PACS spectrometer (Poglitsch et al. 2010) on board the Herschel Space Observatory (Pilbratt et al. 2010). NGC 4151 was observed as part of Herschel Key Program SHINING (PI: Sturm). They find that the [O I] 63m emission is highly concentrated on the central spaxel, while the [C II] 158m emission is more extended. The ratio of [O I] 63m / [C II] 158m in the central spaxel is high, 11 (E. Sturm, private communication), consistent with XDR or shock models with an effective ionization parameter of (Figure 12 in Maloney et al. 1996). We note that this value is higher than in the XDR model analysis above using the observed X-ray flux and column density. This discrepancy might be attributed to more than one mechanism at work exciting the H2 emission. Similar [OI]/[CII] ratios of 10 have been reported in dense PDRs with no significant X-ray excitation, for example in regions near the ionizing stars of the Orion Nebula (Boreiko & Betz 1996).
In short, more investigations on the importance of UV fluorescence, shock excitation, and X-ray excitation of H2 emission in NGC 4151 are needed to further examine the caveats discussed above. In particular, theoretical effort on models that focus on the astrophysical environment around AGN will be valuable to clarify the ambiguity of the H2 excitation mechanism in NGC 4151 and in other systems in general.
5 Conclusions
We have obtained and analyzed deep Chandra observation of NGC 4151, which demonstrated the imaging power of ACIS with subpixel resolution to resolve the circumnuclear X-ray emission of a nearby Seyfert galaxy.
The X-ray structures in the nuclear region (inner 300 pc) seen in our HRC study of NGC 4151 (Wang et al. 2009) are recovered in the deep ACIS image with subpixel resolution techniques. Moreover, the extended soft X-ray emission of NGC 4151 reaches to a distance of 1.3 kpc to the SW of the nucleus, much farther than seen in earlier X-ray studies. We suggest that the terminus of the NE X-ray emission is likely where the NE outflow encounters dense ISM in the galactic disk. Extended X-ray emission is firmly detected outside the boundaries of the ionization cone, which indicates that the continuum is not completely blocked by a molecular torus. This is consistent with the findings of optical studies where nuclear ionizing photons were filtered by the bi-cone wind.
The hardness ratio image and spectral fits show that the X-ray emission is more absorbed towards the edges of the cone, as well as perpendicular to the cone axis along the P.A. of the putative nuclear torus. These regions of different spectral hardness are consistent with the expected features in the biconical outflow models.
X-ray emission shows the highest hardness ratio in the innermost region, spatially coincident with the near-infrared resolved H2 emission and the dusty spirals revealed in the HST () color map. All three features possibly trace the cold material feeding the central SMBH. The agreement between the observed H2 line flux and the predicted value from X-ray-irradiated molecular cloud models supports photo-excitation by the X-ray radiation from the active nucleus, which is not blocked by a molecular torus in this direction. However, with current data, the contribution from UV fluorescence or collisional excitation cannot be ruled out.
The X-rays from the AGN also explain the recent non-detection of CO gas (Dumas et al., 2010) in contrast to the presence of molecular hydrogen gas (Storchi-Bergmann et al., 2009). The total H2 mass derived from the X-ray observation agrees with that expected from the mass of “hot” H2. The absorption column derived from the X-ray spectral fit, when compared to the XDR models, implies that the lack of CO close to the nucleus may be explained by its low abundance relative to H2 in the XDR.
References
- Arnaud (1996) Arnaud, K. A. 1996, Astronomical Data Analysis Software and Systems V, 101, 17
- Asif et al. (1998) Asif, M. W., Mundell, C. G., Pedlar, A., Unger, S. W., Robinson, A., Vila-Vilaro, B., & Lewis, J. R. 1998, A&A, 333, 466
- Ballet (1999) Ballet, J. 1999, A&AS, 135, 371
- Bianchi et al. (2007) Bianchi, S., Chiaberge, M., Piconcelli, E., & Guainazzi, M. 2007, MNRAS, 374, 697
- Black & van Dishoeck (1987) Black, J. H., & van Dishoeck, E. F. 1987, ApJ, 322, 412
- Bohlin et al. (1978) Bohlin, R. C., Savage, B. D., & Drake, J. F. 1978, ApJ, 224, 132
- Boksenberg et al. (1995) Boksenberg, A., et al. 1995, ApJ, 440, 151
- Boreiko & Betz (1996) Boreiko, R. T., & Betz, A. L. 1996, ApJ, 464, L83
- Cardelli et al. (1989) Cardelli, J. A., Clayton, G. C., & Mathis, J. S. 1989, ApJ, 345, 245
- Carter et al. (2003) Carter, C., Karovska, M., Jerius, D., Glotfelty, K., & Beikman, S. 2003, Astronomical Data Analysis Software and Systems XII, 295, 477
- Clements (1981) Clements, E. D. 1981, MNRAS, 197, 829
- Crenshaw et al. (2000) Crenshaw, D. M., et al. 2000, AJ, 120, 1731
- Das et al. (2005) Das, V., et al. 2005, AJ, 130, 945
- Davis (2001) Davis, J. E. 2001, ApJ, 562, 575
- Draine & Bertoldi (1996) Draine, B. T., & Bertoldi, F. 1996, ApJ, 468, 269
- de Vaucouleurs et al. (1991) de Vaucouleurs, G., de Vaucouleurs, A., Corwin, H. G., Jr., Buta, R. J., Paturel, G., & Fouque, P. 1991, Volume 1-3, XII, Springer-Verlag Berlin Heidelberg New York
- van Dokkum (2001) van Dokkum, P. G. 2001, PASP, 113, 1420
- Dumas et al. (2010) Dumas, G., Schinnerer, E., & Mundell, C. G. 2010, ApJ, 721, 911
- Elvis et al. (1983) Elvis, M., Briel, U. G., & Henry, J. P. 1983, ApJ, 268, 105
- Elvis (2000) Elvis, M. 2000, ApJ, 545, 63
- Evans et al. (1993) Evans, I. N., Tsvetanov, Z., Kriss, G. A., Ford, H. C., Caganoff, S., & Koratkar, A. P. 1993, ApJ, 417, 82
- Esch et al. (2004) Esch, D. N., Connors, A., Karovska, M., & van Dyk, D. A. 2004, ApJ, 610, 1213
- Fernandez et al. (1999) Fernandez, B. R., Holloway, A. J., Meaburn, J., Pedlar, A., & Mundell, C. G. 1999, MNRAS, 305, 319
- Freeman et al. (2002) Freeman, P. E., Kashyap, V., Rosner, R., & Lamb, D. Q. 2002, ApJS, 138, 185
- Garmire et al. (2003) Garmire, G. P., Bautz, M. W., Ford, P. G., Nousek, J. A., & Ricker, G. R., Jr. 2003, Proc. SPIE, 4851, 28
- González-Martín (2008) González-Martín, O., 2008, PhD Thesis, Instituto de Astrofísica de Andalucía, Granada, Spain
- Harris et al. (2004) Harris, D. E., Mossman, A. E., & Walker, R. C. 2004, ApJ, 615, 161
- Hollenbach & Tielens (1999) Hollenbach, D. J., & Tielens, A. G. G. M. 1999, Reviews of Modern Physics, 71, 173
- Hutchings et al. (1998) Hutchings, J. B., et al. 1998, ApJ, 492, L115
- Kaiser et al. (2000) Kaiser, M. E., et al. 2000, ApJ, 528, 260
- Karovska et al. (2007) Karovska, M., Carilli, C. L., Raymond, J. C., & Mattei, J. A. 2007, ApJ, 661, 1048
- Kaspi et al. (2005) Kaspi, S., Maoz, D., Netzer, H., Peterson, B. M., Vestergaard, M., & Jannuzi, B. T. 2005, ApJ, 629, 61
- Kastner et al. (2002) Kastner, J. H., Li, J., Vrtilek, S. D., Gatley, I., Merrill, K. M., & Soker, N. 2002, ApJ, 581, 1225
- Knapen et al. (2004) Knapen, J. H., Stedman, S., Bramich, D. M., Folkes, S. L., & Bradley, T. R. 2004, A&A, 426, 1135
- Komossa (2001) Komossa, S. 2001, A&A, 371, 507
- Kraemer et al. (2008) Kraemer, S. B., Schmitt, H. R., & Crenshaw, D. M. 2008, ApJ, 679, 1128
- Krist (1995) Krist, J. 1995, Astronomical Data Analysis Software and Systems IV, 77, 349
- Li et al. (2003) Li, J., Kastner, J. H., Prigozhin, G. Y., & Schulz, N. S. 2003, ApJ, 590, 586
- Li et al. (2004) Li, J., Kastner, J. H., Prigozhin, G. Y., Schulz, N. S., Feigelson, E. D., & Getman, K. V. 2004, ApJ, 610, 1204
- Lucy (1974) Lucy, L. B. 1974, AJ, 79, 745
- Maloney et al. (1996) Maloney, P. R., Hollenbach, D. J., & Tielens, A. G. G. M. 1996, ApJ, 466, 561
- Meijerink & Spaans (2005) Meijerink, R., & Spaans, M. 2005, A&A, 436, 397
- Meijerink et al. (2007) Meijerink, R., Spaans, M., & Israel, F. P. 2007, A&A, 461, 793
- Mori et al. (2001) Mori, K., Tsunemi, H., Miyata, E., Baluta, C. J., Burrows, D. N., Garmire, G. P., & Chartas, G. 2001, New Century of X-ray Astronomy, 251, 576
- Morse et al. (1995) Morse, J. A., Wilson, A. S., Elvis, M., & Weaver, K. A. 1995, ApJ, 439, 121
- Mundell et al. (1995) Mundell, C. G., Pedlar, A., Baum, S. A., O’Dea, C. P., Gallimore, J. F., & Brinks, E. 1995, MNRAS, 272, 355
- Mundell & Shone (1999) Mundell, C. G., & Shone, D. L. 1999, MNRAS, 304, 475
- Mundell et al. (1999) Mundell, C. G., Pedlar, A., Shone, D. L., & Robinson, A. 1999, MNRAS, 304, 481
- Mundell et al. (2003) Mundell, C. G., Wrobel, J. M., Pedlar, A., & Gallimore, J. F. 2003, ApJ, 583, 192
- Murphy et al. (1996) Murphy, E. M., Lockman, F. J., Laor, A., & Elvis, M. 1996, ApJS, 105, 369
- Murray et al. (1997) Murray, S. S., et al. 1997, Proc. SPIE, 3114, 11
- Ogle et al. (2000) Ogle, P. M., Marshall, H. L., Lee, J. C., & Canizares, C. R. 2000, ApJ, 545, L81
- Ohtani et al. (2001) Ohtani, H., Hattori, T., Miyazaki, S., Iye, M., Komiyama, Y., Sasaki, T., & Kosugi, G. 2001, Galaxies and their Constituents at the Highest Angular Resolutions, 205, 168
- Onken et al. (2007) Onken, C. A., et al. 2007, ApJ, 670, 105
- Osterbrock & Koski (1976) Osterbrock, D. E., & Koski, A. T. 1976, MNRAS, 176, 61P
- Osterbrock (1989) Osterbrock, D. E. 1989, Astrophysics of gaseous nebulae and active galactic nuclei, Mill Valley, University Science Books
- Park et al. (2006) Park, T., Kashyap, V. L., Siemiginowska, A., van Dyk, D. A., Zezas, A., Heinke, C., & Wargelin, B. J. 2006, ApJ, 652, 610
- Pedlar et al. (1992) Pedlar, A., Howley, P., Axon, D. J., & Unger, S. W. 1992, MNRAS, 259, 369
- Perlman et al. (2010) Perlman, E. S., et al. 2010, ApJ, 708, 171
- Perez et al. (1989) Perez, E., Gonzalez-Delgado, R., Tadhunter, C., & Tsvetanov, Z. 1989, MNRAS, 241, 31P
- Pérez-Fournon & Wilson (1990) Pérez-Fournon, I., & Wilson, A. S. 1990, ApJ, 356, 456
- Penston et al. (1990) Penston, M. V., et al. 1990, A&A, 236, 53
- Pilbratt et al. (2010) Pilbratt, G. L., et al. 2010, A&A, 518, L1
- Poglitsch et al. (2010) Poglitsch, A., et al. 2010, A&A, 518, L2
- Richardson (1972) Richardson, W. H. 1972, Journal of the Optical Society of America (1917-1983), 62, 55
- Riffel et al. (2008) Riffel, R. A., Storchi-Bergmann, T., Winge, C., McGregor, P. J., Beck, T., & Schmitt, H. 2008, MNRAS, 385, 1129
- Robinson et al. (1994) Robinson, A., et al. 1994, A&A, 291, 351
- Russell et al. (2010) Russell, H. R., Fabian, A. C., Sanders, J. S., Johnstone, R. M., Blundell, K. M., Brandt, W. N., & Crawford, C. S. 2010, MNRAS, 402, 1561
- Schulz (1990) Schulz, H. 1990, AJ, 99, 1442
- Siemiginowska et al. (2007) Siemiginowska, A., Stawarz, Ł., Cheung, C. C., Harris, D. E., Sikora, M., Aldcroft, T. L., & Bechtold, J. 2007, ApJ, 657, 145
- Solomon & Barrett (1991) Solomon, P. M., & Barrett, J. W. 1991, Dynamics of Galaxies and Their Molecular Cloud Distributions, 146, 235
- Storchi-Bergmann et al. (2009) Storchi-Bergmann, T., McGregor, P. J., Riffel, R. A., Simões Lopes, R., Beck, T., & Dopita, M. 2009, MNRAS, 394, 1148
- Storchi-Bergmann et al. (2010) Storchi-Bergmann, T., Lopes, R. D. S., McGregor, P. J., Riffel, R. A., Beck, T., & Martini, P. 2010, MNRAS, 402, 819
- Tielens (2005) Tielens, A. G. G. M. 2005, The Physics and Chemistry of the Interstellar Medium, Cambridge University Press
- Terlevich et al. (1991) Terlevich, R., Terlevich, E., Sanchez Portal, M., & Diaz, A. I. 1991, MNRAS, 249, 36
- Thompson & Corbin (1999) Thompson, R. I., & Corbin, M. 1999, Ap&SS, 266, 79
- Tsunemi et al. (2001) Tsunemi, H., Mori, K., Miyata, E., Baluta, C., Burrows, D. N., Garmire, G. P., & Chartas, G. 2001, ApJ, 554, 496
- Ulrich (2000) Ulrich, M.-H. 2000, A&A Rev., 10, 135
- Ulvestad et al. (2005) Ulvestad, J. S., Wong, D. S., Taylor, G. B., Gallimore, J. F., & Mundell, C. G. 2005, AJ, 130, 936
- van Speybroeck et al. (1997) van Speybroeck, L. P., Jerius, D., Edgar, R. J., Gaetz, T. J., Zhao, P., & Reid, P. B. 1997, Proc. SPIE, 3113, 89
- Wang et al. (2009) Wang, J., Fabbiano, G., Karovska, M., Elvis, M., Risaliti, G., Zezas, A., & Mundell, C. G. 2009, ApJ, 704, 1195
- Wang et al. (2010a) Wang, J., Fabbiano, G., Risaliti, G., Elvis, M., Mundell, C. G., Dumas, G., Schinnerer, E., & Zezas, A. 2010a, ApJ, 719, L208
- Wang et al. (2010b) Wang, J., Risaliti, G., Fabbiano, G., Elvis, M., Zezas, A., & Karovska, M. 2010b, ApJ, 714, 1497
- Winge et al. (1999) Winge, C., Axon, D. J., Macchetto, F. D., Capetti, A., & Marconi, A. 1999, ApJ, 519, 134
- Yang et al. (2001) Yang, Y., Wilson, A. S., & Ferruit, P. 2001, ApJ, 563, 124


| Obs ID | Date | Instrument | Frame Time (s) | Exposure (ks) |
|---|---|---|---|---|
| 372 | Mar 06, 2000 | ACIS-S | 0.1 | 0.8 |
| 372 | Mar 06, 2000 | ACIS-S | 0.4 | 6.2 |
| 9217 | Mar 29, 2008 | ACIS-S | 0.6 | 116 |
| 9218 | Mar 27, 2008 | ACIS-S | 0.6 | 63 |
| 9219 | Mar 02, 2008 | HRC-I | 49 |
| RegionaaThe regions and spectra are presented in Figure 9. R1–the central inner part of the cone; R2–the edges of the cone; and R3–the high hardness ratio region perpendicular to the bicone-axis. | bbHardness ratio is defined as . | Temperature | PSF fractionccThe fraction of nuclear emission contributed to the extended emission. | / d.o.f. | |
|---|---|---|---|---|---|
| [ cm-2] | [keV] | [] | |||
| R1 | 0.02ddAbsorption fixed at Galactic column as required by the fit. | 0.28 | 0.5 | 135/94 | |
| R2 | 0.70 | 0.08 | 0.7 | 66/75 | |
| R3 | 6.51.5 | 2.2 | 261/231 |