Re-acceleration of Nonthermal Particles at Weak Cosmological Shock Waves
Abstract
We examine diffusive shock acceleration (DSA) of the pre-exisiting as well as freshly injected populations of nonthermal, cosmic-ray (CR) particles at weak cosmological shocks. Assuming simple models for thermal leakage injection and Alfvénic drift, we derive analytic, time-dependent solutions for the two populations of CRs accelerated in the test-particle regime. We then compare them with the results from kinetic DSA simulations for shock waves that are expected to form in intracluster media and cluster outskirts in the course of large-scale structure formation. We show that the test-particle solutions provide a good approximation for the pressure and spectrum of CRs accelerated at these weak shocks. Since the injection is extremely inefficient at weak shocks, the pre-existing CR population dominates over the injected population. If the pressure due to pre-existing CR protons is about 5 % of the gas thermal pressure in the upstream flow, the downstream CR pressure can absorb typically a few to 10 % of the shock ram pressure at shocks with the Mach number . Yet, the re-acceleration of CR electrons can result in a substantial synchrotron emission behind the shock. The enhancement in synchrotron radiation across the shock is estimated to be about a few to several for and for , depending on the detail model parameters. The implication of our findings for observed bright radio relics is discussed.
1 INTRODUCTION
Cosmological shock waves result from supersonic flow motions induced by hierarchical clustering during the large-scale structure formation in the Universe (Miniati et al., 2000; Ryu et al., 2003). According to studies based on cosmological hydrodynamic simulations, the shocks formed by merger of subclumps, infall of matter and internal flow motion in intracluster media (ICMs) and cluster outskirts are relatively weak with Mach number a few (Ryu et al., 2003; Pfrommer et al., 2006; Kang et al., 2007; Skillman et al., 2008; Hoeft et al., 2008; Vazza et al., 2009). Indeed, observations of X-ray shocks (e.g., Markevitch et al., 2002, 2005; Markevitch & Vikhlinin, 2007) and radio relics (e.g., Bagchi et al., 2006; Finoguenov et al., 2010; van Weeren et al., 2010) indicate that the estimated Mach number of observed shocks in cluster environments is consistent with such theoretical predictions.
Suprathermal particles are known to be produced as an inevitable consequence of the formation of collisionless shocks in tenuous plasmas and they can be further accelerated to become cosmic rays (CRs) through interactions with resonantly scattering Alfvén waves in the converging flow across a shock (Bell, 1978; Drury, 1983; Malkov & Drury, 2001). Detailed nonlinear treatments of diffusive shock acceleration (DSA) have predicted that at strong shocks a significant fraction of the shock kinetic energy is transferred to CRs, inducing highly nonlinear back-reactions from CRs to the underlying flow (e.g., Amato & Blasi, 2006; Vladimirov et al., 2006; Kang & Jones, 2007). Multi-band observations of nonthermal radio to -ray emissions have confirmed the acceleration of CR electrons and protons up to 100 TeV at young supernova remnants (e.g. Parizot et al., 2006; Reynolds, 2008; Abdo et al., 2010).
The presence of nonthermal particles, especially electrons, in clusters of galaxies, has been inferred from observations of synchrotron emission from radio halos and relics (see, e.g., Carilli & Taylor, 2002; Govoni & Feretti, 2004, for review). Since the matter in ICMs and cluster outskirts should have gone first through accretion shocks of high Mach number around nonlinear structures and then through weaker shocks due to mergers and flow motion (Ryu et al., 2003; Kang et al., 2007), DSA should be responsible for at least a part of the CR production. Nonthermal particles can be also produced via turbulent acceleration (see, e.g., Cassano & Brunetti, 2005; Brunetti & Lazarian, 2007). Recent Fermi observations of -ray emission from galaxy clusters, however, limit that the pressure due to CR protons cannot exceed % of the gas thermal pressure (Abdo et al., 2010; Donnert et al., 2010).
At weak shocks with a few, DSA is known to be rather inefficient and the CR pressure remains dynamically insignificant, partly because the injection from thermal to nonthermal particles is inefficient (e.g., Kang et al., 2002). In such test-particle regime, the downstream CR spectrum takes the power-law form of , where the spectral slope, , depends on the velocity jump across the shock (Drury, 1983). Recently, Kang & Ryu (2010) suggested analytic, time-dependent solutions for the test-particle CR spectrum, using results from DSA simulations in which particles are injected via thermal leakage process and accelerated to ever increasing maximum momentum, . They found that at weak shocks expected to form in ICMs and cluster outskirts, indeed, much less than of particles are injected into CRs and much less than of the shock ram pressure is converted into the downstream pressure of CR protons, so the particle acceleration is virtually negligible.
However, the recent discovery of very bright radio relics associated with weak shocks of a few (e.g., Bagchi et al., 2006; Finoguenov et al., 2010; van Weeren et al., 2010) suggests that, contrary to the expectation, DSA should operate at weak shocks in cluster environments. One way to explain this is to presume that the relics form in media with pre-existing CRs which were produced by DSA at previous shocks and/or by turbulent acceleration. The existence of pre-exiting CRs alleviates the problem of inefficient injection at weak shocks.
In this paper, we examine the DSA at weak cosmological shocks in the presence of pre-existing CRs. First, the properties of weak shocks in ICMs and cluster outskirts are briefly reviewed in Section 2. Analytic, time-dependent solutions for the acceleration of the pre-existing and freshly injected populations of CRs in the test-particle regime is described in Section 3, while the numerical solutions from kinetic DSA simulations are presented in Section 4. The synchrotron radiation from CR electrons accelerated at these shocks is discussed in Section 5. Finally, a brief summary is given in Section 6.
2 SHOCK WAVES IN ICMS AND CLUSTER OUTSKIRTS
Shock waves in the large-scale structure of the universe have been studied in details using various hydrodynamic simulations for the cold dark matter cosmology with cosmological constant (CDM) (Ryu et al., 2003; Pfrommer et al., 2006; Kang et al., 2007; Skillman et al., 2008; Hoeft et al., 2008; Vazza et al., 2009). It was found that shocks with Mach number typically up to and speed up to a few at the present universe . In ICMs and cluster outskirts, however, shocks are expected to have lower Mach number, because they form in the hot gas of keV.
To examine the characteristics of shocks in ICMs and cluster outskirts, we analyze the shocks with the preshock gas temperature of K. The cosmic web is filled with ionized plasmas, the intergalactic medium (Cen & Ostriker, 1999; Kang et al., 2005). The hot gas with K is found mostly in ICMs and cluster outskirts, and the Warm Hot Intergalactic Medium (WHIM) with K K is distributed mostly in filaments. The diffuse gas with K resides mainly in sheetlike structures and voids. The shocks were found in a simulation of the WMAP1-normalized CDM cosmology employed the following parameters: , , , /(100 km/s/Mpc) = 0.69, , and . The simulation was performed using a PM/Eulerian hydrodynamic cosmology code (Ryu et al., 1993). Detailed descriptions for numerical set-up and input physical ingredients can be found in Cen & Ostriker (2006). The procedure to identify shocks was described in details in Ryu et al. (2003).
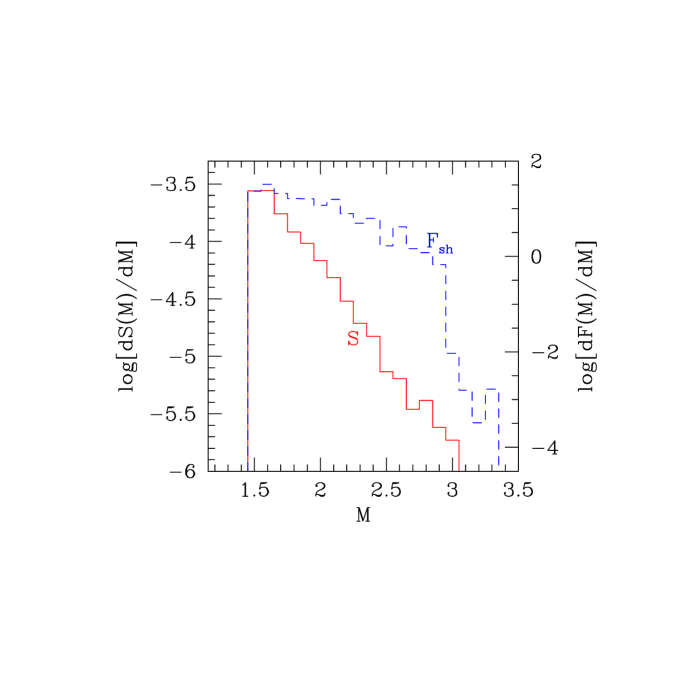
Figure 1 shows the surface area of shocks with K per Mach number interval in the entire simulation volume, normalized by the volume. Here, is given in units of . The quantity provides a measure of shock frequency or the inverse of the mean comoving distance between shock surfaces. To avoid confusion from complex flow patterns and shock surface topologies associated with very weak shocks, only those portions of shock surfaces with are shown. We also calculated the incident shock kinetic energy flux, , where is the preshock gas density, and then the kinetic energy flux through shock surfaces per Mach number interval, normalized by the simulation volume, . Figure 1 shows , too. As expected, the Mach number of the shocks formed in ICMs and cluster outskirts is small, typically . The frequency increases to weakest possible shocks with . The kinetic energy flux through shock surfaces is larger for weaker shocks; that is, weaker shocks process more shock energy, confirming the energetic dominance of weak shocks in cluster environments.
3 ANALYTIC TEST-PARTICLE SPECTRUM
In the kinetic DSA approach, the following diffusion-convection equation for the pitch-angle-averaged distribution function of CRs, , is solved along with suitably modified gasdynamic equations:
| (1) |
where is the spatial diffusion coefficient and is the drift speed of the local Alfvénic wave turbulence with respect to the plasma (Skilling, 1975). The scattering by Alfvén waves tends to isotropize the CR distribution in the wave frame, which may drift upstream at the Alfvén speed, , with respect to the bulk plasma. So the wave speed is set to be upstream of shock, while downstream.
In the test-particle regime where the feedback due to the CR pressure is negligible, the downstream CR distribution can be described with a power-law spectrum, , and the slope is given by
| (2) |
where and are the upstream and downstream flow speeds, respectively, in the shock rest frame, is the shock compression ratio, and is the upstream Alfvén Mach number with (Drury, 1983; Kang & Ryu, 2010). The test-particle power-law slope can be calculated as a function of shock Mach number M with , which becomes for a gas adiabatic index , and . Here, is the Alfvén speed parameter, where is the upstream sound speed. The maximum momentum of CR protons achieved by the shock age of can be estimated as
| (3) |
where is the shock speed (Drury, 1983; Kang & Ryu, 2010). Here, a Bohm-type diffusion coefficient,
| (4) |
is adopted, where , and are magnetic field strength and the gas density far upstream. In CR-modified shocks where CRs are dynamically non-negligible, in general, the upstream flow is decelerated in the precursor before it enters the gas subshock. So we use the subscripts “0”, “1”, and “2” to denote the conditions far upstream, immediate upstream and downstream of shock, respectively. Of course, in the test-particle limit, the distinction between far and immediate upstream quantities disappears, e.g., .
In the limit of large () and large (), the maximum energy of CR protons can be approximated by
| (5) |
The CR proton spectrum limited by the shock age is expected to have a cutoff at around (see Section 3.3 for further discussion).
3.1 Pre-existing Population
As noted in Introduction, it seems natural to assume that ICMs and cluster outskirts contain pre-existing CRs. But their nature is not well constrained, except that , i.e., the pressure of CR protons is less that % of the gas thermal pressure (e.g., Abdo et al., 2010; Donnert et al., 2010). With pre-existing CRs of spectrum upstream of shock, the steady-state, test-particle solution of Equation (1) for the downstream CR distribution can be written as
| (6) |
where is the test-particle power-law slope given in Equation (2) (Drury, 1983). Here, is the lowest momentum boundary above which particles can cross the shock, i.e., the injection momentum (see the next subsection). By this definition of , the CR distribution function, and for . The first term in the right-hand-side of Equation (6) represents the re-accelerated population of pre-existing CRs, while the second term represents the population of CRs freshly injected at the shock and will be discussed in the next subsection.
We adopt a power-law form, , with the slope , as the model spectrum for pre-existing CR protons. If pre-existing CRs were generated at previous shocks, the slope of is achieved for with (see Equation (2)). On the other hand, if they are mainly the outcome of turbulent acceleration, the slope should be close to (see, e.g., Chandran, 2005). Then, the spectrum of re-accelerated CRs is obtained by direct integration:
| (9) |
If , for ,
| (10) |
where . That is, if the spectral slope of pre-existing CRs is softer than the test-particle slope (), the re-accelerated CR spectrum gets flattened to by DSA; in the opposite case (), the re-accelerated CR spectrum is simply amplified by the factor of and retains the same slope as the slope of pre-existing CRs.
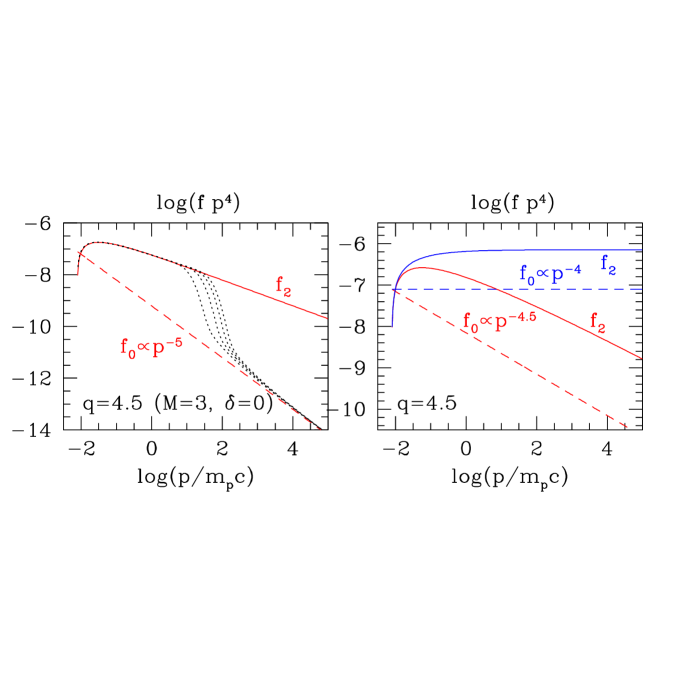
Figure 2 shows the re-accelerated CR distribution given in Equation (9) for a shock in the presence of the pre-existing power-law CR spectrum with the slope and 4.5 (right panel) and (left panel). The Alfvénic drift is ignored (), so the test-particle slope is . Here, we adopted the following parameters: the upstream gas temperature K and the injection parameter , resulting in (see the next subsection for details of our injection model).
The figure illustrates that for , the CR amplification factor, , approaches a constant, , in the case of , increases as in the case of , and scales as in the case of . So, for instance, the factor becomes and at for and 5, respectively. We point that these values of the CR amplification factor are substantially larger than those expected for the adiabatic compression across the shock. With pre-existing CRs of , the amplification factor due to the adiabatic compression is given by
| (11) |
in the test-particle regime. So the adiabatic amplification factor is , 5.2, and 6.2 and for , 4.5 and 5, respectively, at a Mach 3 shock. Note that the adiabatic compression does not change the slope of the CR spectrum.
The left panel of Figure 2 also shows the time evolution of the CR distribution at the shock location, , from a DSA simulation for the same set of parameters (see Section 4 for details of DSA simulations). The CR injection was turned off for this particular simulation in order to compare the analytic and numerical solutions only for pre-existing CRs. This demonstrates that the time-dependent solution asymptotes to the steady-state solution in Equation (9).
3.2 Injected Population
Because complex plasma interactions among CRs, waves, and the underlying gas flow are not fully understood yet, it is not possible to make a precise quantitative prediction for the injection process from first principles (e.g., Malkov & Drury, 2001). Here, we adopt a phenomenological injection model that can emulate the thermal leakage process, through which particles above a certain injection momentum cross the shock and get injected to the CR population (Kang et al., 2002; Kang & Ryu, 2010). Then, the CR distribution function at is anchored to the downstream Maxwellian distribution as
| (12) |
where is the downstream proton number density. Here, and are defined as
| (13) |
where is the thermal peak momentum of the downstream gas with temperature and is the Boltzmann constant. We note that the functional form of was adopted to represent an “effective” injection momentum, since particles in the suprathermal tail can cross the shock with a smoothly-varying probability distribution (see Kang et al., 2002). One free parameter that controls the leakage process is the injection parameter, , which is the ratio of the general magnetic field along the shock normal, , to the amplitude of the downstream, magnetohydrodynamic (MHD) wave turbulence, . Although plasma hybrid simulations and theories both suggested that (Malkov & Völk, 1998), the physical range of this parameter remains to be rather uncertain due to lack of full understanding of relevant plasma interactions.
The second term in Equation (6) is fixed by , , and . The fraction of particles injected into the CR population can be estimated analytically as well:
| (14) |
which is fixed only by and . The injection fraction depends strongly on (through ) for weak shocks with (see also Kang & Ryu, 2010). For example, it varies from to for for shocks with .
3.3 Cosmic-Ray Spectrum for Weak Shocks
Kang & Ryu (2010) demonstrated that the time-dependent, test-particle solutions of the downstream CR distribution can be represented by the steady-state, test-particle solutions with an exponential cutoff (Caprioli et al., 2009), if the cutoff momentum is set as with in Equation (3). Here, we suggest that the same cutoff would be applied to the spectrum of re-accelerated CRs. Then, the CR distribution at the shock location, , originated from both the pre-existing and freshly injected populations can be approximated by
| (15) |
where is given in Equation (9) and . The function is defined as
| (16) |
where (Kang & Ryu, 2010). Of course, for , the acceleration is limited by the shock age and so pre-existing CRs will be simply advected downstream, resulting in . These particles, however, do not make any significant contribution to the downstream CR pressure, if the pre-existing power-law spectrum has the slope (see below).
4 COMPARISON WITH NUMERICAL SOLUTIONS
4.1 Set-up for DSA Simulations
We carried out kinetic DSA simulations in order to test the time-dependent features of the test-particle solution in Equation (15). Also for shocks with typically a few, the evolution of CR-modified shocks should be followed by DSA simulations, because the nonlinear feedback of CRs becomes important (Kang & Ryu, 2010). We used the CRASH (Cosmic-Ray Acceleration SHock) code for quasi-parallel shock, in which the diffusion-convection equation (1) is solved along with the gasdynamic equation modified for the effects of the CR pressure (Kang et al., 2002).
We considered shocks with a wide range of Mach number, , propagating into typical ICMs and cluster outskirts of K; the shock speed is . The diffusion in Equation (4) was used. In the code units, the diffusion coefficient is normalized with for numerical simulations. Then, the length and time scales are given as and , respectively. Since the flow structure and profile evolve self-similarly, a specific physical value of matters only in the determination of at a given simulation time. For instance, is achieved by the termination time of in our simulations. Simulations start with purely gasdynamic shocks initially at rest at , and the gas adiabatic index is .
As for the pre-existing CRs, we adopted for their spectrum. The amplitude, , is set by the ratio of the upstream CR to gas pressure, , and we consider . We note that with the same value of , the amplitude is larger for softer pre-existing spectrum, i.e., larger . To examine the effects of Alfvénic drift, in addition to the models with , we consider as a fiducial value, which corresponds to , i.e., the magnetic field energy density of % of the gas thermal energy density. Finally, we consider for the injection parameter.
4.2 CR Proton Spectrum and CR Pressure
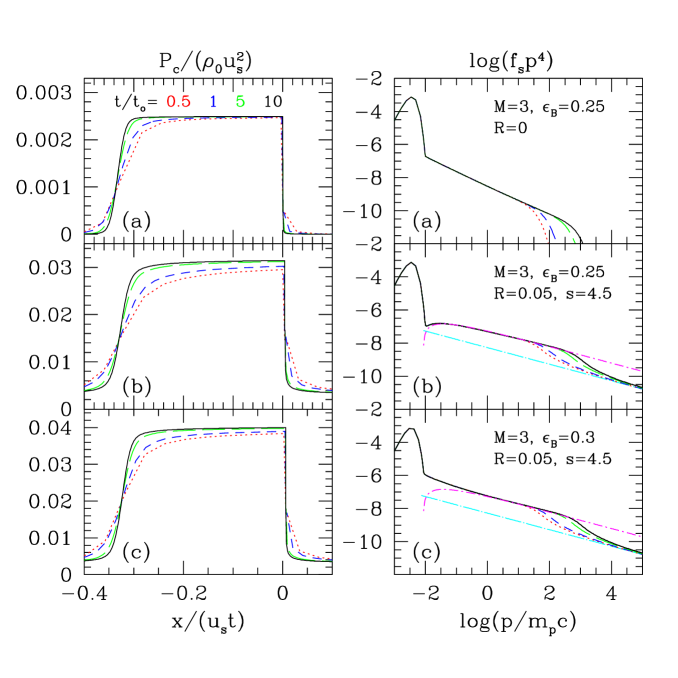
Figure 3 shows the CR pressure profile and the CR distribution at the shock location, , from DSA simulations for a Mach 3 shock. In the cases with pre-existing CRs in (b) and (c), the steady-state solution without injection given in Equation (9) (dot-dashed line) is also shown for comparison. As CRs are accelerated to ever high energies (), the scale length of the CR pressure increases linearly with time, (Kang et al., 2009). Left panels demonstrate that the CR pressure profile evolves in a self-similar fashion, depending approximately only on the similarity variable, . Right panels indicate that can be well approximated with the form in Equation (15), i.e., the acceleration of pre-existing and injected CRs along with an exponential cutoff at .
Comparing the cases in (a) and (b), we see that with the same injection parameter, the presence of pre-existing CRs results in higher downstream CR pressure, and that the re-accelerated pre-existing population dominates over the injected population. The presence of pre-existing CRs acts effectively as a higher injection rate than the thermal leakage alone, leading to the greatly enhanced CR acceleration efficiency. For the case with in (c), the injection rate is much higher than that of the case with , yet the injected population makes a non-negligible contribution only near .
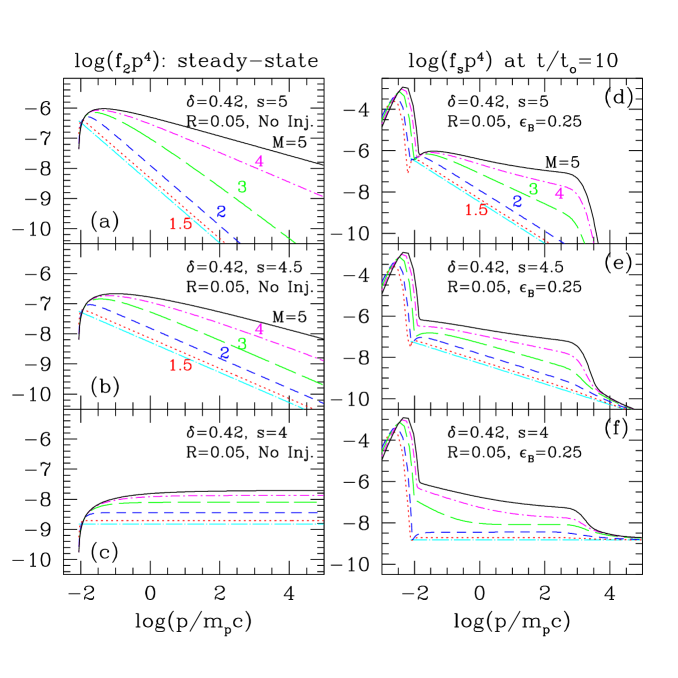
In Figure 4, we compare the spectrum of re-accelerated CRs from the steady-state solutions without injection (left panels) and the CR spectrum at the shock location from the time-dependent solutions of DSA simulations at (right panels), in order to demonstrate the relative importance of the acceleration of the pre-existing and the injected populations. Different values of and are considered, but , , and are fixed. As noted before, with the same , the amplitude of the pre-existing CR spectrum is larger for larger , so the re-acceleration of pre-existing population is relatively more important. The figure indicates that for most cases considered, the re-accelerated pre-existing population dominates over the injected population for the considered range of Mach number. Only for the cases with and , the freshly injected population makes a noticeable contribution.
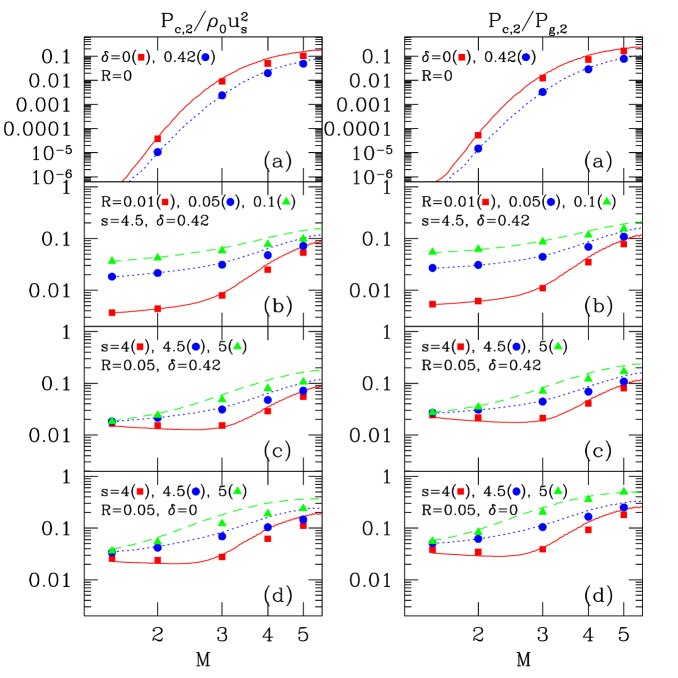
Figure 5 shows the downstream CR pressure, , relative to the shock ram pressure, , and to the downstream gas thermal pressure, , as a function of shock Mach number for different values of , , and . Again, in all the cases. As shown in the top panels, without pre-existing CRs, both and steeply increase with , because both the injection and acceleration efficiencies depend strongly on . For shocks with , and the nonlinear feedback begins to be noticeable. The feedback reduces the CR injection and saturates the CR acceleration, so from DSA simulations becomes smaller than the analytic estimates in the test-particle limit (see also Kang & Ryu, 2010). Also the top panels compare the models with and , demonstrating that the Alfvénic drift softens the accelerated spectrum and reduces the CR pressure.
In (b) panels, the cases with different upstream CR pressure fractions are compared: increases almost linearly with at shocks with in the test-particle regime, while the CR acceleration begins to show the saturation effect for . With pre-existing CRs, both and are substantially larger, compared to the case with , especially for , confirming the dominance of the re-accelerated pre-existing population over the injected population at weak shocks.
In (c) panels, the cases with different pre-existing slopes are compared; with softer spectrum (larger ), the amplitude is larger and the CR acceleration is more efficient, as described above with Figure 4. In (d) panels, the same cases as in (c) panels except are shown, demonstrating again the effects of Alfvénic drift.
These results indicate that at shocks with in ICMs and cluster outskirts, the downstream CR pressure is typically a few to 10 % of either the shock ram pressure or the downstream gas thermal pressure. Even in the cases where the pre-existing CR population takes up to 10 % of the gas thermal pressure in the upstream flow, in the downstream flow. This is consistent with the Fermi upper limit (Abdo et al., 2010; Donnert et al., 2010).
5 CR ELECTRONS AND SYNCHROTRON RADIATION
Since DSA operates on relativistic particles of the same rigidity () in the same way, both electrons and protons are expected to be accelerated at shocks. However, electrons lose energy, mainly by synchrotron emission and Inverse Compton (IC) scattering, and the injection of postshock thermal electrons is believed to be much less efficient, compared to protons.
The maximum energy of CR electrons accelerated at shocks can be estimated by the condition that the momentum gain per cycle by DSA is equal to the synchrotron/IC loss per cycle, i.e., =0 (see Webb et al., 1984; Zirakashvili & Aharonian, 2007). With the assumed Bohm-type diffusion coefficient, the electron spectrum has a cutoff at
| (17) | |||||
where with G is the effective magnetic field strength for synchrotron and IC coolings upstream and downstream of shock, and was assumed. Note that the electron cutoff energy is a time-asymptotic quantity that depends only on the shock speed and the magnetic field strength, independent of the shock age. For a Mach 3 shock and , for example, the shock jump condition gives , (with ) and G (assuming ), resulting in the cutoff Lorentz factor, .
Thus, we may model the downstream electron spectrum as
| (18) |
where is the downstream proton spectrum (Zirakashvili & Aharonian, 2007). The electron-to-proton number ratio, , is not yet constrained precisely by plasma physics (see, e.g., Reynolds, 2008). Although is inferred for the Galactic CRs (Schlickeiser, 2002), a much smaller value, , is preferred for young supernova remnants (Morlino et al., 2009). However, for the pre-existing population in ICMs and cluster outskirts could be quite different from these estimates.
Next, from the electron spectrum in Equation(18), we consider the synchrotron emission. The averaged rate of synchrotron emission at photon frequency from a single relativistic electron with Lorentz factor can be written as
| (19) |
where is the particle speed in units of , is the Thomson cross section, and is the magnetic energy density (see, e.g., Shu, 1991). The frequency distribution function, , which satisfies the normalization , peaks at
| (20) |
where is the Larmor frequency. If we approximate that the synchrotron radiation is emitted mostly at (i.e., is replaced by a delta function centered at ), the synchrotron volume emissivity from the CR electron number density, , becomes
| (21) |
with corresponding to the given in Equation (20). So the ratio of the downstream to upstream synchrotron emissivity at a given frequency can be written as
| (22) |
where and are the Lorenz factor that corresponds to the given in Equation (20) for upstream field and downstream field , respectively.
For power-law spectra, the ratio can be written in a more intuitive form. If the ratio of the pre-existing population is comparable to or greater than that of the injected population, pre-existing electrons are more important than injected electrons at weak shocks of , as pointed out in the previous section. Then, the downstream electron spectrum can be approximated by the distribution function in Equation (9) with a Gaussian cutoff, . Again adopting for pre-existing CR electrons, the downstream spectrum is , (unless ) for . Then, the ratio of the downstream to upstream synchrotron emissivity at becomes
| (23) | |||||
where and are the upstream and downstream magnetic field strengths in units of G. In the second step, we assumed that , where corresponds to implied by the diffusion model in Equation (4),
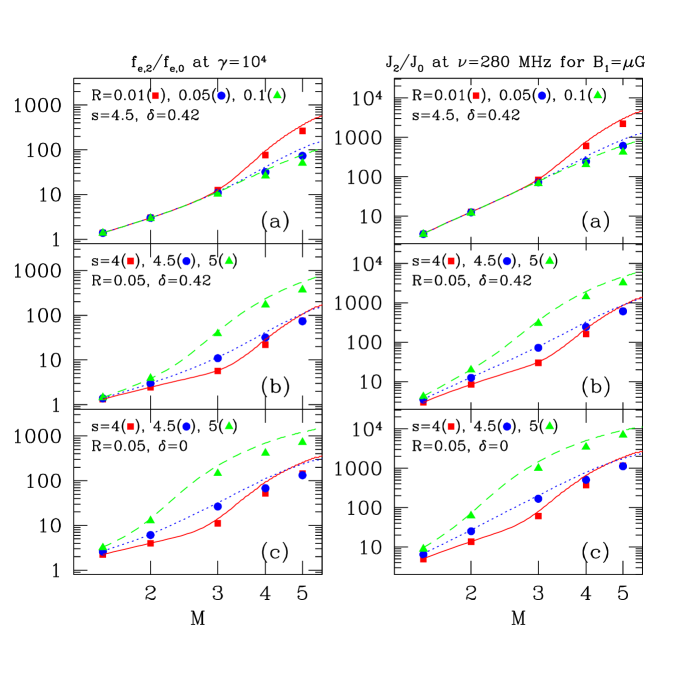
Figure 6 shows at , and at MHz for G and for the cases considered in Figure 5. Here, we assume that is the same for both the pre-existing and injected populations. Since the electron cutoff momentum is for the shock parameters considered here, the choice of and MHz (see Equation(20)) as the representative values should be safe. As shown in Figure 5, for , the downstream CR proton pressure can absorb typically only a few to 10% of the shock ram pressure even for . Yet, the acceleration of CR electrons can result in a substantial enhancement in synchrotron radiation across the shock. Our estimation indicates that the enhancement factor, , can be up to several at shocks with , up to several 10s for , and up to several 100s for . This is partly due to the large enhancement of the electron population across the shock, , which is typically an order of magnitude smaller than the ratio . Additional enhancement comes from the amplification of magnetic fields across the shock, .
We note that for the compression of a uniform magnetic field, , that is, . With this scaling, should be a bit smaller than that in Figure 6. However, it is also quite plausible that the downstream magnetic field is stronger than that expected for simple compression. It has been suggested that at shocks, especially at strong shocks, the downstream magnetic field is amplified by plasma instabilities (see, e.g., Lucek & Bell, 2000; Bell, 2004), although the existence of such instabilities has not been fully explored for weak shocks. Moreover, the magnetic field can be further amplified by the turbulence that is induced through cascade of the vorticity generated behind shocks (Giacalone & Jokipii, 2007; Ryu et al., 2008). In such cases, the ratio could be larger than that in Figure 6. In that sense, our estimate for the synchrotron enhancement factor may be considered as conservative one. We also note that with in Equation (23), is larger at higher frequencies, but smaller with larger .
The above enhancement in synchrotron emission across the shock can be compared to the enhancement in Bremsstrahlung X-ray. The Bremsstrahlung X-ray emissivity is given as , so the ratio of the downstream to upstream emissivity can be written as
| (24) | |||||
in the limit where the CR pressure does not modify the shock structure. The enhancement in Bremsstrahlung X-ray emission, , is 3.6, 7.5, and 17 for , 2, and 3, respectively. These values are substantially smaller than shown in Figure 6. This implies that shocks in ICMs and cluster outskirts may appear as radio relics, but not be detected in X-ray, for instance, as in the case of CIZA J2242.8+5301 (van Weeren et al., 2010).
Since the synchrotron/IC cooling time scales as
| (25) |
(Webb et al., 1984), behind the shock the width of the distribution of CR electrons with becomes . For instance, electrons radiating synchrotron at GHz have mostly the Lorentz factor of in the magnetic field of a few G. So the width of the synchrotron emitting region behind the shock is as long as the shock age . This is indeed of order the width of bright radio relics such as CIZA J2242.8+5301 (van Weeren et al., 2010).
Moreover, from the fact that , we can identify another feature in the integrated synchrotron spectrum. The volume integrated electron spectrum, , steepens by one power of above the break Lorentz factor, , where is the shock age. Note that the break Lorentz factor is basically derived from the condition, in Equation (25) and so independent of the shock speed. Hence, if , in observations of unresolved sources, the integrated synchrotron emission, , has the spectral slope for and for . Here, the two characteristic frequencies, and , correspond to the peak frequency in Equation (20) for and , respectively. So the spectral slope of the integrated spectrum just below the cutoff frequency is steeper by 0.5 than that of the resolved spectrum.
6 SUMMARY
Cosmological shocks are expected to be present in the large-scale structure of the universe. They form typically with Mach number up to and speed up to a few 1000 km s-1 at the present universe. Shocks in ICMs and cluster outskirts with relatively high X-ray luminosity, in particular, have the best chance to be detected, so they have started to be observed as X-ray shocks and radio relics (see Introduction for references). Those shocks are mostly weak with small Mach number of , because they form in the hot gas of keV.
In this paper, we have studied DSA at weak cosmological shocks. Since the test-particle solutions could provide a simple yet reasonable description for weak shocks, we first suggested analytic solutions which describe the time-dependent DSA in the test-particle regime, including both the pre-existing and injected CR populations. We adopted a thermal leakage injection model to emulate the acceleration of suprathermal particles into the CR population, along with a simple transport model in which Alfvén waves self-excited by the CR streaming instability drift relative to the bulk plasma upstream of the gas subshock.
We then performed kinetic DSA simulations and compared the analytic and numerical solutions for wide ranges of model parameters relevant for shocks in ICMs and cluster outskirts: the shock Mach number , the slope of the pre-existing CR spectrum , the ratio of the upstream CR to gas pressure , the injection parameter , and the Alfvénic speed parameter . The upstream gas was assumed to be fully ionized with K.
The main results can be summarized as follows:
1) For weak shocks with , the test-particle solutions given in Equation (15) should provide a good approximation for the time-dependent CR spectrum at the shock location. We note that the test-particle slope, , in Equation (2) and the maximum momentum, , in Equation (3) may include the Alfvénic drift effect.
2) For the injection parameter considered here, , the injection fraction is rather low, typically to for . The pre-existing CR population provides more particles for DSA than the freshly injected population. Hence, the pre-existing population dominates over the injected population. If there exist no CRs upstream (), the downstream CR pressure absorbs typically much less than % of the shock ram pressure for . With pre-existing CRs that accounts for 5 % of the gas thermal pressure in the upstream flow, the CR acceleration efficiency increases to a few to 10 % for those weak shocks.
3) For the pre-exisiting population, the enhancement of the distribution function across the shock, , at a given momentum is substantially larger than that expected from the simple adiabatic compression. Hence, with amplified magnetic fields downstream, the re-acceleration of pre-existing CR electrons can result in a substantial synchrotron radiation behind the shock. We estimated that the enhancement in synchrotron radiation across the shock, , is about a few to several for , while it could reach to for , depending on the detail model parameters. This is substantially larger than the enhancement in X-ray emission.
4) Unlike protons, relativistic electrons lose energy by synchrotron emission and IC scattering behind the shock, resulting in a finite width of synchrotron emitting region. In ICMs and cluster outskirts with G fields, the radio synchrotron emission at GHz originate mostly from the relativistic electrons with , which cool in a time scale of yrs. So the width of the GHz synchrotron emitting region is for a shock of age .
Finally, although the CRASH numerical code and our thermal leakage model are developed for quasi-parallel shocks, the main conclusions in this paper should be valid for quasi-perpendicular shocks as well. It is recognized that the injection may be less efficient and the self-excited waves are absent at perpendicular shocks. However, both of these problems are alleviated in the presence of pre-existing CRs and turbulence (Giacalone, 2005; Zank et al., 2006). So the diffusion approximation should be valid and the re-acceleration of pre-existing CRs are similar at both kinds of shocks. Then, we expect our results can be applied to, for instance, CIZA J2242.8+5301, the radio relic whose magnetic field direction inferred from the polarization observation is perpendicular to the shock normal.
References
- Abdo et al. (2010) Abdo, A. A. et al. 2010, Science, 327, 1103
- Ackermann et al. (2010) Ackermann, M. et al. 2010, ApJ, 717, L71
- Amato & Blasi (2006) Amato, E., & Blasi, P. 2006, MNRAS, 371, 1251
- Bagchi et al. (2006) Bagchi, J., Durret, F., Neto, G. B. L., & Paul, S. 2006, Science, 314, 791
- Bell (1978) Bell, A. R. 1978, MNRAS, 182, 147
- Bell (2004) Bell, A.R., 2004, MNRAS, 353, 550
- Brunetti & Lazarian (2007) Brunetti G., & Lazarian, A. 2007, MNRAS, 378, 245
- Caprioli et al. (2009) Caprioli, D., Blasi, P., & Amato, E. 2009, MNRAS, 396, 2065
- Carilli & Taylor (2002) Carilli, C. L., & Taylor, G. B. 2002, ARA&A, 40, 319
- Cassano & Brunetti (2005) Cassano, R., & Brunetti, G. 2005, MNRAS, 357, 1313
- Cen & Ostriker (1999) Cen, R., & Ostriker, J. P. 1999, ApJ, 514, 1
- Cen & Ostriker (2006) Cen, R., & Ostriker, J. P. 2006, ApJ, 650, 560
- Chandran (2005) Chandran, B. D. G. 2005, Phys. Rev. Lett., 95, 265004
- Donnert et al. (2010) Donnert, J., Dolag, K., Cassano, R., & Brunetti, G. 2010, MNRAS, 407, 1565
- Drury (1983) Drury, L. O’C. 1983, Rept. Prog. Phys., 46, 973
- Finoguenov et al. (2010) Finoguenov, A., Sarazin, C. L., Nakazawa, K. Wik, D. R., & Clarke, T. E. 2010, ApJ, 715, 1143
- Giacalone (2005) Giacalone, J., 2005, ApJ, 628, L37
- Giacalone & Jokipii (2007) Giacalone, J., & Jokipii, J. R. 2007, ApJ, 663, L41
- Govoni & Feretti (2004) Govoni, F., & Feretti, L. 2004, Int. J. Mod. Phys. D, 13, 1549
- Hoeft et al. (2008) Hoeft, M., Bruggen, M., Yepes, G., Gottlober, S., & Schwope, A., 2008, MNRAS, 391, 1511
- Kang et al. (2002) Kang, H., Jones, T. W., & Gieseler, U. D. J. 2002, ApJ, 579, 337
- Kang & Jones (2007) Kang, H., & Jones, T. W. 2007, Astropart. Phys., 28, 232
- Kang & Ryu (2010) Kang, H., & Ryu, D. 2010, ApJ, 721, 886
- Kang et al. (2007) Kang, H., Ryu, D., Cen, R., & Ostriker, J. P. 2007, ApJ, 669, 729
- Kang et al. (2005) Kang, H., Ryu, D., Cen, R., & Song, D. 2005, ApJ, 620, 21
- Kang et al. (2009) Kang, H., Ryu, D., & Jones, T. W. 2009, ApJ, 695, 1273
- Lucek & Bell (2000) Lucek, S. G., & Bell, A. R. 2000, MNRAS, 314, 65
- Malkov & Völk (1998) Malkov, M. A., & Völk, H. J. 1998, Adv. Space Res., 21, 551
- Malkov & Drury (2001) Malkov M. A., & Drury, L. O’C. 2001, Rep. Prog. Phys., 64, 429
- Markevitch et al. (2002) Markevitch, M., Gonzalez, A. H., David, L., Vikhlinin, A., Murray, S., Forman, W., Jones, C., & Tucker, W. 2002, ApJ, 567, L27
- Markevitch et al. (2005) Markevitch, M., Govoni, F., Brunetti, G., & Jerius, D. 2005, ApJ, 627, 733
- Markevitch & Vikhlinin (2007) Markevitch, M., & Vikhlinin, A. 2007, Phys. Rep., 443, 1
- Miniati et al. (2000) Miniati, F., Ryu, D., Kang, H., Jones, T. W., Cen, R., & Ostriker, J. P. 2000, ApJ, 542, 608
- Morlino et al. (2009) Morlino G., Amato E., & Blasi P. 2009, MNRAS, 392, 240
- Pfrommer et al. (2006) Pfrommer, C., Springel, V., Enßlin, T. A., & Jubelgas, M. 2006, MNRAS, 367, 113
- Parizot et al. (2006) Parizot, E., Marcowith, A., Ballet, J., & Gallant, Y. A. 2006, A&A, 453, 387
- Reynolds (2008) Reynolds, S. P. 2008, ARA&A, 46, 89
- Ryu et al. (2008) Ryu, D., Kang, H., Cho, J., & Das, S. 2007, Science, 320, 909
- Ryu et al. (2003) Ryu, D., Kang, H., Hallman, E., & Jones, T. W. 2003, ApJ, 593, 599
- Ryu et al. (1993) Ryu, D., Ostriker, J. P., Kang, H., & Cen, R. 1993, ApJ, 414, 1
- Schlickeiser (2002) Schlickeiser R. 2002, Cosmic Ray Astrophysics (Berlin: Springer)
- Shu (1991) Shu, F. H. 1991, The Physics of Astrophysics Volume 1: Radiation (Mill Valley: University Science Books)
- Skilling (1975) Skilling, J. 1975, MNRAS, 172, 557
- Skillman et al. (2008) Skillman, S. W., O’Shea, B. W., Hallman, E. J., Burns, J. O., & Norman, M. L. 2008, ApJ, 689, 1063
- Vazza et al. (2009) Vazza, F., Brunetti, G., & Gheller, C. 2009, MNRAS, 395, 1333
- van Weeren et al. (2010) van Weeren, R., Röttgering, H. J. A., Brüggen, M., & Hoeft, M. 2010, Science, 330, 347
- Vladimirov et al. (2006) Vladimirov, A., Ellison, D. C., & Bykov, A. 2006, ApJ, 652, 1246
- Webb et al. (1984) Webb, G. M., Drury, L. O’C., & Biermann, P. 1984, A&A, 137, 185
- Zank et al. (2006) Zank, G. P., Li, G., Florinski, V., Hu, Q., Lario, D., & Smith, C. W. 2006, J. of Geophys. Res., 111, 06108
- Zirakashvili & Aharonian (2007) Zirakashvili V. N., & Aharonian F. A. 2007, A&A, 465, 695