Pressure cycle of superconducting Cs0.8Fe2Se2: a transport study
Abstract
We report measurements of the temperature and pressure dependence of the electrical resistivity of single crystalline iron-based chalcogenide Cs0.8Fe2Se2. In this material superconductivity with K develops from a normal state with extremely large resistivity. At ambient pressure a large “hump” in the resistivity is observed around K. Under pressure, the resistivity decreases by two orders of magnitude, concomitant with a sudden suppression around GPa. Even at GPa a metallic resistivity state is not recovered, and the “hump” is still detected. A comparison of the data measured upon increasing and decreasing the external pressure leads us to suggest that superconductivity is not related to this hump.
keywords:
Intercalated Fe chalcogenide , high pressure , superconductivity , electrical resistivity1 Introduction
From an structural point of view, FeSe is the simplest material among the new Fe-based pnictide and chalcogenide “high temperature” superconductors [1, 2]. It is a tetragonal compound in which layers formed by edge-sharing FeSe4 tetrahedra are stacked along the axes of the crystal. It possesses several outstanding characteristics, among them a large pressure effect on the superconducting temperature that increases from K to K at [3]. This steep raise in is thought to be due in part to a reduction in the distance between the Se anion and the Fe plane (known as the “anion height”), that approaches the optimum height for superconductivity [4].
Recently, a new family of Fe-based superconductors with K and the general formula AxFe2-ySe2 has been identified. Element A is either the alkaline K [5], Rb [6] or Cs [7], or also Tl in the +1 valence [8]. These compounds crystalize in the well known ThCr2Si2-type tetragonal structure(space group ), obtained by the intercalation of A in superconducting FeSe. Introducing the element A expands the tetragonal axis but reduces the anion height, that approaches the optimum value [7]. Muon-spin spectroscopy, resistivity, magnetization and differential scanning calorimetry investigations performed on the system A = Cs (hereafter Cs-122) have shown a microscopic coexistence between superconductivity and a magnetic phase with very high K [9]. A similar behavior has been subsequently reported in the system A = K, based on a neutron work [10]. Besides, resistivity measurements on K0.8Fe1.7Se2 up to GPa [11] seem to indicate that cannot be further optimized by applying high pressures and suggest a relationship between the resistivity hump around K and the occurrence of superconductivity. Our present results question this relation, in line with recent reports studying this interdependence in a large variety of samples at ambient pressure [12, 13, 14].
2 Experimental Details
Single crystals of nominal composition Cs0.8(FeSe0.98)2 were grown using Bridgman technique [7]. Detailed crystallographic analysis revealed the presence of only one single phase [15], and magnetization data [9] are compatible with 100% superconducting volume fraction (on crystals of same batch as the present one). Two samples were carefully cleaved from a larger crystal. High-pressure four-probe resistivity measurements along the basal (ab) plane were performed on sample , a cuboid. The sample together with a strip of Pb, which served as pressure gauge, was mounted in a Bridgman-type high-pressure cell [16] using steatite as transmitting medium. Electrical contacts were obtained by pressing annealed gold wires directly onto the sample. We have observed a progressive reduction of the wire-sample contact resistance, from around at GPa to at GPa. All measurements have been performed with currents ranging from to (), although larger currents do not have a measurable effect on the superconducting transition (the reported critical current density in K0.86Fe1.84Se2 is of the order of [14]).
In order to test the relation between superconductivity and the normal-state transport of Cs-122, we have studied the temperature dependence of the electrical resistivity with both increasing and decreasing pressure.
A cuboid, sample , was measured at zero pressure. Electrical contacts were obtained by gluing gold wires with the DuPont conductor paste 4929N.
3 Results
In Fig. 1-a we present the temperature dependence of the electrical resistivity of sample at selected increasing pressures (). At the lowest pressure, GPa, displays a similar dependence as sample at , which is typical of other AxFe2Se2 compounds reported in the literature [5, 14, 17, 6, 9, 18]. The resistivity first increases towards lower temperatures, it displays a “hump” at K and the superconducting transition at K. Between the onset of SC, K, and roughly K the resistivity can be described as , with and (at 1.2 GPa), see the fits in Fig. 1-a. Between and GPa the resistivity coefficient decreases roughly as . For GPa this behavior is observed in a very narrow temperature range.
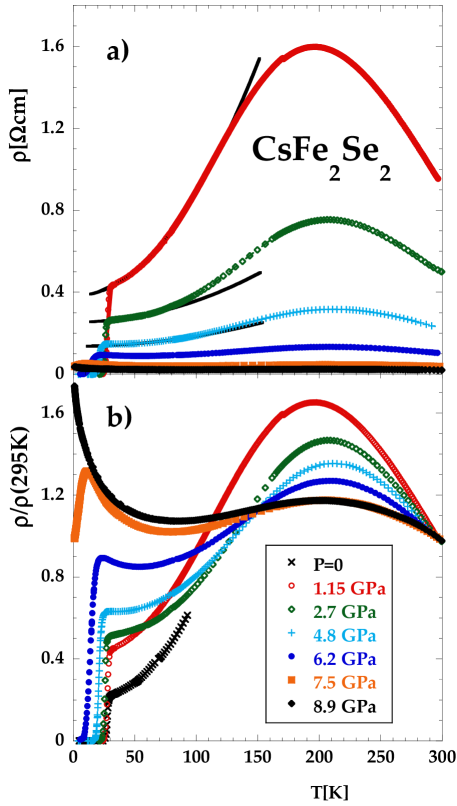
As pressure increases we observe a dramatic drop in the magnitude of the electrical resistivity. Despite the large reduction of , no metallic behavior is observed even at GPa and the hump remains at roughly the same temperature, K, although with a smaller relative amplitude. This can be seen in Fig. 1-b depicting the resistivity normalized at K, . The ratio decreases from at GPa down to at GPa. If is associated with some characteristic temperature of this material, its roughly constant value indicates that it is related to a process weakly affected by pressure.
The progressive decrease of can be followed in Fig. 1-b. For comparison, we have included the low temperature data measured at in sample . We see that remains almost unchanged between and GPa and that it decreases steadily for GPa. At GPa we only detect a partial transition while at GPa increases continuously as K. The evolution of and is depicted in the phase diagram of Fig. 3-a. We have not detected any anomaly in that may indicate that the magnetic order measured in Cs-122 at K [9, 15] is being suppressed in this pressure range.
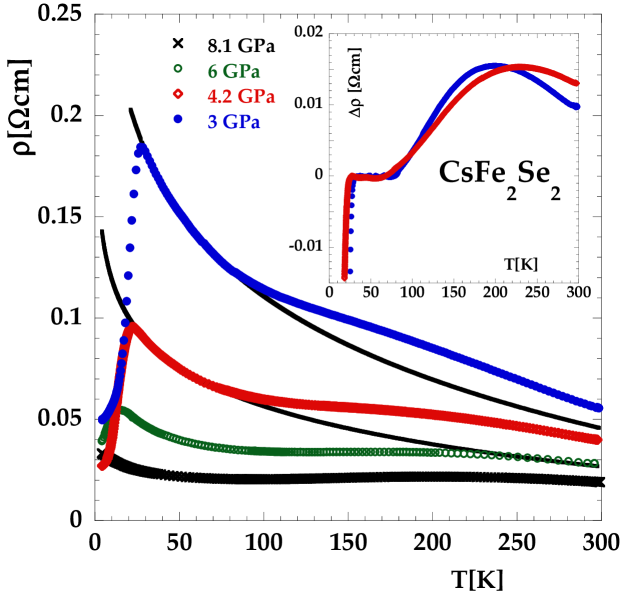
Figure 2 depicts of Cs-122 measured with decreasing pressure (). The dependence is notably changed when compared with the data presented in figure 1. The hump is no longer evident for GPa and increases continuously towards lower temperatures. For GPa and GPa the resistivity follows between and roughly K, see the fits represented by continuous curves. The inset displays for these two pressures. The maximum is still detected around K, but with a very small amplitude. Despite this we detect a partial superconducting transition with an onset that reaches K at GPa, coinciding with the onset temperature observed for GPa: the superconducting state recovers, while the hump attains only of its previous value at a similar pressure. At least phenomenologically, this superconducting state develops in a material with semiconductor-like behavior.
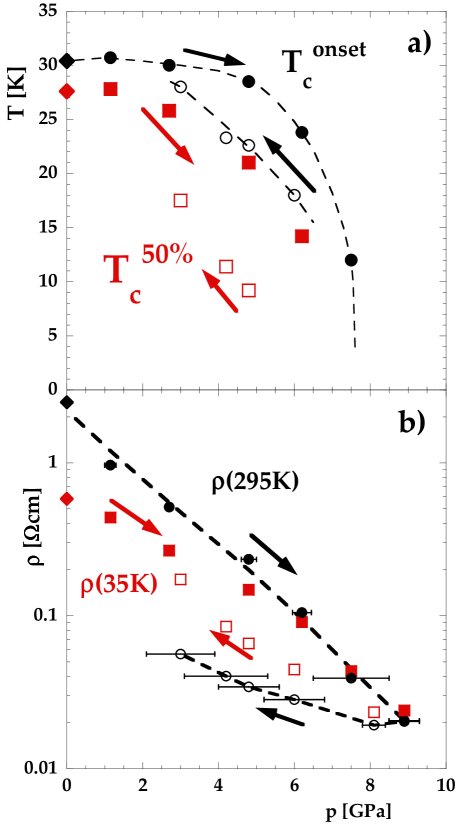
In Fig. 3-a we present the phase diagram of Cs-122, comparing the changes in the superconducting ordering temperature with increasing and decreasing pressure. The circular symbols represent the onset of superconductivity, , while the rectangular symbols indicate the mid-point of the resistive transition, . We first focus on the “increasing pressure” experiment, represented in the figure by filled symbols. At low pressures, the transition is relatively narrow so and are close and our data agree with the results reported in Ref. [19]. With increasing , diminishes although remains almost constant up to GPa. For GPa decreases steeply and it is no longer detected above GPa. We estimate a critical pressure for superconductivity GPa. The steep decrease of as contrasts with the progressive suppression of superconductivity in isostructural K0.8Fe1.7Se2 [11], although the critical pressure GPa is rather similar. Notice that this pressure should correspond to a large volume reduction of the order of [20].
With decreasing pressure (open symbols) recovers completely around GPa, although the transition is rather broad and no zero-resistance state is detected. We interpret this recovery as a reversibility of superconductivity under pressure cycling despite the apparent pressure hysteresis of roughly GPa. In Fig. 3-b we represent the and -dependence to stress that the resistivity is not reversible at all.
4 Discussion
As already pointed out, superconductivity develops in AFe2Se2 compounds out of normal state resistivities of , that is about 3 orders of magnitude higher than say in FeSe [1]. For the Cs-122 samples studied here, we estimate at . We verified that this value does not change while exposing the sample to the air for around one hour, the time necessary to cleave and close the high pressure cell. To our knowledge, there are no other systems that exhibit such a large combined with so large normal state resistivities. Even more, Hall effect data in a related compound do not point to a reduced carriers number [5]. On the other hand, it should be noted that the AFe2Se2 family is in close proximity to an insulating state [8, 13, 12]. Further, it is remarkable that the room temperature resistivity decreases two orders of magnitude between and GPa, see figure 3-b (semi-log scale). Nevertheless, even at the highest pressure (GPa) we do not observe a metallic behavior of the resistivity.
From our previous studies of organic superconductors on different pressure media [21] there is strong indication that the limited pressure conditions in the steatite medium may induce the resistivity upturn observed at low temperature. The fact that this feature steadily increases in magnitude with the number of pressure steps supports this point of view. So it remains a challenging question to determine whether the high pressure phase is intrinsically non-metallic. High pressure experiments under better hydrostatic conditions are highly desirable.
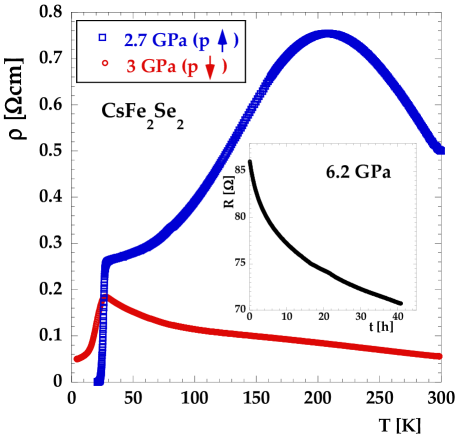
Concerning the resistivity hump, let us first recall that experimentally it is strongly affected by pressure-cycling: Figure 4 compares resistivity data at around 3 GPa for increasing and decreasing pressure. On the bottom curve () one can only see a trace around 200 K of the resistivity hump and the development of the low temperature upturn (see also Fig. 2), while the onset temperature of superconductivity recovers and is close to that when increasing pressure (, upper curve). As an explanation, one possible scenario evokes the ordering of iron vacancies in the FeSe layers just above [13, 15, 8, 22, 10, 23, 24, 25], which could be pressure-sensitive and not reversible. The inset of Fig. 4 exhibits the time evolution of the sample resistance at room temperature, just after the increase of pressure to GPa. A significant relaxation of in 24 hours is observed. We have confirmed that is reversible, meaning that this mechanism is not active at low temperatures. The observed relaxation could be related to a mechanism of moving vacancies. Whatever the microscopic origin of the resistivity hump, phenomenologically it is now clearly established from detailed composition studies that transport properties strongly depend on the Fe (and A) content in the non-stoichiometric AxFe2-ySe2 compounds [8, 13, 14, 12, 26]: in particular, decreasing the Fe deficiency shifts the hump to higher temperatures, whereas the superconducting is hardly affected. Combined with our results obtained after one pressure cycle (full recovery of but only partial of the hump), a close relationship between the resistivity hump and superconductivity seems unlikely, in contrast to the results reported in [11].
Finally, doping studies in AFe2Se2 compounds show that appears rather abruptly around K [8]. The steep decrease of in a narrow pressure range just before as well as the hysteresis suggest that the vanishing might not be a continuous phase transition. In any case, the apparent “robustness” of “30 K-superconductivity” in the AFe2Se2 family should be noted: roughly speaking, superconductivity seems to appear irrespectively of A, doping111except for Co-doping [27], quenching abruptly (quite opposite to the case of BaFe2As2) and stoichiometry (within the appropriate parameter range) with a somehow “fixed” transition temperature. Even pressure-cycling seems inefficient to significantly affect (except to make it disappear promptly above 4 GPa for Cs-122).
5 Conclusion
In conclusion, high pressure measurements on single crystalline Cs0.8Fe2Se2 show a suppression of , which is almost constant up to GPa and then it decreases steeply, not being detected above GPa. The resistivity hump of unknown origin is only very partially recovered with decreasing pressure, while seems to be reversible. This questions the connection between and the resistivity hump, in line with recent publications [12, 13, 14] that arrive at a similar conclusion. At the high pressure side of the SC-phase a metallic state is not unambiguously recovered. To test this, experiments in a more hydrostatic pressure medium should be performed.
6 Acknowledgements
This work was supported by the Swiss National Science Foundation through the NCCR “MaNEP”. P.P. is a member of CONICET.
References
- [1] F.-C. Hsu et al., Proc. Nat. Acad. Sci. U.S.A. 105 (2008) 14262.
- [2] Y. Mizuguchi et al., JPSJ 79 (2010) 102001. (review article)
- [3] Y. Mizuguchi et al., Appl. Phys. Lett. 93 (2008) 152505.
- [4] Y. Mizuguchi et al., Supercond. Sci. Technol. 23 (2008) 054013.
- [5] J. Guo et al., Phys. Rev. B 82 (2010) 180520.
- [6] A.F. Wang et al., arXiv cond-mat 1012.5525.
- [7] A. Krzton-Maziopa et al., J. Phys.: Condens. Matter 23 (2011) 052203.
- [8] M. Fang et al., arXiv cond-mat 1012.5236.
- [9] Z. Shermadini et al., arXiv cond-mat 1101.1873.
- [10] W. Bao et al., arXiv cond-mat 1102.0830.
- [11] J. Guo et al., arXiv cond-mat 1101.0092.
- [12] X.G. Luo et al., arXiv cond-mat 1101.5670.
- [13] D.M. Wang et al., arXiv cond-mat 1101.0789.
- [14] R. Hu et al., arXiv cond-mat 1102.1931.
- [15] V.Y. Pomjakushin et al., arXiv cond-mat 1102.1919.
- [16] D. Jaccard et al., Rev. High Pressure Sci. Technol. 7 (1998) 412.
- [17] H. Lei et al., arXiv cond-mat 1102.1010.
- [18] K. Wang et al., arXiv cond-mat 1102.2217.
- [19] J.J. Ying et al., arXiv cond-mat 1101.1234.
- [20] To estimate this value we consider the structural data measured on FeSe by S. Margadonna et al., Phys. Rev. B 80 (2009) 064506.
- [21] A.S. Rüetschi et al., Rev. Sci. Instrum. 78 (2007) 123901.
- [22] R.H. Liu et al., arXiv cond-mat 1102.2783.
- [23] Z. Wang et al., arXiv cond-mat 1101.2059.
- [24] P. Zavalij et al., arXiv cond-mat 1101.4882.
- [25] J. Bacsa et al., arXiv cond-mat 1102.0488.
- [26] W. Bao et al., arXiv cond-mat 1102.3674.
- [27] T. Zhou et al., arXiv cond-mat 1102.3506.