The Resolved Near-Infrared Extragalactic Background
Abstract:
We present a current best estimate of the integrated near-infrared (NIR) extragalactic background light (EBL) attributable to resolved galaxies in , , and . Our results for measurements of in units of nW m-2 sr-1 are in , in and in . We derive these new limits by combining our deep wide-field NIR photometry from five widely separated fields with other studies from the literature to create a galaxy counts sample that is highly complete and has good counting statistics out to . As part of this effort we present new ultradeep band galaxy counts from 22 hours of observations with the Multi Object Infrared Camera and Spectrograph (MOIRCS) instrument on the Subaru Telescope. We use this MOIRCS band mosaic to estimate the total missing flux from sources beyond our detection limits. Our new limits to the NIR EBL are in basic agreement with, but % higher than previous estimates, bringing them into better agreement with estimates of the total NIR EBL (resolved + unresolved sources) obtained from TeV ray opacity measurements and recent direct measurements of the total NIR EBL, as well as recent model estimates for the total light from galaxies. We examine field to field variations in our photometry to show that the integrated light from galaxies is isotropic to within uncertainties, consistent with the expected large-scale isotropy of the EBL.
1 Introduction
The near-infrared (NIR) extragalactic background light (EBL) is the total light from resolved and unresolved extragalactic sources in the NIR. This represents the integrated light from all star and galaxy formation processes over the history of the universe that has been redshifted into the NIR. Some fraction of the NIR EBL can be resolved as the light from individual galaxies (Integrated Galaxy Light, IGL), but the fractional contribution from unresolved (and perhaps unresolvable) sources is not well constrained. A measurement of the total NIR EBL minus the IGL will provide insight into the energy budget of the early universe.
While direct unresolved measurement of the NIR EBL is technically difficult due to complex foregrounds, several authors have reported a measurement of the total (resolved plus unresolved) NIR EBL (Haus98 ; Dwek98 ; Gorj00 ; Wrig01 ; Mats01 ; Mats05 ; Camb01 ; Leve07 ) and found it to be a factor of two or more above the IGL obtained through source counts (Mada00 ; Tota01 ; Thom03 ). This is known as the NIR background excess (NIRBE). The spectral energy distribution (SED) of this measured excess, in some cases, appears very similar to that of zodiacal light, which suggests there may be a foreground contamination issue. Another possible solution to this excess is a large population of undetected faint galaxies and/or population III (PopIII) stars contributing a large fraction of the NIR background (see (Kash05a ; Haus01 ) for reviews).
Since the NIR EBL presents a source of opacity for TeV rays via pair production, the density of the background light can, in principle, be measured via direct observation of TeV blazars. This method relies on assumptions of the intrinsic blazar spectrum and the SED of the EBL from ultraviolet to the NIR, both of which are poorly observationally constrained. Nevertheless, TeV rays provide an independent estimate of the NIR EBL that can be used to help determine what fraction of the background light can be attributed to resolved sources, and how much may arise from faint and possibly exotic sources in the early universe.
2 NIR Background Due to Resolved Galaxies
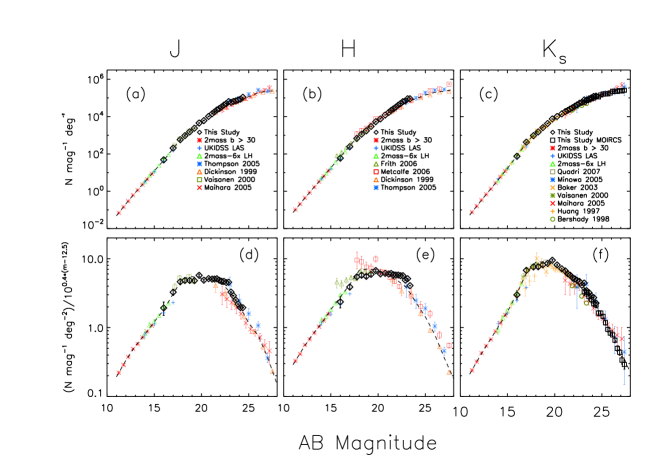
The observations and data reduction for the NIR survey data presented in this paper are described in detail in (Keen10 ), (Wang09 ) and (Barg08 ). In Figure 1 we show our completeness-corrected and averaged galaxy counts with those drawn from the literature. However, before combining all of our data in this way, we first investigated field to field variations for the IGL for our five fields over the magnitude range where all five are highly complete and have good counting statistics. We found the IGL over this magnitude range to be consistent across the four non-cluster fields (CLASXS, CLANS, CDF-N and SSA13 nW m-2 sr-1) with a dispersion of nW m-2 sr-1. As such, we find that the IGL is consistent with large-scale istropy, an expected signature of the EBL (see (Kash05a ; Haus01 ) for reviews).
In the A370 cluster field, our IGL measurements were nW m-2 sr-1 higher in all bands with the peak contribution to the excess light arising from galaxies at , consistent with an excess of galaxies at a redshift of as in A370. We include the cluster field in our average counts for this study because in a survey of a few square degrees such as this, roughly one massive cluster will be present.
Figures 1(d-f) display the same data as in panels (a-c) after dividing by an arbitrarily normalized Euclidean model (of in the form 10αm, and is a constant) to expand the ordinate and demonstrate where resolved galaxies contribute the most to the IGL. A flat line in (d-f) would imply an equal contribution to the IGL at all magnitudes. The areas of positive slope show where galaxies contribute a larger fraction to the IGL as one moves toward fainter magnitude. The steep negative slope beyond demonstrates the diminishing contribution of resolved galaxies to the IGL at the faintest magnitudes.
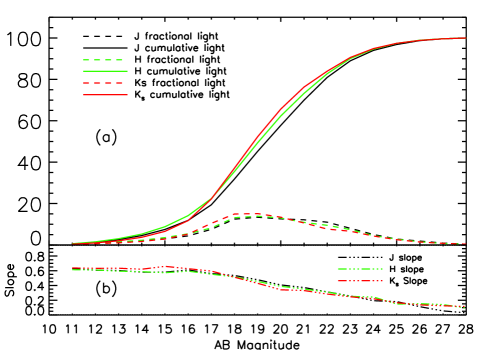
The results of our NIR IGL calculation are shown in Figure 2. Figure 2b shows the calculated slope of the galaxy counts curve as a function of apparent magnitude. Due to simple geometrical effects, when the slope drops below the total light from galaxies begins to converge. Figure 2a shows that the vast majority () of the resolved IGL arises from galaxies in the range . Over this entire range our study is highly complete and has good counting statistics.
Furthermore, from Figure 2 it can be seen that for sources fainter than to make any appreciable contribution to the IGL the counts curve would have to rise dramatically over several magnitudes beyond the limits of current surveys. Such a rise would quickly result in several (or more) galaxies per square arcsecond, rendering any counting exercise impossible due to confusion. Faint galaxies certainly exist beyond the limits of the deepest NIR surveys, because at high redshifts the faintest apparent magnitudes observed are only probing a few magnitudes fainter than down the luminosity function. It is unknown whether there is a steep upturn in the luminosity function toward faint magnitudes, but if such an upturn exists and faint galaxies contribute significantly to the NIR EBL, they would need to be so numerous as to be unresolvable. As such, it may be safe to say that the resolvable portion of the NIR EBL (the IGL) has, for the most part, been measured and that the most important contribution to the resolved portion comes from galaxies in the magnitude range , for which the deep wide-field data presented here are optimized.
3 band Missing Flux
(Thom07a ) estimated the missing flux component in the and bands from the faint outer parts of galaxies and from galaxies below their detection limits using a histogram of flux in all pixels associated with detected objects. We use a similar method to estimate the flux missed in the band. In Figure 3 we show a histogram of number of pixels versus flux for all pixels associated with detected galaxies (object pixels) in our MOIRCS band mosaic. Noting the linear trend for fluxes Jy, we fit a line to the data over this range (blue dashed line). The portion of the histogram used in the fit represents 60% of all object pixels in the image and 99% of object pixels with fluxes greater than the turnover in the histogram at Jy. The slope of the linear fit is -0.86. (Thom07a ) find a slightly steeper value of -1 by simply estimating the slope by eye. Assuming that the true flux distribution for faint pixels (Jy) continues along the same trend, we extrapolate the linear fit to approximate the shape of the histogram when all pixels in the image are accounted for. Using this method, we calculate an estimate for flux missed in the faint outer parts of galaxies and in galaxies that are below our detection limits. We find the missing flux component to be (1.9 nW m-2 sr-1) of the total band light from resolved galaxies.

4 Comparison With Previous Results
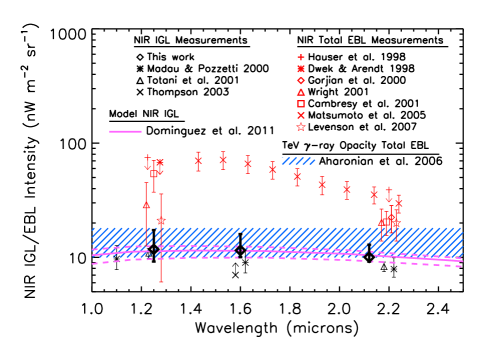
In Figure 4 we show our IGL results alongside a summary of measurements of the NIR IGL (black symbols) and EBL (red symbols) over the past decade. The purple lines show the modeled IGL from galaxies at from (Domi11 ). The blue hashed area of Figure 4 shows the allowed () NIR EBL intensity ( nW m-2 sr-1) derived from High Energy Stereoscopic System (HESS) observations of TeV blazars (Ahar06 ). (Mazi07 ) use 13 TeV blazars and a grid of NIR background intensities to further constrain the NIR EBL and find approximate agreement with the results of (Ahar06 ). As noted earlier, however, estimates of the NIR EBL from TeV ray opacity measurements rely on assumptions about the intrinsic SEDs of blazars and that of the EBL, both of which are poorly constrained observationally. Our results (black diamonds) are some % higher than previous estimates of the IGL, which puts them closer to EBL estimates from TeV blazar observations and the most recent total NIR EBL measurements.
A large NIRBE has been found by several groups, with perhaps the most striking result being that of (Mats05 ). This excess, when combined with other NIR and optical background measurements, showed an apparent spectral break around 1 m. The excess was originally attributed to PopIII stars, with the break corresponding to the redshifted Lyman limit for these stars at . However, a search for the possible absorption imprint of this break on the ray SED of blazars did not find evidence for such a feature (Dwek05a ).
5 Summary
Our new results for the NIR IGL place the best current constraints on the total NIR light from resolved galaxies and serve as a new lower limit to the total NIR EBL. While these results are in relative agreement with previous measurements, our numbers are % higher, bringing them into better agreement with those derived from ray experiments and the most recent measurements of the total NIR EBL.
We find the IGL to be roughly isotropic, consistent with the expectation of large-scale isotropy in the EBL. We confirm that the starlight subtraction for the most recent total NIR EBL measurements is correct (the reader is referred to Keenan et al. (Keen10a ) for a detailed description of this measurement).
While our measurements cannot rule out the existence of a NIRBE due to PopIII stars or other exotic early universe objects, our new lower limits on the IGL and the upper limits found from TeV ray experiments (Ahar06 ) could now be considered in rough agreement with the most recent total NIR EBL measurements in the band, and in near agreement in the band.
References
- (1) M. G. Hauser et al., The COBE Diffuse Infrared Background Experiment Search for the Cosmic Infrared Background. I. Limits and Detections, 1998, ApJ, 508, 25
- (2) E. Dwek & R. G. Arendt, A Tentative Detection of the Cosmic Infrared Background at 3.5 m from COBE/DIRBE Observations, 1998, ApJL, 508, L9
- (3) V. Gorjian, E. L. Wright, & R. R. Chary, Tentative Detection of the Cosmic Infrared Background at 2.2 and 3.5 Microns Using Ground-based and Space-based Observations, 2000, ApJ, 536, 550
- (4) E. L. Wright, DIRBE minus 2MASS: Confirming the Cosmic Infrared Background at 2.2 Microns, 2001, ApJ, 553, 538
- (5) T. Matsumoto, Observations of the Near Infrared Extragalacric Background Light, 2001, in IAU Symposium, Vol. 204, 87
- (6) T. Matsumoto et al., Infrared Telescope in Space Observations of the Near-Infrared Extragalactic Background Light, 2005, ApJ, 626, 31
- (7) L. Cambrésy et al., The Cosmic Infrared Background at 1.25 and 2.2 Microns Using DIRBE and 2MASS: A Contribution Not Due to Galaxies?, 2001, ApJ, 555, 563
- (8) L. R. Levenson, E. L. Wright & B. D. Johnson, DIRBE Minus 2MASS: Confirming the CIRB in 40 New Regions at 2.2 and 3.5 m, 2007, ApJ, 666, 34
- (9) P. Madau & L. Pozzetti, Deep galaxy counts, extragalactic background light and the stellar baryon budget, 2000, MNRAS, 312, L9
- (10) T. Totani et al., Diffuse Extragalactic Background Light versus Deep Galaxy Counts in the Subaru Deep Field: Missing Light in the Universe?, 2001, ApJL, 550, L137
- (11) R. I. Thompson, Star Formation History and Other Properties of the Northern Hubble Deep Field, 2003, ApJ, 596, 748
- (12) A. Kashlinsky, Cosmic infrared background and early galaxy evolution, 2005, Physical Reports, 409, 361
- (13) M. G. Hauser & E. Dwek, The Cosmic Infrared Background: Measurements and Implications, 2001, ARA&A, 39, 249
- (14) R. C. Keenan , L. Trouille, A. J. Barger, L. L. Cowie, & W. H. Wang, An Extremely Deep, Wide-Field Near-Infrared Survey: Bright Galaxy Counts and Local Large Scale Structure, 2010, ApJS, 186, 94
- (15) W. H. Wang, A. J. Barger & L. L. Cowie, Ultradeep Near-Infrared Observations of Goods 850-5, 2009, ApJ, 690, 319
- (16) A. J. Barger, L. L. Cowie, & W. H Wang., A Highly Complete Spectroscopic Survey of the GOODS-N Field, 2008, ApJ, 689, 687
- (17) M. F. Skrutskie et al., The Two Micron All Sky Survey (2MASS), 2006, AJ, 131, 1163
- (18) C. A. Beichman et al., A Deep 2MASS Survey of the Lockman Hole, 2003, AJ, 125, 2521
- (19) A. Lawrence et al., The UKIRT Infrared Deep Sky Survey (UKIDSS), 2007, MNRAS, 379, 1599
- (20) R. I. Thompson et al., Evidence for a z ¡ 8 Origin of the Source-subtracted Near-Infrared Background, 2007, ApJ, 657, 669
- (21) A. Domínguez, et al., Extragalactic background light inferred from AEGIS galaxy-SED-type fractions, 2011, MNRAS, 410, 2556
- (22) F. Aharonian et al., A low level of extragalactic background light as revealed by -rays from blazars, 2006, Nature, 440, 1018
- (23) D. Mazin & M. Raue, New limits on the density of the extragalactic background light in the optical to the far infrared from the spectra of all known TeV blazars, 2007, A& A, 471, 439
- (24) E. Dwek, F. Krennrich, & R. G. Arendt, Is There an Imprint of Primordial Stars in the TeV -Ray Spectrum of Blazars?, 2005, ApJ, 634, 155
- (25) R. C. Keenan , A. J. Barger, L. L. Cowie, & W. H. Wang, The Resolved Near-Infrared Extragalactic Background, 2010, ApJ, 723, 40