Origin of lithium enrichment in K giants
Abstract
In this Letter, we report on a low-resolution spectroscopic survey for Li-rich K giants among 2000 low mass () giants spanning the luminosity range from below to above the luminosity of the clump. Fifteen new Li-rich giants including four super Li-rich K giants ((Li) ) were discovered. A significant finding is that there is a concentration of Li-rich K giants at the luminosity of the clump or red horizontal branch. This new finding is partly a consequence of the fact that our low-resolution survey is the first large survey to include giants well below and above the RGB bump and clump locations in the HR diagram. Origin of the lithium enrichment may be plausibly attributed to the conversion of 3He via 7Be to 7Li by the Cameron-Fowler mechanism but the location for onset of the conversion is uncertain. Two possible opportunities to effect this conversion are discussed: the bump in the first ascent of the red giant branch (RGB) and the He-core flash at the tip of the RGB. The finite luminosity spread of the Li-rich giants serves to reject the idea that Li enhancement is, in general, a consequence of a giant swallowing a large planet.
1 Introduction
Lithium is readily destroyed within a main sequence star and may survive only in a very thin surface layer provided that mixing between this layer and the interior does not occur. Surviving surface Li is greatly diluted as a star evolves to become a red giant because an extensive convective envelope develops. Standard stellar evolutionary models predict Li dilution by a factor of about 60 for low-mass solar-metallicity stars (Iben 1967a, b). Thus, a star of approximately solar metallicity with an initial (say, meteoritic) Li abundance of (Li) 3.2 is predicted to have a Li abundance of 1.5 on the red giant branch (RGB). In general, observations of Li abundances in K giants confirm these predictions in the sense that the predicted Li abundance is the upper limit to observed Li abundances except for extremely rare cases exhibiting a higher Li abundance. For many RGB stars, Li is less than the predicted (Brown et al. 1989; Mallik 1999), and this is likely due to a combination of enhanced destruction of Li by mixing within a giant’s main sequence progenitor and continued destruction of Li in a giant.
This comfortable picture of destruction and dilution was demonstrated to be incomplete by the serendipitous discovery of an unusually large amount of Li in a K giant (Wallerstein & Sneden 1982). Since then a few more Li-rich K giants of solar metallicity have been discovered including examples with Li abundances at or even exceeding the expected maximum Li abundance of main sequence stars. The first systematic search for Li-rich K giants (Brown et al. 1989) demonstrated the rarity of Li-rich giants, just about 1, in the solar neighborhood.
In this Letter, we present results from a large survey of K giants designed to find additional Li-rich examples, locate their appearance in the HR diagram and so provide essential material for testing hypotheses about Li-enrichment. For example, Li production may be associated with the bump in the luminosity function for stars on the RGB as suggested from observations by Charbonnel & Balachandran (2000). Depending on mass and composition the bump occures on RGB between luminosities, log (L/L⊙) = 1.5 - 2.2, and this has been predicted (Iben 1968) as a region where evolution of a giant is slowed down creating a bump in the luminosity function of stars along the RGB. Internally, the bump is associated with the H-burning shell crossing over of H-discontinuity. Additionally or alternatively, the He-core flash may be the trigger for Li production and the creation of Li-rich red clump (horizontal branch) stars. Discrimination between bump and clump is possible because the two groups appear in somewhat different places in the HR diagram. Our 2000 giants provide a reference sample comfortably spanning the luminosity of the clump and the bump. Also, the survey designed to test the suggestion of planet engulfment scenario by including giants from all the way from the base of RGB to well above the clump/bump luminosities. With Brown et al.’s survey, a total of 2644 giants covering a wide range of luminosities and effective temperatures represent a potent database in which to search for clues to the origin of the Li enrichment in K giants.
This Letter is restricted to discussing the location of the Li-rich stars in the Hertzsprung-Russell diagram. Full details of the survey will be provided in a subsequent publication.
2 Sample Selection and Observations
K giants with accurate astrometry (parallaxes and proper motions) were chosen from the Hipparcos catalogue (Perryman et al. 1997; van Leeuwen 2007) to span the luminosity bump on the RGB. Stars were selected according to their (B-V) color such that stars were confined to the mass range of 0.8 - 3.0. Filters were applied to select nearby (d 150 pc) bright (mV 8) stars within the declination range of 60 80 deg. These criteria resulted in a total of 2000 K giants. All of which were observed at low spectral resolution (R=/ 3500) at one of three telescopes: the 2-m Himalayan Chandra Telescope (HCT) with the faint object spectrograph camera (HFOSC) at the Indian Astronomical Observatory (IAO), Hanle; the 1-m Zeiss telescope fitted with the universal astro-grating spectrograph (UAGS), and the 2.34-m Vainu Bappu Telescope (VBT) fitted with the optometrics medium resolution spectrograph (OMRS) at the Vainu Bappu Observatory (VBO), Kavalur.
Sample low resolution spectra showing Li and Ca features is shown in Fig. 1. The K giants with a moderate to strong Li doublet at 6707.7 Å were identified and pursued at high resolution (R=60,000) spectroscopy with the 2.34-m VBT equipped with the echelle spectrograph (Rao et al. 2005) and/or with the 2.7-m Harlan J. Smith telescope with Robert G. Tull coudé echelle spectrometer (Tull et al. 1995) at the McDonald Observatory. The raw data were processed under standard tasks in the package.111The IRAF software is distributed by the National Optical Astronomy Observatories under contract with the National Science Foundation.
The parameters luminosity and effective temperature are obtained in identical fashion for the stars in our and Brown et al.’s survey. Luminosities are obtained using parallaxes from the Hipparcos catalogue and the magnitudes (mV) taken from the SIMBAD data base. Effective temperatures () are derived using the (B-V) color and the calibration given in Alonso et al. (1999). Since sample stars are nearby, the effects of interstellar extinction are not taken into account. However, we note that by neglecting reddening we would have underestimated by about 50 - 100K considering canonical reddening of about E(B-V) 0.03 - 0.05 for giants of distances of 100 to 200 pc. Neglecting reddening will not affect the of Li-rich K giants because these temperatures were derived using iron lines in the high resolution spectra. The temperatures derived from high resolution spectra are in good agreement (within 100K) with the values derived for the same stars using the (B-V) color and the Alonso et al. (1999) calibration.

3 Lithium Abundances
Lithium abundances of the stars observed at low resolution were estimated from the strength of the Li i 6707.7 Å doublet relative to that of the Ca i line at 6717.6 Å. An empirical relation between the line-depth ratio of Li and Ca lines and the Li abundance was derived from known Li-rich K giants with Li abundances from high-resolution spectra. Fifteen K giants in our survey were estimated to be Li-rich on the basis of the low resolution spectra. Accurate abundances for these stars were then obtained from high resolution spectroscopic analysis (Table 1). Previously known Li-rich giants of which several were reobserved and reanalysed are listed in Table 2. Our survey confirms the earlier survey (Brown et al. 1989) that the Li-rich K giants are rare.
Tables 1 and 2 give the atmospheric parameters (, , and [Fe/H]) derived from iron lines in the high-resolution spectra. A majority of the entries for Table 2 are taken from the papers reporting the Li abundances. The LTE and Non-LTE Li abundances are tabulated where the latter are based on the recipe given in Lind et al. (2009). In the Tables, we also present 12C/13C values for the Li-rich K giants. The values of 12C/13C measurements are based on molecular lines in the 8003Å region using a similar procedure to that described in Kumar & Reddy (2009). For a few giants carbon ratios couldn’t be determined owing to their large rotation and as a result broad spectral features.
4 The Hertzsprung-Russell Diagram
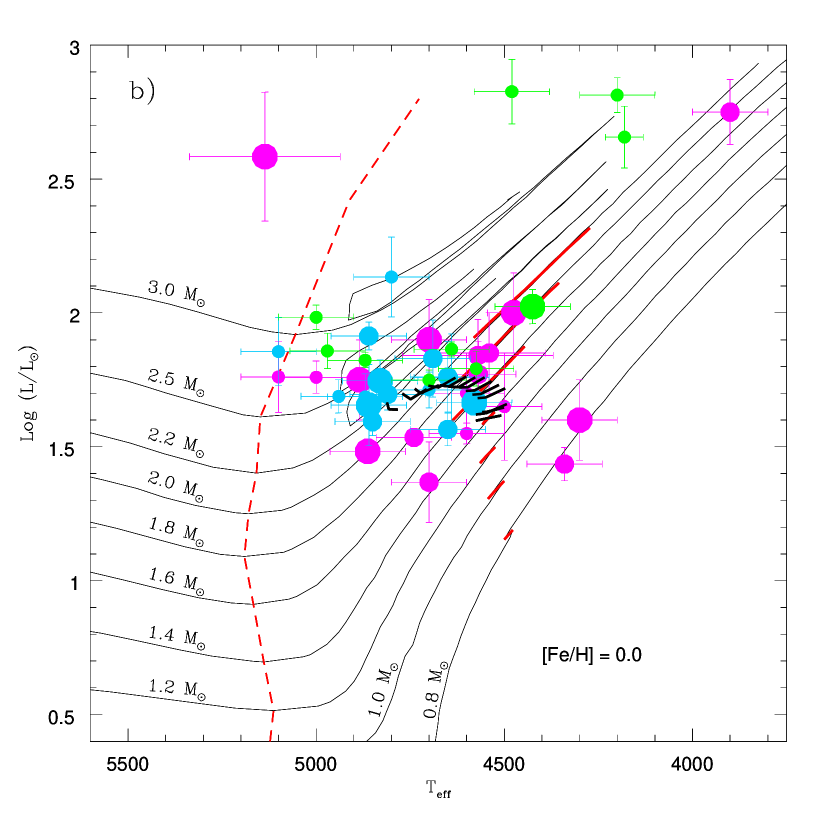
Giants from our and Brown et al.’s surveys are shown on the HR diagram in Fig. 2 along with evolutionary tracks (Bertelli et al. 2008) computed for solar metallicity, [Fe/H] = 0.0, and stellar masses ranging from 0.8 to 3. All stars observed only at low resolution are assumed to have a solar metallicity. For Li-rich K giants actual metallicities measured from the high resolution spectra are adopted and most are close to solar values. Errors derived from the quoted uncertainties in the parallaxes and in the derivation of temperatures for the Li-rich K giants are marked in Fig. 2.
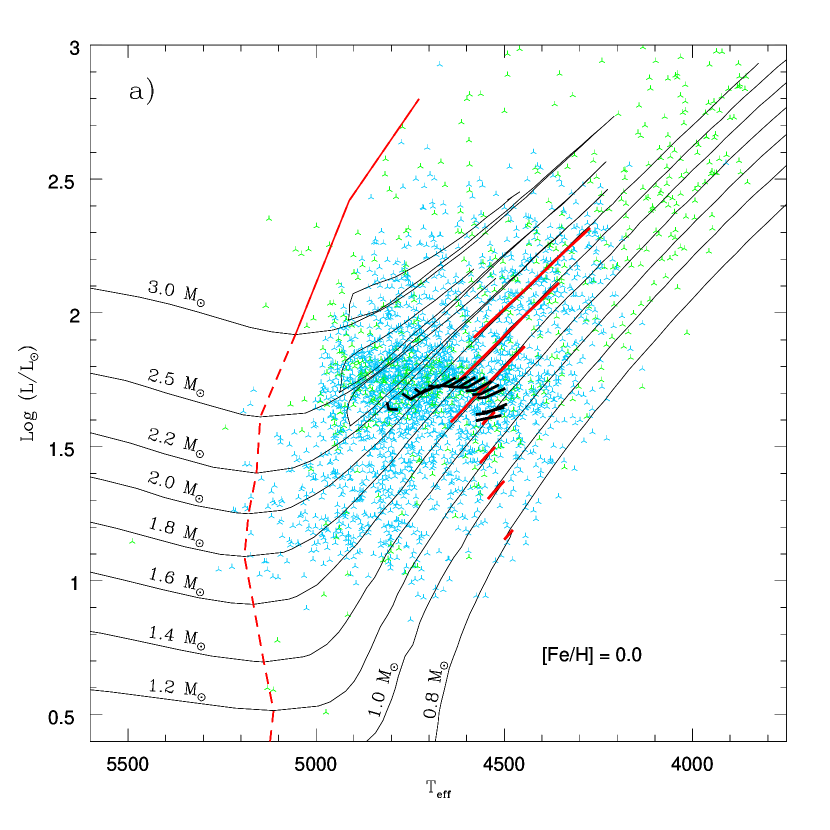
All but a very few stars in the two samples have evolved beyond the base of the RGB (the red dashed line in Fig. 2) and, therefore, their surface Li abundance has been greatly diluted. In panel a of Fig. 2, there is the expected concentration of stars with luminosities of about . This population in the HR diagram in the main are red clump (horizontal branch) He-core burning stars that have evolved from the tip of the RGB: the thick black line in Fig. 2 shows the predicted locations of clump stars. Extension of the concentration to cooler temperatures may include stars at the bump luminosity of the first ascent RGB stars (see red portions of the evolutionary tracks). Dominance of the HR diagram by clump stars is expected because the lifetime of a clump star is typically one to two orders of magnitude longer than for a bump star. This argument is not strictly applicable to the Li-rich stars because their frequency is also dependent on the probabilities that clump and bump stars produce lithium.
Except for five luminous examples, the Li-rich stars are either at the luminosity of the clump or within the range of expected values for the bump, a range spanning the clump’s luminosity. The five luminous exceptions must owe their Li richness to different phenomena than those accounting for the majority of the Li-rich stars. For example, HD 39853 (Gratton & D’Antona 1989) in Table 2 is a Li-rich K giant but with log L/L⊙=2.7 is probably a post-clump early AGB candidate where, as discussed by Charbonnel & Balachandran (2000), Li-production by the Cameron-Fowler mechanism has occurred by a variant of its operation in bump stars (see below). In contrast, the high luminosity warm (K) Li-rich star HD 21018 is, as suggested by Charbonnel & Balachandran (2000), caught prior to dilution of lithium by the convective envelope, i.e., it is a Li-normal star exhibiting a Li abundance close to its in initial abundance. We focus here on the Li-rich giants at bump and clump luminosities.
5 Lithium-synthesis at the bump and/or clump?
Since the Li-rich K giants are concentrated within a narrow luminosity range, one may suppose a significant event must be associated directly or indirectly with this range. One suspects that the significant event is either the bump on the first ascent of the RGB and/or associated with the red clump formed of He-core burning giants that have experienced the He-core flash at the tip of the RGB.
The observed luminosity range is crossed by first ascent RGB stars in which the H-burning shell passes into the region that previously was the maximum extent reached by the convective envelope. When the outward moving H-burning shell, as a result of increasing He-core mass, first encounters this region, a star reacts to the increased availability of H by lowering the surface luminosity. After a while, the giant continues its ascent of the RGB. This creates a kink on the evolutionary tracks for stars of masses up to 2M⊙ (Iben 1968; Bertelli et al. 2008) and a bump in the luminosity function along the RGB. As shown in Fig. 2, the kink on the evolutionary tracks (Bertelli et al. 2008) is visible only up to 2M⊙ for solar metallicity stars.
Internally, the kink is associated with an inversion in the run of mean molecular weight with distance from the stellar center. This inversion is linked to destruction of 3He by the reaction 3He(3He,2)4He which lowers the mean molecular weight, and the homogenization of the composition within the convective enevelope. Eggleton et al. (2008) show that this inversion leads to ‘compulsory’ mixing and changes to the surface abundances of C,N, and O isotopic abundances, i.e., the 12C/13C ratio is lowered relative to its value before the bump. Charbonnel & Lagarde (2010) recognize too that mixing occurs as a result of the molecular weight inversion but include the effects of rotationally-induced mixing to drive the mixing. This mixing referred to as -mixing by Eggleton et al. (2008) or thermohaline mixing by Charbonnel & Lagarde (2010) is observationally confirmed by measurements of the 12C/13C ratio in giants along the RGB showing a decrease in the ratio at and above the luminosity of the bump.
As -captures on 12C create 13C, the reservoir of primordial and main-sequence synthesized 3He is depleted. It is this reservoir that is a potential source of 7Li from the Cameron-Fowler (Cameron & Fowler 1971) mechanism (3He(4He,)7Be()7Li) but in order for the 7Li to enrich the stellar atmosphere it and its progenitor 7Be must be swept quickly to temperatures too cool for proton captures to occur. Eggleton et al. (2008) calculations show that more than about 80% of the 3He is destroyed in stars of masses less than about 1.5. This destruction seems unlikely to produce lithium because the mixing is too slow for the 7Be and 7Li to avoid destruction by protons (Lattanzio et al. 2008). However, the initial subsurface 3He reservoir is such that only a minor fraction of the 3He need be converted with moderate efficiency to provide a Li-rich giant. It is anticipated that the lithium produced as the star crosses the bump’s luminosity will be destroyed as the star with its convective envelope evolves to the tip of the RGB.
The evidence from Fig. 2 is that few of the Li-rich stars are aligned along the run of bump stars in the HR diagram. Although the cooler Li-rich stars are likely to be bump stars, many Li-rich stars are too warm to be so identified. Thus, we suggest that Li-rich stars cannot be identified exclusively with the bump. Rather the colocation of the Li-rich stars in Fig. 2 with the high concentration of observed (Li-normal) giants and the theoretical location of the clump suggests that they are clump stars. Since Li, if produced at the bump on the RGB is almost certainly destroyed by the time the star has evolved up the RGB to experience the He-core flash, the speculation is that the Cameron-Fowler mechanism operates at the He-core flash in at least some stars, i.e., in stars of . Since Eggleton et al. (2008) predict survival of 3He in stars with , there seems in principal the possibility that the He-core flash may be the key to synthesis of lithium in stars in a narrow mass range centered at about 2 with the range’s the upper limit set by the maximum mass for a He-core flash and the lower limit set by survival of sufficient 3He following or thermohaline mixing on the RGB. Evidently, the concentration of Li-rich stars at the clump implies that the synthesized Li is swiftly destroyed as a clump star evolves along the early reaches of the AGB. If all stars evolving through the He-core flash synthesize copious amounts of Li, they survive as a Li-rich giant for about one per cent of their horizontal branch lifetime, i.e., about 2 Myr. (The four luminous Li-rich stars in Fig. 2 have a mass in excess of those experiencing the He-core flash. Charbonnel & Balachandran (2000) suggest that these tap their 3He to produce Li as the He-burning shell evolves outward.)
6 Conclusions
The principal novel result here is that the majority of Li-rich K giants have a luminosity and effective temperature combination suggesting that Li production occurs at the He-core flash in those stars. Although this speculation about the He-core flash has yet to be supported by calculations, the nuclear physics of Li production is surely that described by the Cameron-Fowler mechanism, i.e., conversion of 3He to 7Li by -capture with 7Be as a radioactive intermediary. An earlier suggestion that Li production, also by the Cameron-Fowler mechanism, occurs at the luminosity bump of the RIB (Charbonnel & Balachandran 2000) is required to account for cooler Li-rich stars.
Our discovery of that Li-rich giants are concentrated within a narrow luminosity range does not support a view that Li-rich giants result from the swallowing by the giant of a gaseous planet (Alexander 1967) or some other external origin.
It remains to confirm and interpret suggestions that Li-rich K giants may be unusual with respect to other K giants in exhibiting rapid rotation and/or an infrared excess (see, for example, Drake et al. 2002; Charbonnel & Balachandran 2000). There are certainly Li-rich giants with normal 12C/13C ratios (e.g., HD 108471 in Table 2), and/or rapidly rotating surfaces (e.g., HD 217352 with km s-1, Strassmeier et al. 2000), and/or infrared excesses (e.g., PDS 365, Drake et al. 2002).
Perhaps, an area for observational scrutiny is a full determination of the C, N, and O elemental and isotopic abundances in order to search for discriminant between the candidate bump and clump Li-rich stars themselves and between these Li-rich stars and bump and clump stars exhibiting a normal Li abundance. Finally, a radial velocity study should be undertaken to see if the collection of Li-rich stars have the normal degree of binarity.
References
- Alexander (1967) Alexander, J. B. 1967, The Observatory, 87, 238
- Alonso et al. (1999) Alonso, A., Arribas, S., & Martínez-Roger, C. 1999, A&AS, 140, 261
- Balachandran et al. (2000) Balachandran, S. C., Fekel, F. C., Henry, G. W., & Uitenbroek, H. 2000, ApJ, 542, 978
- Barrado y Navascues et al. (1998) Barrado y Navascues, D., de Castro, E., Fernandez-Figueroa, M. J., Cornide, M., & Garcia Lopez, R. J. 1998, A&A, 337, 739
- Berdyugina & Savanov (1994) Berdyugina, S. V. & Savanov, I. S. 1994, Astronomy Letters, 20, 639
- Bertelli et al. (2008) Bertelli, G., Girardi, L., Marigo, P., & Nasi, E. 2008, A&A, 484, 815
- Brown et al. (1989) Brown, J. A., Sneden, C., Lambert, D. L., & Dutchover, E. J., Jr. 1989, ApJS, 71, 293
- Cameron & Fowler (1971) Cameron, A. G. W. & Fowler, W. A. 1971, ApJ, 164, 111
- Carlberg et al. (2010) Carlberg, J. K., Smith, V. V., Cunha, K., Majewski, S. R., & Rood, R. T. 2010, ApJ, 723, L103
- Charbonnel & Balachandran (2000) Charbonnel, C. & Balachandran, S. C. 2000, A&A, 359, 563
- Charbonnel & Lagarde (2010) Charbonnel, C. & Lagarde, N. 2010, A&A, 522, A10
- Drake et al. (2002) Drake, N. A., de la Reza, R., da Silva, L., & Lambert, D. L. 2002, AJ, 123, 2703
- Eggleton et al. (2008) Eggleton, P. P., Dearborn, D. S. P., & Lattanzio, J. C. 2008, ApJ, 677, 581
- Gratton & D’Antona (1989) Gratton, R. G. & D’Antona, F. 1989, A&A, 215, 66
- Iben (1968) Iben, I., Jr. 1968, Nature, 220, 143
- Iben (1967a) Iben, I. Jr. 1967a, ApJ, 147, 650
- Iben (1967b) Iben, I. Jr. 1967b, ApJ, 147, 624
- Jasniewicz et al. (1999) Jasniewicz, G., Parthasarathy, M., de Laverny, P., & Thévenin, F. 1999, A&A, 342, 831
- Kumar & Reddy (2009) Kumar, Y. B. & Reddy, B. E. 2009, ApJ, 703, L46
- Lattanzio et al. (2008) Lattanzio, J. C., Dearborn, D. S. P., & Eggleton, P. P. 2008, in American Institute of Physics Conference Series, Vol. 1001, Evolution and Nucleosynthesis in AGB Stars, ed. R. Guandalini, S. Palmerini, & M. Busso, 279–286
- Lind et al. (2009) Lind, K., Asplund, M., & Barklem, P. S. 2009, A&A, 503, 541
- Luck & Heiter (2007) Luck, R. E. & Heiter, U. 2007, AJ, 133, 2464
- Mallik (1999) Mallik, S. V. 1999, A&A, 352, 495
- Mishenina et al. (2006) Mishenina, T. V., Bienaymé, O., Gorbaneva, T. I., et al. 2006, A&A, 456, 1109
- Perryman et al. (1997) Perryman, M. A. C., Lindegren, L., Kovalevsky, J., et al. 1997, A&A, 323, L49
- Rao et al. (2005) Rao, N. K., Sriram, S., Jayakumar, K., & Gabriel, F. 2005, JApA, 26, 331
- Reddy & Lambert (2005) Reddy, B. E. & Lambert, D. L. 2005, AJ, 129, 2831
- Reddy et al. (2002) Reddy, B. E., Lambert, D. L., Hrivnak, B. J., & Bakker, E. J. 2002, AJ, 123, 1993
- Strassmeier et al. (2000) Strassmeier, K., Washuettl, A., Granzer, T., Scheck, M., & Weber, M. 2000, A&AS, 142, 275
- Tull et al. (1995) Tull, R. G., MacQueen, P. J., Sneden, C., & Lambert, D. L. 1995, PASP, 107, 251
- van Leeuwen (2007) van Leeuwen, F., 2007, Hipparcos, the New Reduction of the Raw Data, (Astrophys. Space Sci. Lib. 350, Springer, Dordrecht)
- Wallerstein & Sneden (1982) Wallerstein, G. & Sneden, C. 1982, ApJ, 255, 577
| Star | log(L/L⊙) | Teff | log | [Fe/H] | log (Li) | 12C/13C | |
|---|---|---|---|---|---|---|---|
| HD 8676 | 1.68 | 4860 | 2.95 | 0.02 | 3.86 | 3.55 | 5.0 |
| HD 10437 | 1.77 | 4830 | 2.85 | 0.10 | 3.76 | 3.48 | 5.0 |
| HD 12203 | 1.69 | 4870 | 2.65 | 0.27 | 2.01 | 2.08 | 7.5 |
| HD 37719 | 1.76 | 4650 | 2.40 | 0.09 | 2.70 | 2.71 | |
| HD 40168 | 2.10 | 4800 | 2.50 | 0.10 | 1.49 | 1.70 | |
| HD 51367 | 1.59 | 4650 | 2.55 | 0.20 | 2.58 | 2.60 | 8.5 |
| HD 77361 | 1.66 | 4580 | 2.35 | 0.02 | 3.96 | 3.80 | 4.3 |
| HD 88476 | 1.87 | 5100 | 3.10 | 0.10 | 2.12 | 2.21 | 9.0 |
| HD 107484 | 1.78 | 4640 | 2.50 | 0.18 | 2.04 | 2.14 | 12.5 |
| HD 118319 | 1.68 | 4700 | 2.20 | 0.25 | 1.88 | 2.02 | |
| HD 133086 | 1.70 | 4940 | 2.98 | 0.02 | 2.03 | 2.14 | 7.0 |
| HD 145457 | 1.61 | 4850 | 2.75 | 0.08 | 2.49 | 2.49 | 10.0 |
| HD 150902 | 1.83 | 4690 | 2.55 | 0.09 | 2.64 | 2.65 | 5.0 |
| HD 167304 | 1.93 | 4860 | 2.95 | 0.18 | 2.95 | 2.85 | 7.5 |
| HD 170527 | 1.69 | 4810 | 2.85 | 0.10 | 3.31 | 3.12 | |
| Star | log(L/L⊙) | Teff | log | [Fe/H] | log (Li) | 12C/13C | Ref. | |
|---|---|---|---|---|---|---|---|---|
| HD 787 | 2.65a | 4181 | 1.5 | 0.07 | 1.80 | 1.99a | 9 | B00,Be94 |
| HD 6665 | 1.37a | 4700a | 2.70a | 0.20a | 3.03a | 2.93a | S00 | |
| HD 9746 | 2.02a | 4425 | 2.30 | 0.05 | 3.56a | 3.44a | 24 | B00 |
| HD 19745 | 1.90 | 4700 | 2.25 | 0.05 | 3.70 | 3.40 | 16 | R05 |
| HD 21018b | 2.58a | 5150 | 1.96 | 0.15a | 3.13a | 3.06a | B98 | |
| HD 30834 | 2.81a | 4200 | 1.5 | 0.17 | 1.80 | 1.98a | 13 | B00,Be94 |
| HD 39853 | 2.75a | 3900 | 1.16 | 0.30 | 2.80a | 2.75a | 6.0 | G89 |
| HD 40827 | 1.78a | 4575 | 1.80 | 0.10 | 1.78a | 2.05a | 10a | B00 |
| HD 63798 | 1.76a | 5000 | 2.50 | 0.10 | 1.86a | 2.00a | 8.0a | M06 |
| HDE 233517 | 2.00 | 4475 | 2.25 | 0.37 | 4.11a | 3.95a | Ba00 | |
| HD 90633 | 1.55a | 4600 | 2.30 | 0.02 | 1.98a | 2.18a | 7.0a | M06 |
| HD 108471 | 1.86a | 4970 | 2.80 | 0.01 | 1.96a | 2.10a | 25 | B00 |
| HD 112127 | 1.44a | 4340 | 2.10 | 0.09 | 3.01a | 2.95a | 19a | W82 |
| HD 116292 | 1.82a | 5050 | 3.00 | 0.01 | 1.50 | 1.65 | B00 | |
| PDS 365 | 1.85 | 4540 | 2.20 | 0.09 | 3.30 | 3.13 | 12 | D02 |
| HD 120602 | 1.98a | 5000 | 3.00 | 0.08 | 1.95a | 2.07a | 16 | B00 |
| IRAS 13539-4153 | 1.60 | 4300 | 2.25 | 0.13 | 4.10 | 3.90 | 20 | R05 |
| HD 148293 | 1.86a | 4640 | 2.50 | 0.08 | 1.99a | 2.16a | 16 | B00 |
| IRAS 17596-3952 | 1.70 | 4600 | 2.50 | 0.10 | 2.20 | 2.30 | R05 | |
| HD 183492 | 1.75a | 4700 | 2.40 | 0.08 | 2.00a | 2.16a | 9 | B00 |
| PDS 100 | 1.65 | 4500 | 2.50 | 0.14 | 2.50 | 2.40 | 9.0 | R02 |
| HD 194937 | 1.54a | 4863 | 2.86 | 0.01 | 3.41 | 3.18a | L07 | |
| HD 203136 | 1.75a | 5100a | 2.80a | 0.05a | 2.25a | 2.34a | S00 | |
| HD 205349 | 2.82a | 4480 | 0.6 | 0.03 | 1.90 | 2.25a | 9 | B00,Be94 |
| HD 214995 | 1.54a | 4740 | 2.56 | 0.00 | 3.16a | 2.95a | 13.0a | L07 |
| HD 217352 | 1.77a | 4570 | 2.53 | c | 2.64 | 2.65a | S00 | |
| HD 219025 | 1.84a | 4570 | 2.30 | 0.10 | 3.00 | 2.93a | J99 | |
| G0928+73.2600 | 1.75 | 4885 | 2.65 | 0.25 | 3.62 | 3.30 | 28 | C10 |