11email: rvweeren@strw.leidenuniv.nl 22institutetext: Thüringer Landessternwarte Tautenburg, Sternwarte 5, 07778, Tautenburg, Germany 33institutetext: Jacobs University Bremen, P.O. Box 750561, 28725 Bremen, Germany 44institutetext: National Radio Astronomy Observatory, 520 Edgemont Road, Charlottesville, VA 22903-2475, USA 55institutetext: Department of Astrophysics, Institute for Mathematics, Astrophysics and Particle Physics, Radboud University, PO Box 9010, 6500 GL Nijmegen, The Netherlands
A double radio relic in the merging galaxy cluster ZwCl~0008.8+5215
Abstract
Context. Some merging galaxy clusters host diffuse elongated radio sources, also called radio relics. It is proposed that these radio relics trace shock waves in the intracluster medium (ICM) created during a cluster merger event. Within the shock waves particles are accelerated to relativistic energies, and in the presence of a magnetic field synchrotron radiation will be emitted. Here we present Giant Metrewave Radio Telescope (GMRT) and Westerbork Synthesis Radio Telescope (WSRT) observations of a new double relic in the galaxy cluster ZwCl 0008.8+5215.
Aims. The aim of the observation is to understand the phenomenon of radio relics.
Methods. We carried out radio continuum observations at 241 and 610 MHz with the GMRT, and GHz observations with the WSRT in full polarization mode. Optical V, R, and I band images of the cluster were taken with the 2.5m Isaac Newton Telescope (INT). An optical spectrum, to determine the redshift of the cluster, was taken with the William Herschel Telescope (WHT).
Results. Our observations show the presence of a double radio relic in the galaxy cluster ZwCl 0008.8+5215, for which we find a spectroscopic redshift of from an optical spectrum of one of the cD galaxies. The spectral index of the two relics steepens inwards to the cluster center. For part of the relics, we measure a polarization fraction in the range . A ROSAT X-ray image displays an elongated ICM and the large-scale distribution of galaxies reveals two cluster cores, all pointing towards a binary cluster merger event. The radio relics are located symmetrically with respect to the X-ray center of the cluster, along the proposed merger axis. The relics have a linear extent of 1.4 Mpc and 290 kpc. This factor of five difference in linear size is unlike that of previously known double relic systems, for which the sizes do not differ by more than a factor of two.
Conclusions. We conclude that the double relics in ZwCl 0008.8+5215 are best explained by two outward moving shock waves in which particles are (re)accelerated trough the diffusive shock acceleration (DSA) mechanism.
Key Words.:
Radio Continuum: galaxies – Galaxies: active – Clusters: individual : ZwCl 0008.8+5215 – Cosmology: large-scale structure of Universe1 Introduction
Radio relics are filamentary structures often located in the periphery of galaxy clusters. It is proposed that large radio relics trace shock waves generated by cluster merger events (Ensslin et al. 1998; Miniati et al. 2001). At the shock front particles from the thermal gas are accelerated to relativistic energies by DSA mechanism in a first-order Fermi process (Krymskii 1977; Axford et al. 1977; Bell 1978a, b; Blandford & Ostriker 1978; Drury 1983; Blandford & Eichler 1987; Jones & Ellison 1991; Malkov & O’C Drury 2001). In the presence of a magnetic field these particles emit synchrotron radiation at radio wavelengths. Another possibility mentioned by Markevitch et al. (2005), is that the shock re-accelerates relativistic fossil electrons injected previously into the ICM by for example AGN. They note that from an observational point of view, this case will probably be indistinguishable from the direct shock acceleration mentioned above. An alternative scenario has been recently proposed, namely that relics arise from emission of secondary cosmic ray electrons (Keshet 2010).
Some smaller radio relics (kpc) have been been explained by old (“fossil”) radio plasma from a previous episode of AGN activity. These sources are called AGN relics (see Kempner et al. 2004, for an overview of the classification of diffuse radio sources). The fossil radio plasma could also have been compressed, creating a radio phoenix (Enßlin & Gopal-Krishna 2001; Enßlin & Brüggen 2002). Both radio phoenices and AGN relics, are characterized by a very steep (, , where is the spectral index) and curved radio spectra due to synchrotron and Inverse Compton (IC) losses.
In the hierarchical model of structure formation galaxy cluster grow by the accretion of gas from the surrounding intergalactic medium (IGM) and through mergers with other clusters and galaxy groups. Large radio relics are exclusively found in disturbed clusters, indicative of merger activity. This supports the idea that shocks generated during cluster merger events can be responsible for the non-thermal radio emission. Hydrodynamical models of structure formation, including particle acceleration mechanisms (e.g., Hoeft & Brüggen 2007; Hoeft et al. 2008; Pfrommer 2008; Battaglia et al. 2009) make predictions about the location, orientation and radio power of relics in merging clusters. Amongst the several dozen radio relics known to date (e.g., van Weeren et al. 2009b; Rudnick & Lemmerman 2009; Pizzo & de Bruyn 2009; Giacintucci et al. 2008; Brentjens 2008; Kempner & Sarazin 2001; Giovannini et al. 1999, 1991), there are a few rare double relic systems, with two relics located symmetrically on opposite sites of the cluster center (e.g., van Weeren et al. 2010; Brown et al. 2010; Bonafede et al. 2009; van Weeren et al. 2009a; Venturi et al. 2007; Bagchi et al. 2006; Röttgering et al. 1997). These double relics can be used to constrain the merger geometry and timescales involved (Roettiger et al. 1999). If radio relics trace outward traveling shock waves in which DSA takes place, then the radio plasma in the post-shock region should have a steeper spectrum due to IC and synchrotron losses. For a relic seen close to edge-on, the luminosity profile across the width of the relic can then be used to constrain the magnetic fields strength at the location of the shock (Markevitch et al. 2005; Finoguenov et al. 2010). This is because the downstream luminosity profile should directly reflect the synchrotron losses, which in turn depend on the magnetic field strength. In van Weeren et al. (2010) we presented observations of a double relic in the merging cluster CIZA~J2242.8+5301, which provided evidence for DSA in galaxy cluster merger shocks. For the largest relic we derived a magnetic field strength of about 5–7 Gauss by modeling the relic’s luminosity profile across the width of the relic (although a strength of about 1.2 Gauss could not be completely ruled out).
Because there are only a few double relics systems known, we carried out an extensive search in the 1.4 GHz NVSS (Condon et al. 1998), 325 MHz WENSS (Rengelink et al. 1997), and 74 MHz VLSS (Cohen et al. 2007) surveys for the presence of arc-like radio structures around X-ray selected galaxy clusters from the ROSAT All-Sky Survey. This search already resulted in the discovery of several new radio relics, see van Weeren et al. (2009a, b, c). In this paper we present the discovery of a double relic in the galaxy cluster ZwCl~0008.8+5215 which showed faint elongated structures in both NVSS and WENSS images.
The layout of this paper is as follows. In Sect. 2 we give an overview of the observations and the data reduction. In Sect. 3 we present the radio and spectral index maps as well as optical images around the radio sources. In Sect. 4 we discuss the merger scenario and the magnetic field strength at the location of the relics. We end with conclusions in Sect. 5.
Throughout this paper we assume a CDM cosmology with km s-1 Mpc-1, , and . All images are in the J2000 coordinate system.
2 Observations & Data Reduction
2.1 GMRT observations
The GMRT observations were taken in dual-frequency mode, recording RR polarization at 610 MHz and LL polarization at 241 MHz. Total useable bandwidth was 30 MHz at 610 MHz and 6 MHz at 241 MHz. The GMRT software backend (GSB; Roy et al. 2009) was used giving 512 spectral channels. The total on source time was 220 min (3.7 hr). A summary of the observations is given in Table 1.
For the reduction we used the NRAO Astronomical Image Processing System (AIPS) package. The 610 MHz dataset was visually inspected for the presence of radio frequency interference (RFI) which was subsequently removed. Strong RFI on short baselines was present in the 241 MHz band. This RFI was fitted and subtracted from the data using the technique described by Athreya (2009) which was implemented in Obit (Cotton 2008). Summarized, the fringe-stopped correlator output of a baseline oscillates with the fringe-stop period in the presence of RFI. The fitting routine tries to fit such a signal and subtracts it from the data (Athreya 2009). This has the advantage that most of the visibilities from the short baselines are not removed (i.e., flagged) and hence spatial structure on large angular scales is preserved. We assumed the RFI to be constant over periods of 10 min and required a minimal amplitude of 5 Jy for the RFI to be subtracted. Further visual inspection of the data was carried out to remove some remaining RFI which could not be fitted because of short timescale variations of the RFI signal.
Amplitude and phase corrections were obtained for the calibrator sources using 5 neighboring channels free of RFI. These solutions were applied to the data before determining the bandpass. The bandpass was then applied and gain solutions for the full channel range were determined. The fluxes of the primary calibrators were set according to the Perley & Taylor (1999) extension to the Baars et al. (1977) scale. Several rounds of phase self-calibration and two final rounds of amplitude and phase self-calibration were carried out. We used the polyhedron method (Perley 1989; Cornwell & Perley 1992) for making the images to minimize the effects of non-coplanar baselines. Both in the 610 and 241 MHz images, there were several bright sources in the field that limited the dynamic range. Direction dependent gain solutions for these sources were obtained and these sources were subtracted from the data. This method is commonly referred to as “peeling” (e.g., Noordam 2004).
Final images were made using “briggs” weighting (with robust set to 0.5, Briggs 1995). Images were cleaned down to times the rms noise level () within the clean boxes. The images were corrected for the primary beam response111http://gmrt.ncra.tifr.res.in/gmrt_hpage/Users/doc/manual/ UsersManual/node27.html. The uncertainty in the calibration of the absolute flux-scale is between , see Chandra et al. (2004).
| 241 MHz | 610 MHz | |
| Observation date | November 22, 2009 | November 22, 2009 |
| Usable bandwidth | 6 MHz | 30 MHz |
| Channel width | 62.5 kHz | 62.5 kHz |
| Polarization | LL | RR |
| Integration time | 8 sec | 8 sec |
| Total on-source time | 220 min | 220 min |
| Beam size | ||
| Rms noise () | 483 Jy beam-1 | 38 Jy beam-1 |
2.2 WSRT GHz observations
| Frequency bands 21 cm (IFs) | 1311, 1330, 1350, 1370, 1392, 1410, 1432, 1450 MHz |
|---|---|
| Frequency bands 18 cm (IFs) | 1650, 1668, 1686, 1704, 1722, 1740, 1758, 1776 MHz |
| Bandwidth per IF | 20 MHz |
| Number of channels per IF | 64 |
| Channel width | 312.5 kHz |
| Polarization | XX, YY, XY, XY |
| Observation dates | 28 March, 25 & 31 May, 7 & 16 June 7, 2009 |
| Integration time | 30 sec |
| Total on-source time | hr (21cm) , hr (18cm) |
| Beam size | (21cm), (18cm) |
| Rms noise () | 27 Jy beam-1 (21cm), 33 Jy beam-1 (18cm) |
WSRT observations of ZwCl 0008.8+5215 were taken in the L-band, see Table 2. The observations were spread out over various runs of several hours, resulting in more or less full 12 hours synthesis coverage. Frequency switching, between the 18 and 21 cm setups, was employed every 5 min to increase the spectral baseline of the observations. Each setup had a total bandwidth of 160 MHz, evenly divided over 8 sidebands (IF). All four polarization products were recored with 64 channels per IF.
The data were calibrated using the CASA222http://casa.nrao.edu/ package. The L-band receivers of the WSRT antennas have linearly polarized feeds333The WSRT records , , , and . I, Q, U, and V are the standard Stokes parameters. Bandpass and gain solutions were determined from observations of the standard calibrators 3C48, 3C138, 3C147, 3C286, and CTD93. Time ranges for antennas affected by shadowing were removed. Some IFs were also affected by RFI and had to be partly flagged. The fluxes for the calibrators were set according to the Perley & Taylor (1999) extension to the Baars et al. (1977) scale. Frequency (channel) dependent leakage terms (D-terms) were calculated from observations of a bright unpolarized point source, while the polarization angles were set using either 3C138 or 3C286. We assumed and for the R-L phase difference of 3C286 and 3C138, respectively. The data were then exported into AIPS and several rounds of phase self-calibration, followed by two rounds of amplitude and phase self-calibration, were carried out. The solutions for the amplitude and phase self-calibration were determined combining both XX and YY polarizations because Stokes Q is not necessarily zero. Separate images for each IF were made (16 in total) using robust weighting of 0.75 (21 cm) and 1.25 (18 cm) giving roughly the same resolution. These images were corrected for the primary beam attenuation ()
| (1) |
with the distance from the pointing center in degrees, the observing frequency in GHz and , a constant444from the WSRT Guide to Observations.
Images were cleaned to about and clean boxes were used. For each frequency setup the eight images from each IF were combined, convolving the images to the same resolution of and weighting the images inversely proportional to . The images are centered at frequencies of 1382 and 1714 MHz. The final noise levels are 27 and 33 Jy beam-1 for the 21 cm and 18 cm images, respectively.
2.3 Optical images & spectroscopy
Optical images of the cluster were made with the Wide Field Camera (WFC) on the INT. The observation were taken between 1 and 8 October, 2009. The seeing varied between 0.9 and 1.3″ during the observations. Most nights were photometric. Total integration time was about 6000 sec per filter. The data were reduced in a standard way using IRAF (Tody 1986, 1993) and the mscred package (Valdes 1998). The R and I band images were fringe corrected. The individual exposures were averaged, pixels were rejected above to remove cosmic rays and other artifacts. Observations of standard stars on photometric nights were used to calibrate the flux scale. The images have a depth (signal to noise radio (SNR) of 5 for point sources) of approximately , , magnitude (Vega) in the V, R and I band, respectively.
To determine the redshift of the cluster a 600 sec WHT ACAM long-slit spectrum, with the V400 grating, was taken of 2MASX~J00112171+5231437 (Skrutskie et al. 2003). On the INT images this galaxy was identified being the largest cD galaxy of the cluster. The spectrum was taken on November 2, 2010 with a slit width of 1.5″. Standard long-slit calibration was done in IRAF.
3 Results
3.1 Redshift of ZwCl 0008.8+5215
No redshift is available in the literature for the galaxy cluster ZwCl 0008.8+5215, with coordinates RA 00h11m25.6s, DEC +52°31′41″. The cluster is located relatively close to the galactic plane at a galactic latitude . Galactic extinction is 0.812 mag in the R-band and 0.111 in the K-band according to Schlegel et al. (1998). The spectrum of cD galaxy 2MASX~J00112171+5231437 is shown in Fig. 1. From this spectrum we determine a redshift of for the galaxy, which we adopt as the redshift for ZwCl 0008.8+5215. 2MASX J00112171+5231437 is associated with a complex disturbed radio source, see Sect. 3.5.

3.2 Thermal ICM and galaxy distribution
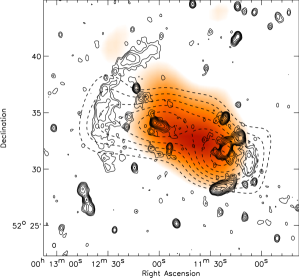
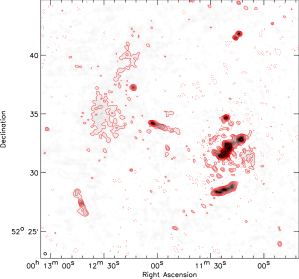
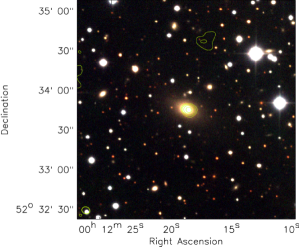
ZwCl 0008.8+5215 is seen in the ROSAT All-Sky Survey as an east-west elongated source, see Fig. 2, and listed as 1RXS~J001145.3+523147 (Voges et al. 1999). Using the redshift and the ROSAT count rate we find an X-ray luminosity () of erg s-1. With the -temperature scaling relation from Pratt et al. (2009), Table B.2 BCES Orthogonal Fitting Method, we find a corresponding temperature of keV.
We computed galaxy iso-densities from the INT images. We first created a catalog of objects using Sextractor (Bertin & Arnouts 1996). We then removed all point-like objects (i.e., stars) from the catalogs. To exclude galaxies not belonging to the cluster we selected only galaxies with RI and VR colors within magnitude from the average color of the massive elliptical cD galaxy 2MASX J00112171+5231437 (see Fig. 14 and Sect. 3.1). The range of in the colors was taken to maximize the contrast of the cluster with respect to the fore and background galaxies in the field, but not being too restrictive so that a sufficient number of candidate cluster members was selected. The galaxy iso-density contours are shown in Fig. 2. The cluster shows a pronounced bimodal structure, with two cores separated by about 700 kpc. The cluster extends somewhat further in the east-west direction than the X-ray emission from ROSAT. The cD galaxy 2MASX J00112171+5231437 belongs to the western subcluster (i.e., it is located at the center of the subcluster). The eastern subcluster also hosts a separate cD galaxy (2MASX~J00121892+5233460, see Fig. 13). Although we do not have a spectroscopic redshift for this galaxy, the (i) color and (ii) R and K magnitudes are in agreement with a subcluster located at the same redshift as the western subcluster (e.g., Willott et al. 2003; de Vries et al. 2007). The same is true for the other massive elliptical galaxies found in both subclusters, see Sect. 3.5. Therefore, both the X-ray and optical observations point towards a bi-modal galaxy cluster, indicative of an ongoing merger event. As we will show in the next sections, the radio observations also point towards a merger scenario.
3.3 Radio continuum maps
| Source | LLSb | ||||||
|---|---|---|---|---|---|---|---|
| Jy | mJy | mJy | mJy | W Hz-1 | kpc | ||
| RW | 0.37 | 290 | |||||
| RE | 1.8 | 1400 | |||||
| A | 1.1 | 270 | |||||
| B | 0.99 | 289 | |||||
| C | 2.6 | 249 | |||||
| D | … | 0.030 | … | ||||
| E | 11.9 | 200 | |||||
| F | 1.7 | 151 | |||||
| G | 0.22 | 38 | |||||
| H | 0.081 | 60 | |||||
| I | … | 0.037 | 45 |
a see also Fig. 15
b largest linear size
c between 610 and 1714 MHz
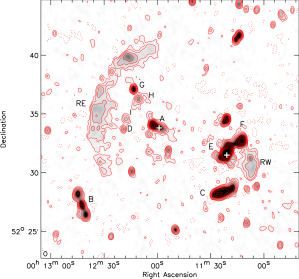
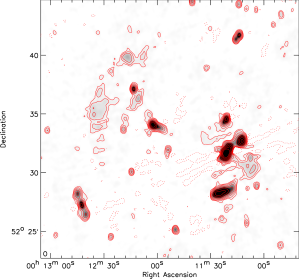
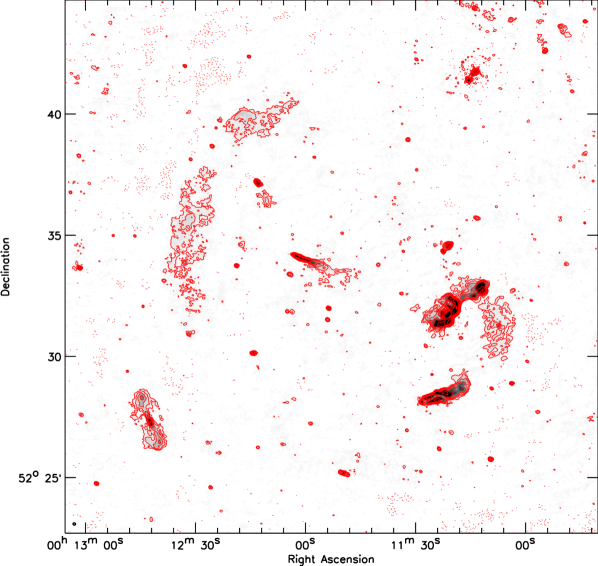
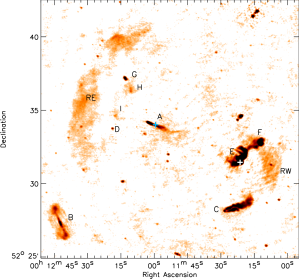
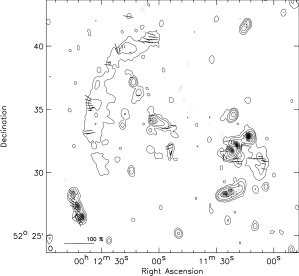
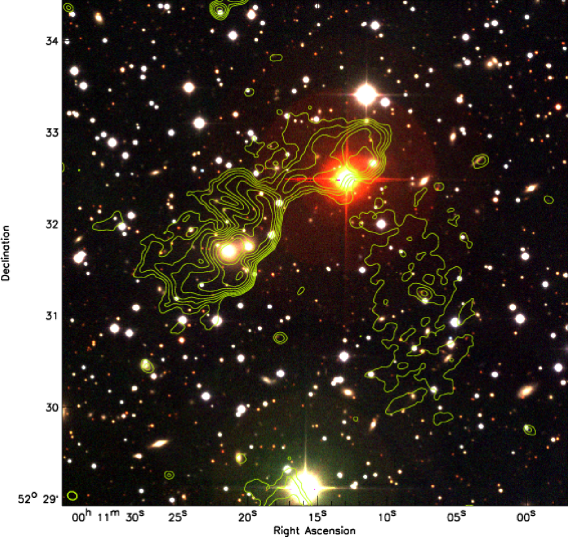
The WSRT 1382 MHz image is shown in Fig. 3. It reveals a large arc of diffuse emission on the east side of the cluster and a smaller faint diffuse source on the west side of the cluster, symmetrically with respect to the cluster center. We classify these sources as radio relics based on their location with respect to the cluster center, their morphology, and the lack of optical counterparts. The relics are located about 850 kpc from the center of the X-ray emission. Several complex tailed radio sources, related to AGN activity, are also visible. The WSRT 1714 MHz image is similar to the 1382 MHz image, although the overall signal to noise ratio is less, therefore revealing less of the diffuse extended relics. The radio relics are also visible in the GMRT 610 and 241 MHz images (Figs. 5 and 6), although at 241 MHz the SNR on the relics is per beam.
To facilitate the discussion we have labeled various sources in Figs. 3 and 7. Optical overlays can be found Sect. 3.5. The integrated fluxes, spectral indices, radio power and largest linear size for the two relics (RE & RW) are displayed in Table 3.
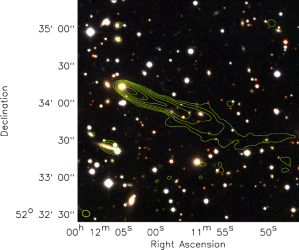
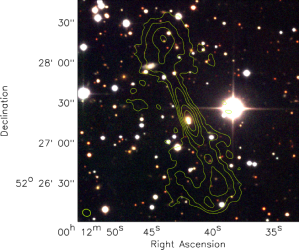
Relic RE consist of two parts, a smaller region of emission to the north and a larger one in the south (most clearly seen in Figs. 5 and 7). In the 1382 MHz image the two regions are seen connected. The eastern boundary of RE is somewhat more pronounced, while on the western side the emission fades more slowly in the direction of the cluster center. The relic has a total extent of 1.4 Mpc. The surface brightness varies across the relic fading at the extreme northern and southern ends. The northern diffuse patch has a “notch” like region of higher surface brightness. Relic RW has a much smaller extent of 290 kpc. The western boundary is more pronounced in the WSRT images. A compact source in the middle of RW is associated with a background galaxy.
The cluster also hosts a number of complex radio sources related to AGN activity, for a short discussion on these sources see Sect. 3.5.
3.4 Spectral index and polarization maps
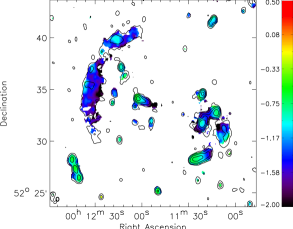
A spectral index map was computed using both the WSRT and GMRT images, including only common UV ranges. Both the WSRT and GMRT datasets have relatively good inner UV-coverage. The largest detectable angular scale is limited to about 16′ at 610 MHz, which is sufficient not to resolve out the extended radio relics. The inclusion of maps at four different frequencies enables us to map the spectral index over the low surface brightness radio relics. Spectral index maps made with only two frequency images were too noisy to map the spectral index across the relics. The spectral index map was created by fitting a single power-law through the flux measurements at 241, 610, 1382, and 1714 MHz. In this way, we only fitted for the slope and normalization of the radio spectrum, ensuring the number of free variables in the fit remains as low as possible (at the cost of detecting spectral curvature). The technique of combining maps at more than two frequencies has another advantage that errors in the maps arising from RFI, calibration errors, deconvolution errors, slightly different UV coverage, etc., are suppressed in the spectral index map as long as they do not correlate at the same location and spatial frequencies on the sky.
Pixels in the spectral index map were blanked if any of corresponding pixels in the individual maps fell below . Special care was taken about the precise alignment of the maps, we slightly shifted the GMRT maps by about a quarter of the synthesized beam, removing a small spectral index gradient visible across all the point sources. The result is shown in Fig. 8.
For relic RW, the spectral index steepens to the north and eastwards to the cluster center, from to . The spectral index for relic RE also varies roughly between and . The overall spectral index at the east side of relic RE is about There is an overall trend of spectral steepening towards the west, see also Fig. 16. The spectral index is correlated with the surface brightness of the relic, the brightest parts have a flatter spectral index (see also Fig. 16).
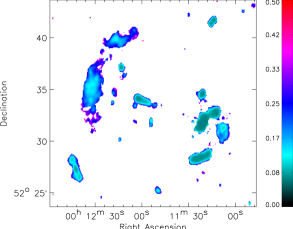
The polarization map from the WSRT at 1382 MHz is shown in Fig. 9. No useful polarization information could be extracted from the WSRT 18 cm observations. The polarization map reveals that most of the compact sources are polarized below the 5% level. Some polarized emission is detected from the two radio relics, although at low SNR. For relic RW the polarization fraction is around (reported polarization fractions are corrected for Ricean bias; Wardle & Kronberg 1974). For RE the polarization fraction varies, with a maximum of . For the fainter parts of the relics no polarized emission is detected, but this is expected if the relics are polarized at the 30% level or less. Most polarization E-vectors are aligned perpendicular to the major axis of the two relics (for the parts where polarized emission was detected).
Spectral index and polarization properties for the compact sources are discussed in Sect. 3.5.
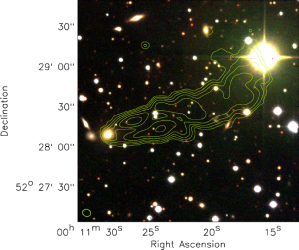
3.5 Radio galaxies in the cluster
The cluster hosts several interesting tailed radio sources. Radio overlays on optical images are shown in Figs. 10 to 14. Sources are referred to as in Fig. 7. The morphology of these radio sources is as expected for a system undergoing a merger, with high galaxy velocities with respect to the ICM. The radio powers reported for the sources in Table 3, are consistent with them being FR-I sources (Fanaroff & Riley 1974) located in the cluster (e.g., Owen & White 1991; Owen & Ledlow 1994; Baum et al. 1995).
Source A is a “head-tail” source belonging to the elliptical galaxy 2MASX~J00120320+5234132. The spectral index steepens along the tail, from to to the west. The “head” is polarized at the 1% level. The tail has a total extent of 270 kpc in the 610 MHz image. Source B is a double-lobe radio source (also listed as NVSS J001242+522717 or B0010.0+5210) consisting of a central core and two radio lobes. Additional diffuse emission is seen surrounding the lobes and the central radio core. The spectral index does not vary much over the core and radio lobes, the average spectral index is about . The radio emission from the source has a polarization fraction between 10 and 20%. An optical counterpart (2MASX~J00124217+5227182) is centered on the radio core. The source could be a cluster member as its color is similar to that of other galaxies in the cluster.
Source C is a narrow angle tailed (NAT) radio source with 2MASX~J00112859+5228096 being the optical counterpart. The spectral index steepens from to along the tails as expected for a radio galaxy moving eastwards with respect to the ICM. The radio emission is polarized at the level. Source D belongs to the cD galaxy 2MASX~J00121892+5233460 in the eastern part of the cluster and has a spectral index of . No polarized emission is detected from the source.
Source E is the brightest radio source (4C~+52.01) in the cluster and has a very complex morphology. The radio emission has a sharp western boundary, while the eastern boundary is more diffuse with “fans” of emission. The counterpart is the galaxy 2MASX~J00112171+5231437, which has a close companion to the west. The spectral index steepens to the north and south from to . Fractional polarization for the brightest emission is below 1%.
Source F has a complex morphology and is located to the northwest of E. There is a bridge of steep spectrum emission (with ) between E and F. The polarization fraction of F varies between and . The brighter parts of the source have a spectral index of . Because the spectral index here is flatter than the bridge of emission between E and F, this suggests the source is a separate radio galaxy with the emission not coming from E. The most likely counterpart is the galaxy 2MASS~J00111135+5232421. The complex morphology of both E and F suggest that the radio sources are significantly disturbed, possibly due to the merger event. The radio morphology of both E and F suggest the sources moves westwards with respect to the ICM.
We could not identify optical counterparts for sources G, H and I. However, a diffraction spike in the INT images from a nearby bright star partly covers source G, likely blocking our view of the optical counterpart. The high surface brightness of G indicates the source is probably associated with an AGN.
4 Discussion
4.1 Origin of the double radio relic
Hydrodynamical simulations of cluster mergers show that the process takes of the order of yr (e.g., Vazza et al. 2010; Paul et al. 2010; Battaglia et al. 2009; Skillman et al. 2008; Hoeft et al. 2008; Pfrommer et al. 2008; Ricker & Sarazin 2001). During a cluster merger, “internal” shock waves are generated. Typically, these have lower Mach numbers () than “external” shock waves which are generated by the infall of unprocessed gas from the surrounding IGM and having . The Mach numbers of internal shocks are low because the sound speed in the gas of the main (bigger) cluster and the velocity of the in-falling subcluster both reflect the same gravitational potential of the main cluster. Merger events which generate shock waves with are rare, and these are mainly formed in major merger events, with the mass ratio of the two merging clusters approaching unity. In the case of a binary cluster, merger two shocks are produced along the merger axis. As the shock waves propagate outward into a lower density environment their Mach number increases. The shock structure may get broken when it interacts with the galaxy filaments connected to the cluster. This may explain the presence of the “notch-like” feature observed in the north of relic RE (Paul et al. 2010). These notch-like structures are also observed for the double relics in Abell 3376 (Bagchi et al. 2006) and Abell 3667 (Röttgering et al. 1997).
At the location of the shock front particles are proposed (Ensslin et al. 1998) to be (re)accelerated by the DSA mechanism. In this case, the injection spectral index of the radio emission is related to the Mach number of the shock. Behind the shock front particles cool through IC and synchrotron losses. The spectral index should thus steepen inwards to the cluster center. The overall integrated spectral is still a power-law though, but steeper by about 0.5 unit (e.g., Blandford & Eichler 1987; Sarazin 1999, 2002) than the injection spectral index. Relics which such power-law spectra have been found for example in Abell 521 and the Coma cluster (Giacintucci et al. 2008; Giovannini et al. 1991).
We have fitted a power-law radio spectrum for the integrated fluxes of the radio relic reported in Table 3. The fitted radio spectra for the two relics are displayed in Fig. 15. RE is well fitted by a single power-law spectrum with a spectral index of . For the western relic we find a spectral index of . We note that the 241 MHz flux measurement and the corresponding error are somewhat difficult to estimate as the noise in the image increases sharply towards bright radio source E because of residual calibration errors, see also Fig. 6.
As reported in Sect. 3.4, the spectral indices at the front of the relics are about and for RE and RW, respectively. The errors give the variation in spectral index across the outer edges of the relic. The integrated spectral indices are consistent with this values (if we assume that DSA takes place), being steeper by about 0.5 units. We take the values at the front of the relic as the injection spectral indices. This then gives Mach numbers of and for relics RE and RW, respectively (van Weeren et al. 2009a). The uncertainties in the Mach number are based on the variation in spectral index at the front of the relics of about units. These Mach number are in agreement with those found in other merging clusters, typically being between 1.5 and 3 (Markevitch et al. 2002, 2005; Markevitch 2006; Russell et al. 2010; Finoguenov et al. 2010).
Compression of fossil radio plasma (Enßlin & Gopal-Krishna 2001) does not seem to be a likely scenario to explain the relics in ZwCl 0008.8+5215, because regions with a spectral index of are seen in front of the relic, not very steep for a radio phoenix. The integrated radio spectra do also not reveal significant spectral curvature (see for example Slee et al. 2001). Furthermore, relic RE has a size of 1.4 Mpc and the time to compress such a large radio ghost would have removed most of the energetic particles responsible for the radio emission (Clarke & Ensslin 2006). Relic RW is located not far from the complex sources E and F. If RW is directly associated with E and F, one would not expect the spectral index to steepen across RW in the direction of E and F. Also, the overall polarization fraction of RW is considerably higher than that of sources E and F. Therefore, our preferred scenario is that of relics tracing shock fronts where particles are accelerated or re-accelerated by the DSA mechanism.
The large difference of a factor of five in linear extent for relic RE and RW, is unlike that of previously known double relics. This large ratio in linear size could be explained by a relatively large mass ratio between the merging clusters, as the size of the shock waves formed during a binary cluster merger event roughly scale with the radii/masses of the merging components. The galaxy iso-density contours in Fig. 2 show two subclusters, with the eastern subcluster being slightly larger. Another possibility is that the shock front on the west side of the cluster is partly broken up due to the presence of substructures or galaxy filaments. In case of re-acceleration, a supply of fossil electrons is needed. Therefore, a third possibility is that if these electrons have a limited spatial distribution, the shock front might be illuminated only locally.
The overall configuration of the relics is largely symmetric around the east-west merger axis, indicating that the impact parameter for the merger is close to zero (Ricker & Sarazin 2001).
4.2 Radio luminosity profile for the eastern relic


The width of a relic (), tracing a plane shock wave, to first order reflects the downstream velocity of the shock , a characteristic timescale due to spectral ageing , and the angle between the shock front normal and the plane of the sky
| (2) |
The characteristic timescale due to spectral ageing is given by
| (3) |
with the magnetic field at the shock front in Gauss, the equivalent magnetic field strength of the CMB in Gauss, and the observed frequency in MHz. At , is Gauss. If and are known this gives a method for determining the magnetic field strength. Even if is not known, limits on the magnetic field can be obtained if the observed width () is smaller than the maximum width allowed from Eq. 2.
To get an estimate of , we use a temperature in the post-shock region of 6 keV, i.e, about twice the average cluster temperature. This factor of two increase is roughly what has been observed in other clusters with shocks (e.g., Russell et al. 2010; Ma et al. 2009). We use Rankine-Hugoniot jump conditions (Landau & Lifshitz 1959), with an adiabatic index , and take the Mach number from the injection spectral index. This gives
| (4) |
with indices 1 and 2 referring to the pre-shock and post-shock regions. The downstream speed is given by , with the pre-shock sound speed, , with the mean molecular weight. The compression ratio is given by
| (5) |
Filling in the numbers gives and km s-1. We then obtain km s-1. The downstream velocity depends only weakly on the adopted downstream temperature. For example, using a downstream temperature of 10 keV increases of to about km s-1. For the remainder we will adopt km s-1. This then gives for the width of the relic (FWHM) observed at 1382 MHz
| (6) |
with the magnetic field strengths in units of Gauss.
For , the maximum width is 46 kpc, which corresponds to Gauss. This is smaller than the observed width of about 150 kpc (see Fig. 16) and hence no constraints on the magnetic field can be put since the angle is not known. It is possible to set limits on using the observed polarization fraction (Ensslin et al. 1998). A 20% polarization fraction implies . This limit on is not consistent with the observed width which would require . Although, for large sections of the relic the polarization fraction is unknown and could be smaller than 20%.
4.3 Simulated radio luminosity and spectral index profiles
In the above analysis we assumed that a relic traces a planar shock wave. In a more realistic model of a relic would trace a shock wave that forms a part of a sphere. This is illustrated by the curved shape of relic RE. The observed width is about a factor of three larger than the maximum intrinsic allowed width, . This implies that projection effects probably play an important role. The questions is then why do we still see a clear spectral index gradient (Fig. 16) across the relic?
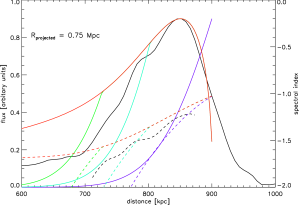
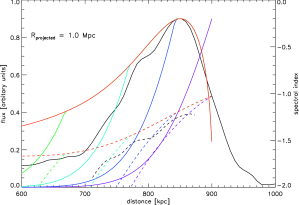
To answer this questions we use a more realistic model of a shock front. The spherical shock subtends an angle into the plane of the sky and has a radius of curvature . The total angle subtended by the relic is . We compute the radio luminosity profiles at the observed frequencies of 241 and 1382 MHz. The injection spectral index is taken to be . Synchrotron cooling processes, based on the distance of the emitting radio plasma from the front of the shock, which in turn depend on the downstream velocity km s-1, are taken into account. For the magnetic field we assume Gauss, which maximizes the intrinsic width of the relic to 46 kpc. A spectral index profile is computed using the profiles at the two different frequencies. The resulting intrinsic luminosity profiles (with intrinsic referring to a planar shock wave without any projection effects) and profiles for and 1.0 Mpc, with opening angles are shown in Figs. 17 and 18. For Mpc, we find that the profile with an opening angle between 30 and 22°() provides the best match to the observed profile. For Mpc, we find the best match for .
Our computed luminosity profiles do no provide a very good match to the observed profile at distances of more than 0.85 Mpc from the cluster center. The observed profile is more symmetric, while the computed profiles are rather asymmetric with a strong luminosity decrease at large radii. This may be caused by the fact that the actual 3D shape of the shock front differs somewhat from a sphere. Also, we assumed a uniform surface brightness over the front of the shock surface (which forms part of a segment of a sphere). At the edges of this surface the radio emission drops to zero abruptly. This causes the discontinuities in the modeled profiles inwards of the peak luminosity towards the cluster center. In the GMRT and WSRT images, the relic’s surface brightness fades towards the northern and southern ends. This could (partly) be explained by the spherical shell model we use for the relic, as the relic’s extent into the plane of the sky decreases at the northern and southern ends. It is also possible that the surface brightness across the shell decreases towards the edges. This effect is not included in our model. However, our goal was not to reproduce the exact profile of the relic, but rather to show that although projection effects can be significant, a clear spectral index gradient can remain. Even for an opening angle of 40°(a total of 80° into and out of the plane of the sky), a steepening of more than 0.5 units in the spectral index is predicted towards the cluster center.
Based on this we argue that although relic RE is widened significantly by projection effects, the fact the we see a clear spectral index gradient is not surprising. This could also explain the spectral index gradients visible for the relics observed by Röttgering et al. (1997); Clarke & Ensslin (2006); Orrú et al. (2007); Giacintucci et al. (2008); Bonafede et al. (2009), even though the observed widths are significantly larger than the maximum intrinsic widths.
4.4 Equipartition magnetic field strength
Since the width of the relic is larger than the maximum intrinsic width, we estimate the magnetic field at the location of the relics by assuming minimum energy densities in the relics. We use the same procedure as described in van Weeren et al. (2009a) and take , i.e, the ratio of energy in relativistic protons to that in electrons. For relic RW, we have a spectral index of -, and a surface brightness of Jy arcsec-2. We take 290 kpc for the depth () along the line of sight. This gives Gauss. For RE we have a spectral index of -, a surface brightness of Jy arcsec-2, and we assume Mpc. This gives Gauss. The equipartition magnetic field strength scales with . In the above calculation, we used fixed frequency cutoffs ( MHz and GHz), which is not entirely correct (Beck & Krause 2005; Brunetti et al. 1997). With low and high energy cutoffs (, ), , and fixing to 100, we find a revised magnetic field strength () of 7.9 and 6.6 Gauss for RW and RE, respectively. For a lower cutoff of , we get 1.4 and 1.0 Gauss for RW and RE, respectively. The revised equipartition magnetic field strength () scales with , for different values of .
5 Conclusions
We discovered a double radio relic in the galaxy cluster ZwCl 0008.8+5215, located at (based on a single spectroscopic redshift). A ROSAT X-ray image and galaxy iso-density map show that the cluster is undergoing a binary merger event, with the merger axis oriented roughly east-west. The two radio relics are located along this merger axis, while their orientation is perpendicular to this axis. The relics probably trace shocks waves in the ICM, created by the merger event, in which particles are (re)accelerated by the DSA mechanism. Integrated radio spectra are consistent with particle acceleration in the shock by DSA and indicate Mach numbers of for the shocks. The spectral index for both relics shows a steepening towards the cluster center. Parts of the relics have a polarization fraction in the range of , but further observations are needed to better map the polarization properties. The relics have an extent of 1.4 Mpc and 290 kpc. This factor of five difference in their linear extent is unlike that of other known double relic systems. The size difference could be related to a relatively large mass ratio between the two merging clusters, although galaxy iso-density contours do not indicate a large difference in masses between the two subclusters. Alternatively, the second shock front is partly broken up due to interaction with substructures, or the small size of the western relic reflects the limited spatial distribution of fossil electrons.
We modeled the radio luminosity and spectral index profiles of the eastern relic, assuming that the relic traces a curved shock front. We conclude that projection effects play an important role in increasing the observed s width of the relic. However, we find that a clear spectral index gradient remains visible for large opening angles.
Future X-ray observations will be needed to investigate the dynamical state of the cluster, determine the mass ratio of the merging systems, and search for shock waves associated with the relics.
Acknowledgements.
We would like to thank the anonymous referee for useful comments. We thank the staff of the GMRT who have made these observations possible. The GMRT is run by the National Centre for Radio Astrophysics of the Tata Institute of Fundamental Research. The Westerbork Synthesis Radio Telescope is operated by ASTRON (Netherlands Institute for Radio Astronomy) with support from the Netherlands Foundation for Scientific Research (NWO). The National Radio Astronomy Observatory is a facility of the National Science Foundation operated under cooperative agreement by Associated Universities, Inc. The Isaac Newton Telescope and William Herschel Telescope are operated on the island of La Palma by the Isaac Newton Group in the Spanish Observatorio del Roque de los Muchachos of the Instituto de Astrofísica de Canarias. This publication makes use of data products from the Two Micron All Sky Survey, which is a joint project of the University of Massachusetts and the Infrared Processing and Analysis Center/California Institute of Technology, funded by the National Aeronautics and Space Administration and the National Science Foundation. This research has made use of the VizieR catalogue access tool, CDS, Strasbourg, France. RJvW acknowledges funding from the Royal Netherlands Academy of Arts and Sciences. MB acknowledges support by the research group FOR 1254 funded by the Deutsche ForschungsgemeinschaftReferences
- Athreya (2009) Athreya, R. 2009, ApJ, 696, 885
- Axford et al. (1977) Axford, W. I., Leer, E., & Skadron, G. 1977, in International Cosmic Ray Conference, Vol. 11, International Cosmic Ray Conference, 132–+
- Baars et al. (1977) Baars, J. W. M., Genzel, R., Pauliny-Toth, I. I. K., & Witzel, A. 1977, A&A, 61, 99
- Bagchi et al. (2006) Bagchi, J., Durret, F., Neto, G. B. L., & Paul, S. 2006, Science, 314, 791
- Battaglia et al. (2009) Battaglia, N., Pfrommer, C., Sievers, J. L., Bond, J. R., & Enßlin, T. A. 2009, MNRAS, 393, 1073
- Baum et al. (1995) Baum, S. A., Zirbel, E. L., & O’Dea, C. P. 1995, ApJ, 451, 88
- Beck & Krause (2005) Beck, R. & Krause, M. 2005, Astronomische Nachrichten, 326, 414
- Bell (1978a) Bell, A. R. 1978a, MNRAS, 182, 147
- Bell (1978b) Bell, A. R. 1978b, MNRAS, 182, 443
- Bertin & Arnouts (1996) Bertin, E. & Arnouts, S. 1996, A&AS, 117, 393
- Blandford & Eichler (1987) Blandford, R. & Eichler, D. 1987, Phys. Rep, 154, 1
- Blandford & Ostriker (1978) Blandford, R. D. & Ostriker, J. P. 1978, ApJ, 221, L29
- Bonafede et al. (2009) Bonafede, A., Giovannini, G., Feretti, L., Govoni, F., & Murgia, M. 2009, A&A, 494, 429
- Brentjens (2008) Brentjens, M. A. 2008, A&A, 489, 69
- Briggs (1995) Briggs, D. S. 1995, PhD thesis, New Mexico Institute of Mining Technology, Socorro, New Mexico, USA
- Brown et al. (2010) Brown, S., Duesterhoeft, J., & Rudnick, L. 2010, ArXiv e-prints
- Brunetti et al. (1997) Brunetti, G., Setti, G., & Comastri, A. 1997, A&A, 325, 898
- Chandra et al. (2004) Chandra, P., Ray, A., & Bhatnagar, S. 2004, ApJ, 612, 974
- Clarke & Ensslin (2006) Clarke, T. E. & Ensslin, T. A. 2006, AJ, 131, 2900
- Cohen et al. (2007) Cohen, A. S., Lane, W. M., Cotton, W. D., et al. 2007, AJ, 134, 1245
- Condon et al. (1998) Condon, J. J., Cotton, W. D., Greisen, E. W., et al. 1998, AJ, 115, 1693
- Cornwell & Perley (1992) Cornwell, T. J. & Perley, R. A. 1992, A&A, 261, 353
- Cotton (2008) Cotton, W. D. 2008, PASP, 120, 439
- de Vries et al. (2007) de Vries, N., Snellen, I. A. G., Schilizzi, R. T., Lehnert, M. D., & Bremer, M. N. 2007, A&A, 464, 879
- Drury (1983) Drury, L. O. 1983, Reports on Progress in Physics, 46, 973
- Ensslin et al. (1998) Ensslin, T. A., Biermann, P. L., Klein, U., & Kohle, S. 1998, A&A, 332, 395
- Enßlin & Brüggen (2002) Enßlin, T. A. & Brüggen, M. 2002, MNRAS, 331, 1011
- Enßlin & Gopal-Krishna (2001) Enßlin, T. A. & Gopal-Krishna. 2001, A&A, 366, 26
- Fanaroff & Riley (1974) Fanaroff, B. L. & Riley, J. M. 1974, MNRAS, 167, 31P
- Finoguenov et al. (2010) Finoguenov, A., Sarazin, C. L., Nakazawa, K., Wik, D. R., & Clarke, T. E. 2010, ArXiv e-prints
- Giacintucci et al. (2008) Giacintucci, S., Venturi, T., Macario, G., et al. 2008, A&A, 486, 347
- Giovannini et al. (1991) Giovannini, G., Feretti, L., & Stanghellini, C. 1991, A&A, 252, 528
- Giovannini et al. (1999) Giovannini, G., Tordi, M., & Feretti, L. 1999, New Astronomy, 4, 141
- Hoeft & Brüggen (2007) Hoeft, M. & Brüggen, M. 2007, MNRAS, 375, 77
- Hoeft et al. (2008) Hoeft, M., Brüggen, M., Yepes, G., Gottlöber, S., & Schwope, A. 2008, MNRAS, 391, 1511
- Jones & Ellison (1991) Jones, F. C. & Ellison, D. C. 1991, Space Science Reviews, 58, 259
- Kempner et al. (2004) Kempner, J. C., Blanton, E. L., Clarke, T. E., et al. 2004, in The Riddle of Cooling Flows in Galaxies and Clusters of galaxies, ed. T. Reiprich, J. Kempner, & N. Soker, 335–+
- Kempner & Sarazin (2001) Kempner, J. C. & Sarazin, C. L. 2001, ApJ, 548, 639
- Keshet (2010) Keshet, U. 2010, ArXiv e-prints
- Krymskii (1977) Krymskii, G. F. 1977, Akademiia Nauk SSSR Doklady, 234, 1306
- Landau & Lifshitz (1959) Landau, L. D. & Lifshitz, E. M. 1959, Fluid mechanics, ed. Landau, L. D. & Lifshitz, E. M.
- Ma et al. (2009) Ma, C., Ebeling, H., & Barrett, E. 2009, ApJ, 693, L56
- Malkov & O’C Drury (2001) Malkov, M. A. & O’C Drury, L. 2001, Reports on Progress in Physics, 64, 429
- Markevitch (2006) Markevitch, M. 2006, in ESA Special Publication, Vol. 604, The X-ray Universe 2005, ed. A. Wilson, 723–+
- Markevitch et al. (2002) Markevitch, M., Gonzalez, A. H., David, L., et al. 2002, ApJ, 567, L27
- Markevitch et al. (2005) Markevitch, M., Govoni, F., Brunetti, G., & Jerius, D. 2005, ApJ, 627, 733
- Miniati et al. (2001) Miniati, F., Jones, T. W., Kang, H., & Ryu, D. 2001, ApJ, 562, 233
- Noordam (2004) Noordam, J. E. 2004, in Society of Photo-Optical Instrumentation Engineers (SPIE) Conference Series, Vol. 5489, Society of Photo-Optical Instrumentation Engineers (SPIE) Conference Series, ed. J. M. Oschmann, Jr., 817–825
- Orrú et al. (2007) Orrú, E., Murgia, M., Feretti, L., et al. 2007, A&A, 467, 943
- Owen & Ledlow (1994) Owen, F. N. & Ledlow, M. J. 1994, in Astronomical Society of the Pacific Conference Series, Vol. 54, The Physics of Active Galaxies, ed. G. V. Bicknell, M. A. Dopita, & P. J. Quinn, 319–+
- Owen & White (1991) Owen, F. N. & White, R. A. 1991, MNRAS, 249, 164
- Paul et al. (2010) Paul, S., Iapichino, L., Miniati, F., Bagchi, J., & Mannheim, K. 2010, ArXiv e-prints
- Perley (1989) Perley, R. A. 1989, in Astronomical Society of the Pacific Conference Series, Vol. 6, Synthesis Imaging in Radio Astronomy, ed. R. A. Perley, F. R. Schwab, & A. H. Bridle, 259–+
- Perley & Taylor (1999) Perley, R. T. & Taylor, G. B. 1999, VLA Calibrator Manual, Tech. rep., NRAO
- Pfrommer (2008) Pfrommer, C. 2008, MNRAS, 385, 1242
- Pfrommer et al. (2008) Pfrommer, C., Enßlin, T. A., & Springel, V. 2008, MNRAS, 385, 1211
- Pizzo & de Bruyn (2009) Pizzo, R. F. & de Bruyn, A. G. 2009, A&A, 507, 639
- Pratt et al. (2009) Pratt, G. W., Croston, J. H., Arnaud, M., & Böhringer, H. 2009, A&A, 498, 361
- Rengelink et al. (1997) Rengelink, R. B., Tang, Y., de Bruyn, A. G., et al. 1997, A&AS, 124, 259
- Ricker & Sarazin (2001) Ricker, P. M. & Sarazin, C. L. 2001, ApJ, 561, 621
- Roettiger et al. (1999) Roettiger, K., Burns, J. O., & Stone, J. M. 1999, ApJ, 518, 603
- Röttgering et al. (1997) Röttgering, H. J. A., Wieringa, M. H., Hunstead, R. W., & Ekers, R. D. 1997, MNRAS, 290, 577
- Roy et al. (2009) Roy, J., Gupta, Y., Pen, U., et al. 2009, ArXiv e-prints
- Rudnick & Lemmerman (2009) Rudnick, L. & Lemmerman, J. A. 2009, ApJ, 697, 1341
- Russell et al. (2010) Russell, H. R., Sanders, J. S., Fabian, A. C., et al. 2010, ArXiv e-prints
- Sarazin (1999) Sarazin, C. L. 1999, ApJ, 520, 529
- Sarazin (2002) Sarazin, C. L. 2002, in Astrophysics and Space Science Library, Vol. 272, Merging Processes in Galaxy Clusters, ed. L. Feretti, I. M. Gioia, & G. Giovannini, 1–38
- Schlegel et al. (1998) Schlegel, D. J., Finkbeiner, D. P., & Davis, M. 1998, ApJ, 500, 525
- Skillman et al. (2008) Skillman, S. W., O’Shea, B. W., Hallman, E. J., Burns, J. O., & Norman, M. L. 2008, ApJ, 689, 1063
- Skrutskie et al. (2003) Skrutskie, M. F., Cutri, R. M., Stiening, R., et al. 2003, VizieR Online Data Catalog, 7233, 0
- Slee et al. (2001) Slee, O. B., Roy, A. L., Murgia, M., Andernach, H., & Ehle, M. 2001, AJ, 122, 1172
- Tody (1986) Tody, D. 1986, in Presented at the Society of Photo-Optical Instrumentation Engineers (SPIE) Conference, Vol. 627, Society of Photo-Optical Instrumentation Engineers (SPIE) Conference Series, ed. D. L. Crawford, 733–+
- Tody (1993) Tody, D. 1993, in Astronomical Society of the Pacific Conference Series, Vol. 52, Astronomical Data Analysis Software and Systems II, ed. R. J. Hanisch, R. J. V. Brissenden, & J. Barnes, 173–+
- Valdes (1998) Valdes, F. G. 1998, in Astronomical Society of the Pacific Conference Series, Vol. 145, Astronomical Data Analysis Software and Systems VII, ed. R. Albrecht, R. N. Hook, & H. A. Bushouse, 53–+
- van Weeren et al. (2009a) van Weeren, R. J., Röttgering, H. J. A., Bagchi, J., et al. 2009a, A&A, 506, 1083
- van Weeren et al. (2009b) van Weeren, R. J., Röttgering, H. J. A., Brüggen, M., & Cohen, A. 2009b, A&A, 508, 75
- van Weeren et al. (2009c) van Weeren, R. J., Röttgering, H. J. A., Brüggen, M., & Cohen, A. 2009c, A&A, 505, 991
- van Weeren et al. (2010) van Weeren, R. J., Röttgering, H. J. A., Brüggen, M., & Hoeft, M. 2010, Science, 330, 347
- Vazza et al. (2010) Vazza, F., Brunetti, G., Gheller, C., & Brunino, R. 2010, ArXiv e-prints
- Venturi et al. (2007) Venturi, T., Giacintucci, S., Brunetti, G., et al. 2007, A&A, 463, 937
- Voges et al. (1999) Voges, W., Aschenbach, B., Boller, T., et al. 1999, A&A, 349, 389
- Wardle & Kronberg (1974) Wardle, J. F. C. & Kronberg, P. P. 1974, ApJ, 194, 249
- Willott et al. (2003) Willott, C. J., Rawlings, S., Jarvis, M. J., & Blundell, K. M. 2003, MNRAS, 339, 173