South Pole Telescope Detections of The Previously Unconfirmed PLANCK Early SZ Clusters in the Southern Hemisphere
Abstract
We present South Pole Telescope (SPT) observations of the five galaxy cluster candidates in the southern hemisphere which were reported as unconfirmed in the Planck Early Sunyaev-Zel’dovich (ESZ) sample. One cluster candidate, PLCKESZ G255.62-46.16, is located in the 2500 deg2 SPT SZ survey region and was reported previously as SPT-CL J0411-4819. For the remaining four candidates, which are located outside of the SPT SZ survey region, we performed short, dedicated SPT observations. Each of these four candidates was strongly detected in maps made from these observations, with signal-to-noise ratios ranging from 6.3 to 13.8. We have observed these four candidates on the Magellan-Baade telescope and used these data to estimate cluster redshifts from the red sequence. Resulting redshifts range from 0.24 to 0.46. We report measurements of , the integrated Comptonization within a radius, for all five candidates. We also report X-ray luminosities calculated from ROSAT All-Sky Survey catalog counts, as well as optical and improved SZ coordinates for each candidate. The combination of SPT SZ measurements, optical red-sequence measurements, and X-ray luminosity estimates demonstrates that these five Planck ESZ cluster candidates do indeed correspond to real galaxy clusters with redshifts and observable properties consistent with the rest of the ESZ sample.
Subject headings:
galaxies: clusters: individual — cosmology: observations1. Introduction
In recent years, a number of new experiments have successfully discovered and characterized galaxy clusters using the thermal Sunyaev-Zel’dovich (SZ) effect (Sunyaev & Zel’dovich, 1972; Birkinshaw, 1999; Carlstrom et al., 2002). The thermal SZ effect is a spectral distortion in the Cosmic Microwave Background (CMB) caused by photons inverse-Compton scattering off electrons in the hot, ionized intra-cluster medium. The SZ surface brightness is largely independent of redshift which implies that SZ surveys with sufficient angular resolution can deliver nearly mass-limited cluster samples.
Deep SZ surveys covering over 1000 square degrees at arcminute resolution are being carried out by the South Pole Telescope (SPT; Carlstrom et al., 2011) and the Atacama Cosmology Telescope (ACT; Fowler et al., 2007), and have already provided cosmologically interesting SZ-selected cluster catalogs (Vanderlinde et al. 2010, hereafter V10; Marriage et al. 2011; Williamson et al. 2011, hereafter W11). The Planck collaboration has recently released an all-sky SZ-selected cluster catalog (Planck Collaboration, 2011a, hereafter Planck11). The all-sky coverage of the Planck survey makes it highly complementary to the deep, higher-resolution surveys.
In compiling their Early SZ (ESZ) catalog, the Planck collaboration has ensured high purity through a detection significance cut of signal-to-noise ratio (S/N) 6, additional internal validation procedures, and follow-up observations of a subset of their candidates (Planck Collaboration, 2011b). The ESZ catalog consists of 189 SZ-selected galaxy clusters, 20 of which are new detections. Of these 20 new detections, eight were reported as unconfirmed candidates in the ESZ catalog.
Five of these unconfirmed candidates are located in the southern hemisphere and are thus observable with the SPT. One cluster, PLCKESZ G255.62-46.16, lies in the SPT SZ survey region and was reported in W11 as SPT-CL J0411-4819. The remaining four cluster candidates lie outside the SPT SZ survey region and required dedicated observations. By observing small patches of sky centered on the positions reported in Planck11, we have detected all four remaining candidates with S/N ranging from 6.3 to 13.8. Optical observations of these four clusters were taken with the Magellan-Baade telescope in Chile to obtain red-sequence redshifts, and X-ray luminosities were calculated from ROSAT All-Sky Survey (RASS) catalog counts. In addition to confirming all five cluster candidates, we report measurements of , the integrated Comptonization within a radius, red-sequence redshifts, and optical and improved SZ coordinates for the clusters.
2. SZ Observations and Data Processing
2.1. SZ Observations
The 10-meter SPT is a millimeter/submillimeter telescope located at the NSF Amundsen-Scott South Pole Station and is optimized for observations of the CMB. The SPT currently has a 960-pixel, three-band (95, 150, and 220 GHz) camera. With the one-arcminute resolution and high instantaneous sensitivity of the SPT, any cluster at which was detected significantly by the Planck telescope is expected to result in a strong SPT detection after a few hours of integration. Between January 15 and 26, 2011, we used the SPT to perform pointed observations of the four Planck ESZ cluster candidates in the southern hemisphere that were not already in the SPT SZ survey region. These observations were similar to those described in Plagge et al. (2010) and involved mapping a small ( 4 deg2), square patch of sky centered on each candidate.
These patches of sky were observed with a standard SPT observing strategy in which the telescope scans a patch back and forth in azimuth, followed by a small step in elevation, repeating until the patch is covered. Each patch was re-observed until a significant detection (or a high-significance non-detection) of the cluster candidate could be made. The clusters discovered by Planck have typical redshifts of and masses of (cf. Fig. 18 and 19 of Planck11). Such a cluster will result in a SPT detection at the full SPT survey depth of K-arcmin (CMB temperature units) at 150 GHz (cf. W11), and this depth was our rough goal for non-detections. In fact, all four cluster candidates were detected long before this depth was reached, with a total of four to ten hours of observing time on each patch. The patches containing PLCKESZ G225.92-19.99, PLCKESZ G264.41+19.48, PLCKESZ G283.16-22.93, and PLCKESZ G304.84-41.42 were observed to field depths of 39, 29, 35, and K-arcmin at 150 GHz, respectively.
2.2. Data Processing
The data are processed through a pipeline similar to that used in W11, which we briefly describe here. The time-ordered data (TOD) are calibrated to CMB temperature units based on observations of a galactic HII region (RCW38), as in Staniszewski et al. (2009, hereafter S09) (calibration uncertainties add a systematic uncertainty of to measurements of ). The TOD are then bandpass-filtered, and correlated noise between detectors is removed. We implement a high-pass filter by removing a fifth order Legendre polynomial and a set of Fourier modes. We remove correlated atmospheric noise by subtracting the mean and slope of the TOD across all detectors on each of the six geometrically compact detector wedges.
The pointing for each detector is reconstructed, and the calibrated, filtered TOD are binned into square pixels on a Sanson-Flamsteed flat sky projection. The astrometry of each map is corrected by matching bright point sources which appear both in our maps and in the AT20G (Murphy et al., 2010) and SUMSS (Mauch et al., 2003) catalogs.
2.3. Detecting Clusters
We search for clusters in our maps by applying the same cluster extraction procedure as was used on the full SPT SZ survey fields in W11. In this search, we do not apply any priors to the cluster positions based on the Planck candidate positions. Our cluster extraction procedure is based on the application of a simultaneous spatial-spectral matched filter (Melin et al., 2006). We briefly describe our inputs to this procedure here and direct the reader to W11 for full details.
Because we can predict the spectral signature of the thermal SZ effect (for a cluster of a given temperature) and the expected spatial profiles of clusters, we can combine maps from our three bands to maximize sensitivity to cluster signals and minimize noise and astrophysical contaminants. We use an estimate of the thermal SZ spectrum in each of our three observing bands that includes a relativistic correction appropriate for an 8 keV cluster (Nozawa et al., 2000) and uses an SZ-weighted band center.111The value of we would derive had we used the spectrum for a 4 keV or 10 keV cluster would differ by approximately from the 8 keV value.
We estimate the noise component of the matched filters independently in each frequency band in each of the four targeted observations, using the jackknife procedure described in S09. Because these noise levels vary significantly from patch to patch, independent matched filters were constructed for each of the four targeted patches.
We model the astrophysical components of the matched filters as a combination of primary and lensed CMB fluctuations, point sources below the SPT detection threshold (bright sources are masked prior to filtering), and thermal SZ flux from clusters below the SPT detection threshold. The power-spectrum shapes and amplitudes for these components are identical to those used in W11.
As in W11, the source template in the matched filters is described by a cored power-law SZ profile, , where the normalization and the core radius are free parameters. Twelve different matched filters were constructed and applied to each patch, each with a different core radius, spaced evenly between and . We report the maximum S/N across all filter scales for each cluster.
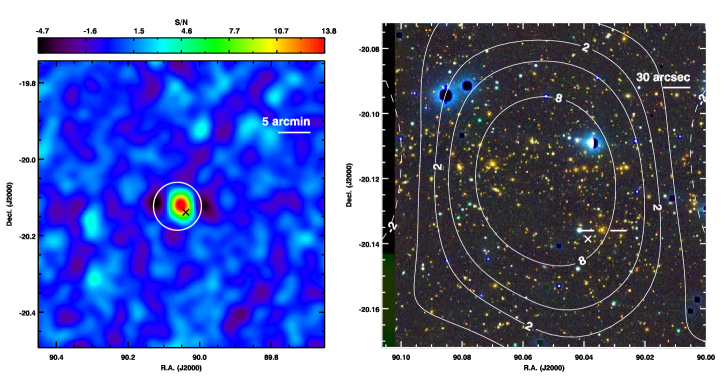
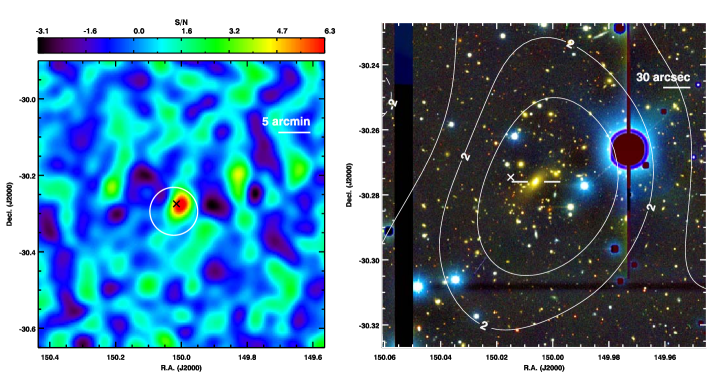
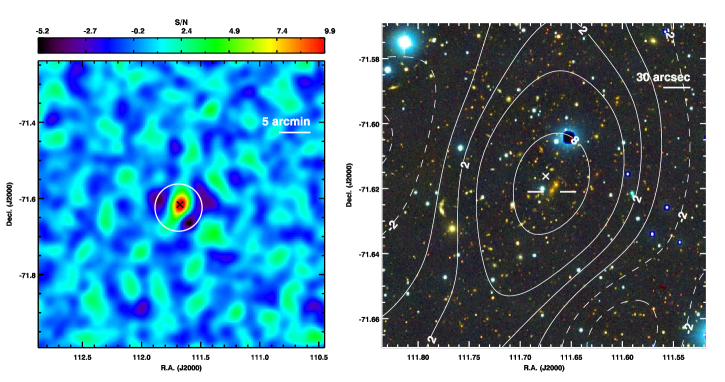
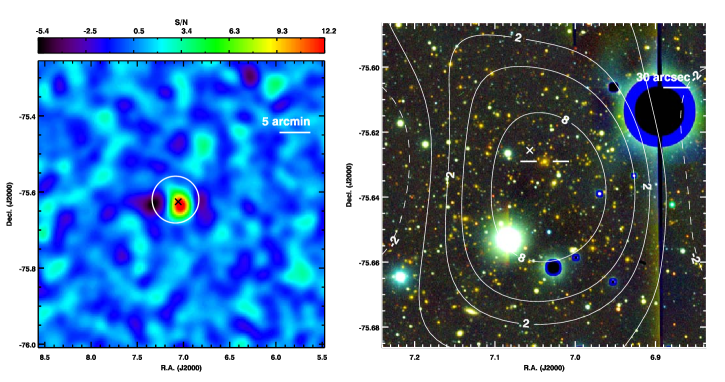
The detections of PLCKESZ G225.92-19.99, PLCKESZ G264.41+19.48, PLCKESZ G283.16-22.93, and PLCKESZ G304.84-41.42 have S/N of 13.8, 6.3, 9.9, and 12.2, respectively. Note that due to the highly variable map depths, these S/N measurements should not be used as a proxy for SZ flux (nor mass). PLCKESZ G255.62-46.16 was previously detected with S/N of 14.8 in the full SPT SZ survey using this same method.
3. Robustness of SZ Confirmations
Here we describe tests demonstrating that the SPT confirmations of Planck ESZ clusters are robust. We focus on the least significant detection in the SPT maps (PLCKESZ G264.41+19.48); limits on the likelihood of spurious confirmation are more stringent for the other clusters.
Estimating the exact probability of a spurious SPT confirmation of a Planck cluster is complicated by our limited knowledge of the complex Planck selection function. Without an accurate estimate of the Planck spatial-spectral filter it is impossible to accurately estimate the degree of correlation between the astrophysical contaminants in the synthesized SZ maps used in the Planck cluster search and the corresponding SPT maps. As the frequency coverage and angular resolution of Planck and SPT are substantially different, we proceed under the assumption of uncorrelated astrophysical contaminants.
We simulate 4000 deg2 of microwave sky consisting of the primary CMB and point sources. We make simulated sky maps in each SPT observing band by convolving the sky signal with the SPT beams, applying any spatial filters that are applied to the real data (see Section 2.2), and adding a noise realization based on the noise estimate from the SPT maps of the PLCKESZ G264.41+19.48 region. We then apply the same matched filters used to find clusters in the real SPT maps, and we record “detections” in any of the filtered maps. Zero false detections are found at S/N6.3 in the 4000 deg2. Extrapolating the measured false detection rate at lower significance to S/N=6.3 results in an expectation value of 0.04 in 4000 deg2. Since we require proximity to Planck candidates, the effective area is much smaller—only deg2. Neglecting the possibility of astrophysical confusion being correlated between the Planck and SPT observations, the chance of a false detection in any of the five confirmations is negligible at .
4. Measuring Cluster Properties
4.1. Cluster Position and Integrated Comptonization
We estimate the position and integrated Comptonization for each cluster with the Rapid Gridded Likelihood Evaluation (RGLE) method described in Montroy et al. (2011) (in preparation). Because the 220 GHz data adds little statistical significance, we use only 95 and 150 GHz maps.
In the RGLE, we define the likelihood of a set of parameters given our set of observed maps as
| (1) |
where is the Fourier transform of the map for frequency , is the frequency dependent Fourier transform of the cluster model for parameters set , and is the frequency dependent covariance matrix of the set of maps. We model clusters with a cored power-law SZ profile that is exponentially cut off for . contains four parameters: the cluster center , the core radius () and the central temperature decrement (taken at 150 GHz). The covariance matrix accounts for the same noise and astrophysical components used in the matched filter analysis.
For each cluster the likelihood of a particular is evaluated on a grid in the 4 dimensional parameter space (). The spacing between grid points is in , , and , and in . Cluster positions cover a patch centered on the matched filter position. is computed between and , while is computed between and 60.
Cluster positions are calculated by marginalizing the 4-dimensional likelihood over the other parameters. These positions lie within 018 (less than the pixel size) of the best-fit matched filter positions.
For each cluster we report , the integrated Comptonization of the cluster model within a fixed -radius aperture, marginalized over , , and cluster positions. We expect measurements of to be robust despite the well known degeneracy between and the central Compton parameter because the radius of integration () closely approximates the mean size of the 95 and 150 GHz SPT beams. Simulations of clusters with S/N in the range of those reported here confirm that is well constrained. The choice of cluster profiles does not add significant bias; by searching for simulated Arnaud profile clusters (Arnaud et al., 2009) in simulated maps using the cored power-law SZ profile matched filter, we find the recovered samples have a bias of less than 5%.
4.2. Redshifts
Cluster redshifts were obtained with imaging at optical/near-infrared wavelengths following the procedure outlined in detail by High et al. (2010), which we now summarize. We observed the four cluster candidates outside the SPT SZ survey region using the IMACS camera (Dressler et al., 2006) on the Magellan-Baade telescope at Las Campanas Observatory, Chile, on January 27, 2011. We operated in imaging mode at a focal ratio of . For each cluster, we exposed for seconds through each of the filters. We achieved seeing of – in the images of PLCKESZ G304.84-41.42, and seeing of – in the other three. Images were bias-subtracted, flat-fielded, defringed where appropriate, illumination-corrected, and astrometrically calibrated and deprojected. Objects were then detected and associated between passbands with a search radius. We applied the Stellar Locus Regression method of photometric calibration (High et al., 2009) to the resulting catalog, including color-term corrections. We then searched for overdensities of red cluster galaxies using standard red-sequence techniques. Redshifts were assigned using a red-sequence model that we calibrated using a set of clusters with spectroscopic redshifts, and the overall statistical plus systematic uncertainty is estimated to be –. W11 used the same procedure to obtain the redshift of PLCKESZ G255.62-46.16, but with imaging data from the Swope telescope at Las Campanas, Chile, in which we achieved seeing of –. The redshift of PLCKESZ G255.62-46.16 has an uncertainty of .
4.3. X-ray Luminosities
As noted in Planck11, each cluster has a nearby X-ray association from either the ROSAT All-Sky Survey Bright Source Catalog (Voges et al., 1999) or the ROSAT All-Sky Survey Faint Source Catalog222http://heasarc.gsfc.nasa.gov/W3Browse/rosat/rassfsc.html. To determine the flux and luminosity of each X-ray source, we used XSPEC333http://heasarc.nasa.gov/xanadu/xspec/xspec11/index.html to model the instrument response within Position Sensitive Proportional Counter channels 52-201. We assumed a cluster temperature of 8 keV and a metal abundance of 0.3 times solar, and adjusted the normalization of the XSPEC model to match the count rates reported in the Bright Source and Faint Source catalogs. Towards each cluster, we assume the galactic absorbing hydrogen column density measured by the Leiden-Argentine-Bonn survey (Kalberla et al., 2005). The XSPEC “lumin” function was applied to the normalized spectral model to calculate the luminosity in the cluster rest frame 0.5-2.0 keV energy band, which we have chosen because of its relative insensitivity to the assumed X-ray temperature. For example, when assuming a range of gas temperatures between 4 to 12 keV, the inferred X-ray luminosity changes by 8%, at a level negligible relative to the total uncertainty. Luminosity uncertainties are computed as the quadrature sum of the red sequence redshift uncertainties and the count rate uncertainties from RASS.
5. Results
| SPT | Optical | X-ray | |||||
|---|---|---|---|---|---|---|---|
| Object Name | R.A.aa Positions and uncertainties were calculated as described in Section 4.1. | Decl.aa Positions and uncertainties were calculated as described in Section 4.1. | bb is the integrated Comptonization within a radius, as described in section 4.1. Statistical errors are reported in this table to reflect the S/N. Calibration uncertainties add an additional systematic error of . | R.A.cc Optical coordinates are given for the BCG from each cluster. | Decl.cc Optical coordinates are given for the BCG from each cluster. | dd refers to red-sequence redshifts. Uncertainties are – for all clusters except SPT-CL J0411-4819, whose uncertainty is is | ee X-ray luminosities are reported in the rest frame 0.5-2.0 keV energy band. |
| [deg] | [deg] | [arcmin2] | [deg] | [deg] | [ergs/s] | ||
| PLCKESZ G225.92-19.99 | 90.052 0.002 | -20.119 0.002 | 4.02 0.29 | 90.0340 | -20.1358 | 0.46 | 5.2 1.4 |
| PLCKESZ G255.62-46.16$\dagger$$\dagger$ Cluster PLCKESZ G255.62-46.16 was previously reported as SPT-CL J0411-4819 in W11. | 62.814 0.002 | -48.319 0.002 | 1.89 0.13 | 62.7957 | -48.3276 | 0.42 | 6.0 1.8 |
| PLCKESZ G264.41+19.48 | 150.002 0.004 | -30.276 0.004 | 1.25 0.23 | 150.0062 | -30.2761 | 0.24 | 1.5 0.5 |
| PLCKESZ G283.16-22.93 | 111.672 0.005 | -71.619 0.003 | 2.19 0.20 | 111.6687 | -71.6207 | 0.45 | 2.9 0.9 |
| PLCKESZ G304.84-41.42 | 7.034 0.006 | -75.635 0.002 | 2.25 0.17 | 7.0379 | -75.6292 | 0.41 | 3.8 1.2 |
We detect a highly significant SZ signal at the expected location and spatial scale in each of the four observed patches. No other significant SZ signals were detected in these maps. As demonstrated in section 3, the chance of a false detection in any of these candidates is negligible. In addition to the SZ signal, we see clear optical counterparts for each candidate, and the calculated X-ray luminosities for the candidates are consistent with typical values for the Planck ESZ sample. From the combination of SZ detections, optical counterparts and consistent X-ray luminosities we conclude that the SPT confirmations (and the original Planck detections) of all five clusters are robust.
For each of the four newly confirmed clusters, we show S/N maps, filtered at the preferred scale, and optical images in Figures 1 to 4. From the optical image of PLCKESZ G225.92-19.99, it appears that this cluster has two distinct components whose red-sequence redshifts are consistent with one another, possibly indicating merger activity.
For all five clusters, we report SZ coordinates, integrated Comptonization , red-sequence redshifts, X-ray luminosities, and optical coordinates of the brightest galaxy in each cluster (BCG), in Table 1. The BCG is selected as the brightest galaxy whose color is consistent with the cluster red-sequence within of the SPT coordinate. Our measured SZ coordinates are consistent with the Planck coordinates to within the positional accuracy reported in Planck11. The distributions of and are consistent with those of the new Planck discoveries in the ESZ catalog which were confirmed by dedicated XMM-Newton observations (Planck Collaboration, 2011b) (cf. Fig. 18 and 21 of Planck11). From these measurements we find that these five clusters have observable properties which are consistent with the rest of the ESZ sample.
6. Conclusions
The recently released Planck ESZ sample contains five cluster candidates in the southern hemisphere which were reported as unconfirmed. Of these five, PLCKESZ G255.62-46.16 was previously reported as SPT-CL J0411-4819 in W11. The four remaining clusters were detected at high significance in short, dedicated observations with the SPT. From simulations we calculate that a false detection in follow-up observations is exceedingly unlikely for any of these clusters.
From SPT SZ data we report measurements of , the integrated Comptonization within a fixed -radius, for each cluster. We use optical/near-infrared images of each cluster, obtained using the Magellan-Baade telescope, to confirm the presence of overdensities of similarly colored galaxies at the position of the SZ signal and to estimate red-sequence redshifts. Using these redshifts and archival RASS X-ray data, we calculate the X-ray luminosity for each cluster and find that these luminosities are typical of other clusters in the Planck ESZ sample at these redshifts. We additionally report optical and improved SZ coordinates for each cluster.
The combination of SPT SZ measurements, optical red-sequence measurements, and X-ray luminosity estimates demonstrates that these five Planck ESZ cluster candidates do indeed correspond to real galaxy clusters with redshifts and observable properties consistent with the rest of the ESZ sample. These measurements are consistent with the expected high purity of the Planck ESZ sample and confirm all five previously unconfirmed clusters from the Planck ESZ sample which are observable with the SPT.
References
- Arnaud et al. (2009) Arnaud, M., Pratt, G. W., Piffaretti, R., Boehringer, H., Croston, J. H., & Pointecouteau, E. 2009, ArXiv e-prints, 0910.1234
- Birkinshaw (1999) Birkinshaw, M. 1999, Physics Reports, 310, 97
- Carlstrom et al. (2011) Carlstrom, J. E., et al. 2011, PASP, 123, 568
- Carlstrom et al. (2002) Carlstrom, J. E., Holder, G. P., & Reese, E. D. 2002, ARA&A, 40, 643
- Dressler et al. (2006) Dressler, A., Hare, T., Bigelow, B. C., & Osip, D. J. 2006, in Society of Photo-Optical Instrumentation Engineers (SPIE) Conference Series, Vol. 6269, Society of Photo-Optical Instrumentation Engineers (SPIE) Conference Series
- Fowler et al. (2007) Fowler, J. W., et al. 2007, Appl. Opt., 46, 3444
- High et al. (2010) High, F. W., et al. 2010, ApJ, 723, 1736
- High et al. (2009) High, F. W., Stubbs, C. W., Rest, A., Stalder, B., & Challis, P. 2009, AJ, 138, 110
- Kalberla et al. (2005) Kalberla, P., Burton, W., Hartmann, D., Arnal, E., Bajaja, E., Morras, R., & Pöppel, W. 2005, A&A, 440, 775
- Marriage et al. (2011) Marriage, T. A., et al. 2011, ApJ, 731, 100
- Mauch et al. (2003) Mauch, T., Murphy, T., Buttery, H. J., Curran, J., Hunstead, R. W., Piestrzynski, B., Robertson, J. G., & Sadler, E. M. 2003, MNRAS, 342, 1117
- Melin et al. (2006) Melin, J.-B., Bartlett, J. G., & Delabrouille, J. 2006, A&A, 459, 341
- Montroy et al. (2011) Montroy et al. 2011, In prep.
- Murphy et al. (2010) Murphy, T., et al. 2010, MNRAS, 402, 2403
- Nozawa et al. (2000) Nozawa, S., Itoh, N., Kawana, Y., & Kohyama, Y. 2000, ApJ, 536, 31
- Plagge et al. (2010) Plagge, T., et al. 2010, ApJ, 716, 1118
- Planck Collaboration (2011a) Planck Collaboration. 2011a, to appear in A&A, arXiv:1101.2024
- Planck Collaboration (2011b) ——. 2011b, to appear in A&A, arXiv:1101.2025
- Staniszewski et al. (2009) Staniszewski, Z., et al. 2009, ApJ, 701, 32
- Sunyaev & Zel’dovich (1972) Sunyaev, R. A., & Zel’dovich, Y. B. 1972, Comments on Astrophysics and Space Physics, 4, 173
- Vanderlinde et al. (2010) Vanderlinde, K., et al. 2010, ApJ, 722, 1180
- Voges et al. (1999) Voges, W., et al. 1999, A&A, 349, 389
- Williamson et al. (2011) Williamson, R., et al. 2011, ApJ, accepted, arXiv:1101.1290