Social Structure of Facebook Networks

Amanda L. Traud1,2, Peter J. Mucha1,3, and Mason A. Porter4,5
1Carolina Center for Interdisciplinary Applied Mathematics, Department of Mathematics,
University of North Carolina, Chapel Hill, NC 27599-3250, USA
2Carolina Population Center, University of North Carolina, Chapel Hill, NC 27516-2524, USA
3Institute for Advanced Materials, Nanoscience & Technology,
University of North Carolina, Chapel Hill, NC 27599-3216, USA
4Oxford Centre for Industrial and Applied Mathematics, Mathematical Institute,
University of Oxford, OX1 3LB, UK
5CABDyN Complexity Centre, University of Oxford, OX1 1HB, UK
journal: Social Networks

Abstract

We study the social structure of Facebook “friendship” networks at one hundred American colleges and universities at a single point in time, and we examine the roles of user attributes—gender, class year, major, high school, and residence—at these institutions. We investigate the influence of common attributes at the dyad level in terms of assortativity coefficients and regression models. We then examine larger-scale groupings by detecting communities algorithmically and comparing them to network partitions based on the user characteristics. We thereby compare the relative importances of different characteristics at different institutions, finding for example that common high school is more important to the social organization of large institutions and that the importance of common major varies significantly between institutions. Our calculations illustrate how microscopic and macroscopic perspectives give complementary insights on the social organization at universities and suggest future studies to investigate such phenomena further.

1 Introduction

Since their introduction, social networking sites (SNSs) such as Friendster, MySpace, Facebook, Orkut, LinkedIn, and myriad others have attracted hundreds of millions of users, many of whom have integrated SNSs into their daily lives to communicate with friends, send e-mails, solicit opinions or votes, organize events, spread ideas, find jobs, and more [Boyd and Ellison, 2007]. Facebook, an SNS launched in February 2004, now overwhelms numerous aspects of everyday life, and it has become an immensely popular societal obsession [Boyd, 2007b, Boyd and Ellison, 2007, Lewis et al., 2008b, Mayer and Puller, 2008]. Facebook members can create self-descriptive profiles that include links to the profiles of their “friends,” who may or may not be offline friends. Facebook requires that anybody who one wants to add as a friend confirm the relationship, so Facebook friendships define a network (graph) of reciprocated ties (undirected edges) that connect individual users.

The emergence of SNSs such as Facebook and MySpace has revolutionized the availability of social and demographic data, which has in turn had a significant impact on the study of social networks [Boyd and Ellison, 2007, Krebs, 2008, Lievrouw and Livingstone, 2005]. It is possible to acquire very large data sets from SNSs, though of course the population online and actively using SNSs is a biased sample of the broader population. Services like Facebook also contain large quantities of demographic data, as many users now voluntarily reveal voluminous amounts of detailed personal information. An especially exciting aspect of studying SNSs is that they provide an opportunity to examine social organization at unprecedented levels of size and detail, and they also provide new venues to test sampling effects [Kurant et al., 2011]. One can investigate the structure of an SNS like Facebook to examine it as a network in its own right, and ideally one can also try to take one step further and infer interesting insights regarding the offline social networks that an SNS imperfectly parallels. Most people tend to draw their Facebook friends from their real-life social networks [Boyd and Ellison, 2007], so it is not entirely unreasonable to use Facebook networks as a proxy for an offline social network. (Of course, as noted by Hogan [2009], one does need to be aware of significant limitations when taking such a leap of faith.)

Social scientists, information scientists, and physical scientists have all jumped on the SNS data bandwagon [Rosenbloom, 2007]. It would be impossible to exhaustively cite all of the research in this area, so we only highlight a few results; additional references can be found in the review by Boyd and Ellison [2007]. Boyd [2007a] also wrote a popular essay about her empirical study of Facebook and MySpace, concluding that Facebook tends to appeal to a more elite and educated cross section than MySpace. The company RapLeaf [Sodera, 2008] has compiled global demographics on the age and gender usage of numerous SNSs. Other recent studies have investigated the manifestation on SNSs of race and ethnicity [Gajjala, 2007], religion [Nyland and Near, 2007], gender [Geidner et al., 2007, Hjorth and Kim, 2005], and national identity [Fragoso, 2006]. Preliminary research has also suggested that online friendship networks can be exploited to improve shopper recommendation systems on websites such as Amazon [Zheng et al., 2007].

Several papers have attempted to increase understanding of how SNS friendships form. For example, Kumar et al. [2006] examined preferential attachment models of SNS growth, concluding that it is important to consider different classes of users. Lampe et al. [2007] explored the relationship between profile elements and number of Facebook friends, and other scholars have examined the importance of geography [Liben-Nowell et al., 2005] and online message activity [Golder et al., 2007] to online friendship formation. Other papers have established strong correlations between network participation and website activity, including the motivation of people to join particular groups [Backstrom et al., 2006], the recommendations of online groups [Spertus et al., 2005], online messages and friendship formation [Golder et al., 2007], interaction activity versus sense of belonging [Chin and Chignell, 2007], and the role of explicit ideological relationship designations in affecting voting behavior [Brzozowski et al., 2008, Hogg et al., 2008]. Lewis et al. [2008b] used Facebook data for an entire class of freshmen at an unnamed, private American university to conduct a quantitative study of social networks and cultural preferences. The same data set was also used to examine user privacy settings on Facebook [Lewis et al., 2008a].

In the present paper, we study the complete Facebook networks of 100 American college and universities from a single-day snapshot in September 2005. This paper is a sequel to our previous research on 5 of these institutions [Traud et al., 2010], in which we developed some of the methodology that we employ here. In September 2005, one needed a .edu e-mail address to become a member of Facebook, and the majority of “friendship” ties were within the same institution. We thus ignore links between nodes at different institutions and study the Facebook networks of the 100 institutions as 100 separate networks. For each network, we have categorical data encompassing the gender, major, class year, high school, and residence (e.g., dormitory, House, fraternity, etc.) of the users. We examine homophily and community structure (network partitions that are obtained algorithmically) for each of the networks and compare the community structure to partitions based on the given categorical data. We thereby compare and contrast the organizations of the 100 different Facebook networks, which arguably allows us to compare and contrast the organizations of the underlying university social networks that they imperfectly represent. In addition to the inherent interest of these Facebook networks, our investigation is important for subsequent use of these networks—which were formed via ostensibly the same generative mechanism online—as benchmark examples for numerous types of computations, such as new community detection methods.

The remainder of this paper is organized as follows. We first discuss the Facebook data and present the methods that we used for testing homophily at the dyad level and demographic prevalences at the community level. We then present and discuss results on the largest connected components of the networks, student-only subnetworks, and single-gender subnetworks. Finally, we summarize and discuss our findings.

2 Data

The data that we use was sent directly to us in anonymized form by Adam D’Angelo of Facebook. It consists of the complete set of users (nodes) from the Facebook networks at each of 100 American institutions (which we enumerate in Table LABEL:tab:CharTable) and all of the “friendship” links between those users’ pages as they existed in September 2005. The data clearly identifies most institutions, although there are a small number of disambiguation problems. For instance, 4 different “UC” institutions plus “Cal” are in the data, and there are 2 “Texas” listings. Each institution in the data includes a number appearing as part of its name that appears to correspond to the order in which each institution “joined” Facebook. The data can be downloaded at http://people.maths.ox.ac.uk/similar-to\simporterm/data/facebook100.zip.

Similar snapshots of Facebook data from 10 Texas institutions were analyzed recently by Mayer and Puller [2008], and a snapshot from “a diverse private college in the Northeast U.S.” was studied by Lewis et al. [2008b]. Other studies of Facebook have typically obtained data either through surveys [Boyd and Ellison, 2007] or through various forms of automated sampling [Gjoka et al., 2010], thereby missing nodes and links that can impact the resulting graph structures and analyses. We consider only ties between people at the same institution, yielding 100 separate realizations of university social networks and allowing us to compare the structures at different institutions.

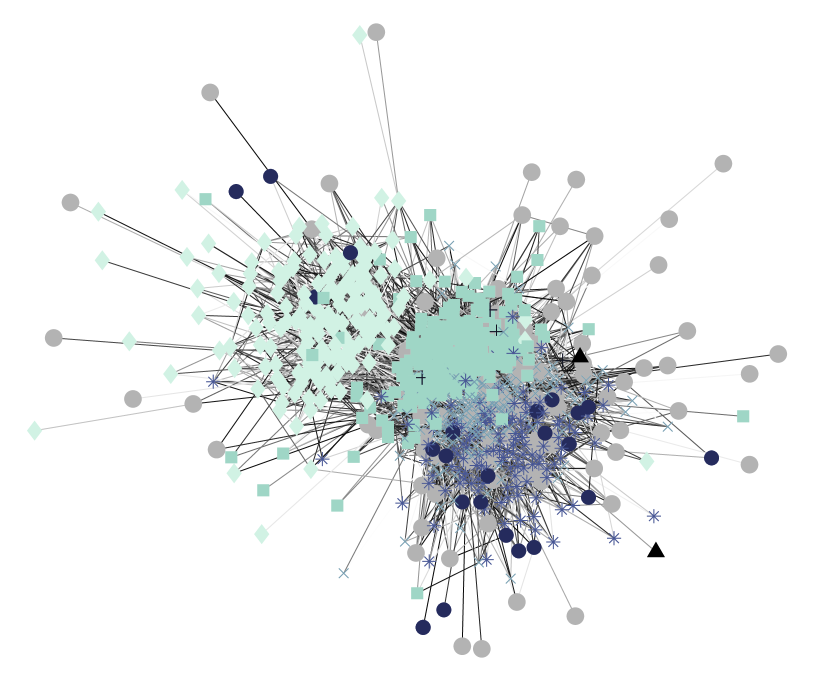
We consider four networks for each of the 100 Facebook data sets: the largest connected component of the full network (which we hereafter identify as “Full”), the largest connected component of the student-only network (“Student”), the largest connected component of the female-only network (“Female”), and the largest connected component of the male-only network (“Male”). The Male and Female networks are each subsets of the Full network rather than the Student network. Each network has a single type of unweighted, undirected connection between nodes and can thus be represented as an adjacency matrix 𝐀𝐀\mathbf{A} with elements Aij=Ajisubscript𝐴𝑖𝑗subscript𝐴𝑗𝑖A_{ij}=A_{ji} indicating the presence (Aij=1subscript𝐴𝑖𝑗1A_{ij}=1) or absence (Aij=0subscript𝐴𝑖𝑗0A_{ij}=0) of a tie between nodes i𝑖i and j𝑗j. The resulting tangle of nodes and links, which we illustrate for the Reed College student Facebook network in Figure 1, can obfuscate any organizational structure that might be present.

The data also includes limited demographic (categorical) information that is volunteered by users on their individual pages: gender, class year, and (using anonymous numerical identifiers) high school, major, and residence. We use a “Missing” label for situations in which individuals did not volunteer a particular characteristic. The different characteristics allow us to make comparisons between institutions, under the assumption (see the discussion by Boyd and Ellison [2007]) that the communities and other elements of structural organization in Facebook networks reflect (even if imperfectly) the social communities and organization of the offline networks on which they’re based. It is an important research issue to determine just how imperfect this might be [Hogan, 2009], but this is far beyond the scope of the present paper (though we hope that others will take on this particular challenge). The conclusions that we draw in this paper apply directly to the university Facebook networks from September 2005, and we expect that they can provide insight about the real-world social networks at the institutions as well.

3 Methods

We study each network at both the dyad level and the community level. We first consider homophily [Wasserman and Faust, 1994, McPherson et al., 2001, Newman, 2010]) quantified by assortativity coefficients using the available categorical data. For some of the smaller networks, we additionally perform independent logistic regression on node pairs to obtain the log odds contributions to edge presence between two nodes that have the same categorical-data value. We similarly fit exponential random graph models (ERGMs) [Handcock et al., 2008, Robins et al., 2007, Frank and Strauss, 1986, Wasserman and Pattison, 1996, Lubbers and Snijders, 2007] with triangle terms to these smaller networks. Finally, we partition the networks by algorithmically detecting communities [Porter et al., 2009, Fortunato, 2010], which we compare to the given categorical data using the technique in this paper’s prequel [Traud et al., 2010]. Calculating assortativity values and log odds contributions allows us to examine “microscopic” features of the networks, while comparing algorithmic partitions of the networks to the categorical data allows us to examine their “macroscopic” features. As we illustrate below, both perspectives are important because they provide complementary insights.

3.1 Assortativity

A general measure of scalar assortativity r𝑟r relative to a categorical variable is given by Newman [2003, 2010]:

r=tr(𝐞)𝐞21𝐞2[1,1],𝑟tr𝐞normsuperscript𝐞21normsuperscript𝐞211r=\frac{\mbox{tr}({\bf e})-\|{\bf e}^{2}\|}{1-\|{\bf e}^{2}\|}\in[-1,1]\,, (1)

where 𝐞=𝐄/𝐄𝐞𝐄norm𝐄{\bf e}={\bf E}/\|{\bf E}\| is the normalized mixing matrix, the elements Eijsubscript𝐸𝑖𝑗E_{ij} indicate the number of edges in the network that connect a node of type i𝑖i (e.g., a person with a given major) to a node of type j𝑗j, and the entry-wise matrix 111-norm 𝐄norm𝐄\|{\bf E}\| is equal to the sum of all entries of 𝐄𝐄{\bf E}. By construction, this formula yields r=0𝑟0r=0 when the amount of assortative mixing is the same as that expected independently at random (i.e., eijsubscript𝑒𝑖𝑗e_{ij} is simply the product of the fraction of nodes of type i𝑖i and the fraction of nodes of type j𝑗j), and it yields r=1𝑟1r=1 when the mixing is perfectly assortative.

3.2 Logistic Regression and Exponential Random Graphs

We further measure the influence of the available user characteristics on the likelihood of a “friendship” tie via a fit by logistic regression (under an assumption of independent dyads) and by an ERGM specification that includes triangle terms. Our focus is on trying to calculate the propensity for two nodes with the same categorical value to form a tie. We consider each of the four categorical variables (major, residence, year, and high school) and use the ERGM package in R [Handcock et al., 2008] for both models (treating each network as undirected). We used R 2.11.1 and the statnet package version 2.1-1, and we note that different versions of R and statnet caused different degrees of convergence with the structural elements in the model. We obtained results for the 16 smallest institutions. (We did these calculations on a 32-bit operating system, which restricts the network sizes that can be processed.) Both models that we consider are based on a standard ERGM parametrization Pθ{𝐘=𝐀}=exp{θ𝐠(𝐀)}/κ(θ)subscript𝑃𝜃𝐘𝐀𝜃𝐠𝐀𝜅𝜃P_{\mathbf{\theta}}\{\mathbf{Y}=\mathbf{A}\}=\exp\{\mathbf{\theta}\cdot\mathbf{g}(\mathbf{A})\}/\kappa(\mathbf{\theta}) describing the distribution of graphs with model coefficients θ𝜃\mathbf{\theta} corresponding to statistics calculated from the adjacency matrix 𝐀𝐀\mathbf{A} (with a normalizing factor κ𝜅\kappa to ensure that the formula yields a probability distribution) [Handcock et al., 2008, Robins et al., 2007, Frank and Strauss, 1986, Wasserman and Pattison, 1996, Lubbers and Snijders, 2007].

In the first model (logistic regression), we include five statistics (with five corresponding θ𝜃\mathbf{\theta} coefficients): the total density of ties (edges) and the common classifications (nodematch) from each of four node/user characteristics: residence, class year, major, and high school. For example, the θhighschoolsubscript𝜃highschool\theta_{\mathrm{highschool}} contribution describes the additional log-odds predisposition for a “friendship” tie when two users are from the same high school. In all cases, we ignore possible contributions from missing characteristic data: two nodes with the same missing data field are not treated as having the same value for the characteristic. Rather than include gender explicitly in the model, we instead additionally fit the model to the single-gender subnetworks in order to be consistent with the treatment of gender in the community-level comparisons below. In the second model (an ERGM), we add a triangle statistic to account for the observed amount of transitivity in the network data. This gives a total of six θ𝜃\mathbf{\theta} coefficients: edges, common residence, common class year, common major, common high school, and the triangle coefficient.

3.3 Community Detection

The global organization of social networks often includes coexisting modular (horizontal) and hierarchical (vertical) organizational structures, and myriad papers have attempted to interpret such organization through the computational identification of “community structure.” Communities are defined in terms of cohesive groups of nodes with more internal connections (between nodes in the same group) than external connections (between nodes in the group and nodes in other groups). As discussed at length in two recent review articles [Porter et al., 2009, Fortunato, 2010] and in references therein, the ensemble of techniques available to detect communities is both numerous and diverse. Existing techniques include hierarchical clustering methods such as single linkage clustering, centrality-based methods, local methods, optimization of quality functions such as modularity and similar quantities, spectral partitioning, likelihood-based methods, and more. Communities are considered to not be merely structural modules but are also expected to have functional importance because of the large number of common ties among nodes in a community. For example, communities in social networks might correspond to circles of friends or business associates and communities in the World Wide Web might encompass pages on closely-related topics. In addition to remarkable successes on benchmark problems, investigations of community structure have observed correspondence between communities and “ground truth” groups in diverse application areas—including the reconstruction of college football conferences [Girvan and Newman, 2002] and the investigation of such structures in algorithmic rankings [Callaghan et al., 2007]; the investigation of committee assignments [Porter et al., 2005], legislation cosponsorship [Zhang et al., 2008], and voting blocs [Waugh et al., 2009, Mucha et al., 2010] in the United States Congress; the examination of functional groups in metabolic networks [Guimerà and Amaral, 2005]; the study of ethnic preferences in school friendship networks [González et al., 2007]; and the study of social structures in mobile-phone conversation networks [Onnela et al., 2007]

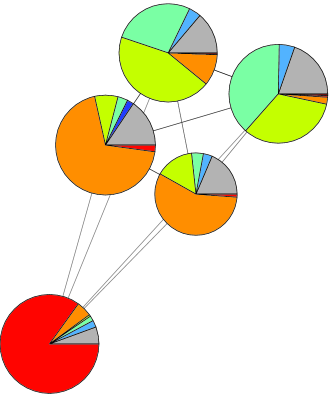
In the present paper, we investigate the community structures of the Facebook networks from each of the 100 colleges and universities. (See the visualization of the community structure for Reed College in Figure 2.) For each institution, we consider the Full, Student, Female, and Male networks. We seek to determine how well the demographic labels included in the data correspond to algorithmically computed communities. Assortativity provides a local measure of homophily, but that does not provide sufficient information to draw conclusions about the global organization of the Facebook networks. For example, two students who attended the same high school are typically more likely to be friends with each other than are two students who attended different high schools, but this will not necessarily have a meaningful community-level effect unless enough of the students went to common high schools. As we we will see below, high school tends to be a much more dominant organizing characteristic of the social structure at the large institutions than at small institutions, presumably because of a significant frequency of common high school pairs at the large institutions.

We identify communities by optimizing the “modularity” quality function Q=i(eiibi2)𝑄subscript𝑖subscript𝑒𝑖𝑖superscriptsubscript𝑏𝑖2Q=\sum_{i}(e_{ii}-b_{i}^{2}), where eijsubscript𝑒𝑖𝑗e_{ij} denotes the fraction of ends of edges in group i𝑖i for which the other end of the edge lies in group j𝑗j and bi=jeijsubscript𝑏𝑖subscript𝑗subscript𝑒𝑖𝑗b_{i}=\sum_{j}e_{ij} is the fraction of all ends of edges that lie in group i𝑖i. High values of modularity correspond to community assignments with greater numbers of intra-community links than expected at random (with respect to a particular null model [Newman, 2006a, Porter et al., 2009, Fortunato, 2010]). Although numerous other community detection methods are also available, modularity optimization is perhaps the most popular way to detect communities and it has been successfully applied to many applications [Porter et al., 2009, Fortunato, 2010]. One might also consider using a method that includes a resolution parameter [Reichardt and Bornholdt, 2006] to avoid issues with resolution limits [Fortunato and Barthelemy, 2007]. However, our primary focus is on global organization of the networks, so we limit our attention to the default resolution of modularity. This focus arguably biases our study of communities to the largest structures, such as those influenced by common class year, making the observed correlations with other demographic characteristics even more striking.

To try to ensure that the communities we detect are properties of the data rather than of the algorithms that we used, we optimize modularity (with default resolution) using 6 different combinations of spectral optimization, greedy optimization, and Kernighan and Lin [1970] (KL) node-swapping steps (in the manner discussed by Newman [2006b]). Specifically, we use (1) recursive partitioning by the leading eigenvector of a modularity matrix [Newman, 2006a], (2) recursive partitioning by the leading pair of eigenvectors (including the Richardson et al. [2009] extension of the method in Newman [2006a]), (3) the Louvain greedy method [Blondel et al., 2008], and each of these three supplemented with small increases in the quality Q𝑄Q that can be obtained using KL node swaps. Each of these 6 methods yields a community partition, and we obtain our comparisons (described in Section 3.4) by considering each of these 6 partitions.

Modularity optimization is NP-hard [Brandes et al., 2008], so one must be cautious about the large number of degenerate partitions in the modularity landscape [Good et al., 2010]. However, by detecting coarse observables—in particular, the global organization of a Facebook network based on the given categorical data—and considering results that are averaged over multiple optimization methods, one can obtain interesting insights. The specific “best” partition will vary from one method to another, but some of the predicted coarse organizational structure of the networks (see below) is robust to the choice of community detection algorithm.

3.4 Comparing Communities to Node Data

Once we have detected communities for each institution, we will compare the algorithmically-obtained community structure to the available categorical data for the nodes. We recently developed a methodology to accomplish this goal in Traud et al. [2010] (where we considered only 5 institutions among the 100 in order to illustrate the techniques). This method of comparison can be applied to the output of any “hard partitioning” algorithm in which each node is assigned to precisely one community (cf. “soft partitioning” methods, in which communities can overlap). We briefly review that methodology here.

To compare a network partition to the categorical demographic data, we standardize (using a z𝑧z-score) the Rand coefficient of the communities in that partition compared to partitioning based purely on each of the four categorical variables (one at a time). For each comparisons, we calculate the Rand z𝑧z-score z𝑧z in terms of the total number of pairs of nodes in the network M𝑀M, the number of pairs that are in the same community M1subscript𝑀1M_{1}, the number of pairs that have the same categorical value M2subscript𝑀2M_{2}, and the number of pairs of nodes that are both in the same community and have the same categorical value w𝑤w [Traud et al., 2010]. The Rand coefficient is given in term of these quantities by S=[w+(MM1M2+w)]/M𝑆delimited-[]𝑤𝑀subscript𝑀1subscript𝑀2𝑤𝑀S=[w+(M-M_{1}-M_{2}+w)]/M [Rand, 1971]. We then calculate the z𝑧z-score for the Rand coefficient as [Hubert, 1977, Traud et al., 2010]

z=1σw(wM1M2M),𝑧1subscript𝜎𝑤𝑤subscript𝑀1subscript𝑀2𝑀z=\frac{1}{\sigma_{w}}\left(w-\frac{M_{1}M_{2}}{M}\right)\,, (2)

where

σw2superscriptsubscript𝜎𝑤2\displaystyle\sigma_{w}^{2} =M16(4M12M)2(4M22M)2256M2+C1C216n(n1)(n2)absent𝑀16superscript4subscript𝑀12𝑀2superscript4subscript𝑀22𝑀2256superscript𝑀2subscript𝐶1subscript𝐶216𝑛𝑛1𝑛2\displaystyle=\frac{M}{16}-\frac{(4M_{1}-2M)^{2}(4M_{2}-2M)^{2}}{256M^{2}}+\frac{C_{1}C_{2}}{16n(n-1)(n-2)} (3)
+[(4M12M)24C14M][(4M22M)24C24M]64n(n1)(n2)(n3),delimited-[]superscript4subscript𝑀12𝑀24subscript𝐶14𝑀delimited-[]superscript4subscript𝑀22𝑀24subscript𝐶24𝑀64𝑛𝑛1𝑛2𝑛3\displaystyle+\frac{[(4M_{1}-2M)^{2}-4C_{1}-4M][(4M_{2}-2M)^{2}-4C_{2}-4M]}{64n(n-1)(n-2)(n-3)}\,, (4)

n𝑛n is the number of nodes in the network, the coefficients C1subscript𝐶1C_{1} and C2subscript𝐶2C_{2} are given by

C1subscript𝐶1\displaystyle C_{1} =n(n23n2)8(n+1)M1+4ini3,absent𝑛superscript𝑛23𝑛28𝑛1subscript𝑀14subscript𝑖superscriptsubscript𝑛𝑖3\displaystyle=n(n^{2}-3n-2)-8(n+1)M_{1}+4\sum_{i}n_{i\cdot}^{3}\,, (5)
C2subscript𝐶2\displaystyle C_{2} =n(n23n2)8(n+1)M2+4jnj3,absent𝑛superscript𝑛23𝑛28𝑛1subscript𝑀24subscript𝑗superscriptsubscript𝑛absent𝑗3\displaystyle=n(n^{2}-3n-2)-8(n+1)M_{2}+4\sum_{j}n_{\cdot j}^{3}\,, (6)

nijsubscript𝑛𝑖𝑗n_{ij} denotes an element of a contingency table and indicates the number of nodes that are classified into the i𝑖ith group of the first partition and the j𝑗jth group of the second partition, ni=jnijsubscript𝑛𝑖subscript𝑗subscript𝑛𝑖𝑗n_{i\cdot}=\sum_{j}n_{ij} is a row sum, and nj=inijsubscript𝑛absent𝑗subscript𝑖subscript𝑛𝑖𝑗n_{\cdot j}=\sum_{i}n_{ij} is a column sum. Each z𝑧z-score indicates the deviation from randomness in comparing the community structure with the partitioning based purely on that single demographic characteristic. One needs to be cautious when interpreting such deviations from randomness as a strength of correlation. In particular, given the dependence on system size inherent in this measure, one should not overinterpret the relative values of z𝑧z-scores from different institutions. Nevertheless, the z𝑧z-scores provide a reasonable proxy quantity both for the statistical significance of correlation and for the relative strength of correlation in a specified network.

4 Results

We now use the methods outlined in the previous section to study the Facebook networks. We first follow the order of presentation above and then make some observations in combinations. Complete results are available in the tables in the appendix.

4.1 Assortativity

We tabulate the assortativities based on gender, major, residence, class year, and high school for all networks (and subsets thereof) in Table LABEL:tab:AssortTable.

For almost all of the institutions and each of the 4 network subsets, the class year attribute produces higher assortativity values than the other available demographic characteristics. However, Rice University (31), California Institute of Technology (36), University of Georgia (50), University of Michigan (67), Auburn University (71), and University of Oklahoma (97) are each examples in which residence provides the highest assortativity values (again, for each of the 4 network subsets). We discussed Caltech as a focal example in Traud et al. [2010], in which we introduced the community comparison methods that we employ below.

Other institutions have varying orderings of class year and residence assortativity among the 4 network subsets. At MIT (8), USF (51), Notre Dame (57), University of Maine (59), UC (61), UC (64), and MU (78), residence gives the highest assortativity in the Male networks. The UCF (52) Female network has its highest assortativity with residence. Both the Full network and the Male network for University of California at Santa Cruz (68) have their highest assortativity values with residence. Both the Male and Female networks at University of Illinois at Urbana-Champaign (20), Tulane (29), UC (33), Florida State University (53), Cal (65), University of Mississippi (66), University of Indiana (69), Texas (80), Texas (84), University of Wisconsin (87), Baylor (93), University of Pennsylvania (94), and University of Tennessee (95) have their highest assortativity values with residence; all other networks from these institutions have their highest assortativity with class year.

Some outlying observations can be tied directly to small samples. For example, Simmons (81) is a female-only college. It has only four males in the Full network; none of the males had any connections with another male, so the gender assortativity values for both the Full and Student components are very close to 00. Similar gender numbers are also present in the data from Wellesley (22) and Smith (60).

4.2 Dyad-Level Regression and Exponential Random Graphs

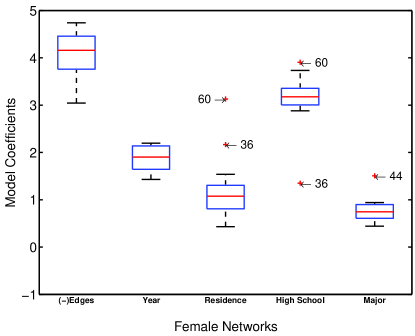
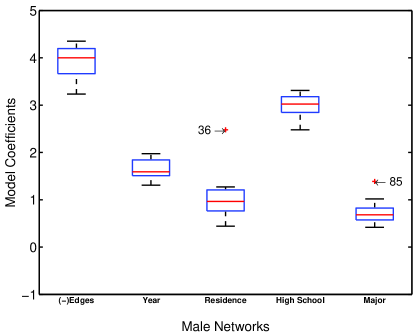
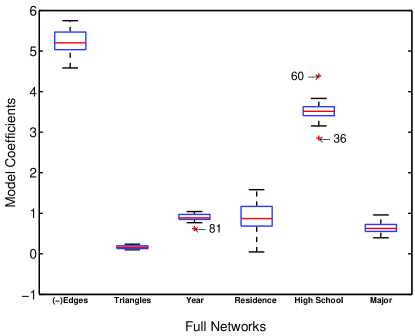
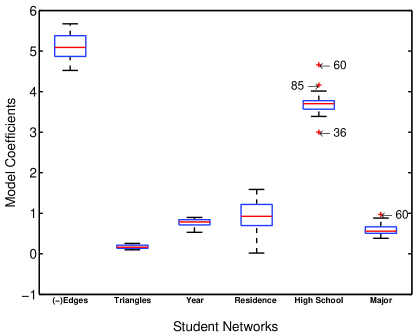
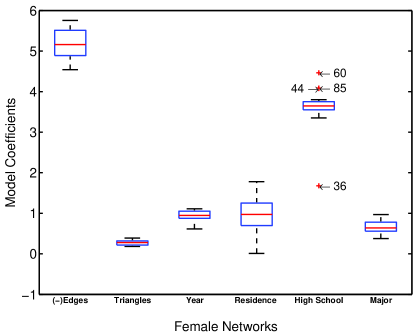
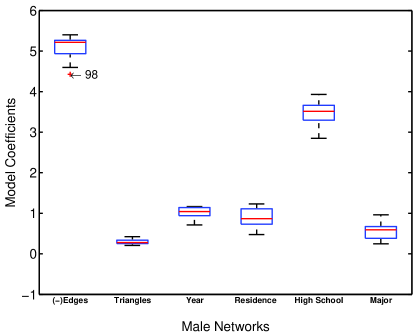
We use the two statistical models described in Section 3.2 to study the 16 smallest institutions. The (dyad-independent) logistic regression model includes contributions from edges (network density) and matched user (node) characteristics for each of four demographic variables. We present the results for this model in Table LABEL:tab:LogOdds2. The second model that we consider is an ERGM, which supplements the first model with a structural triangle contribution. We present the results for this model in Table LABEL:tab:LogOdds1. These calculations give views of the networks at the microscropic (dyad-level) scale that supplement the results that we obtained using the assortativity statistics.

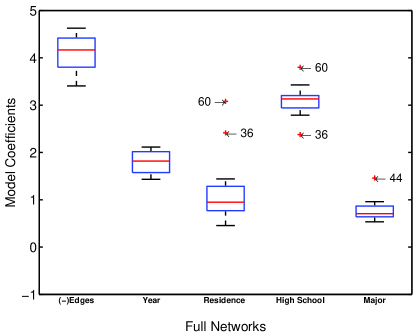
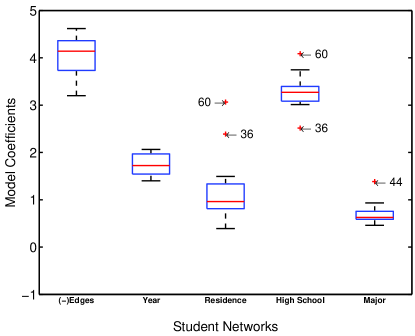
We consider the results from the 16 smallest institutions by fitting the models to each of their Full, Student, Female, and Male networks. Because all of the resulting model coefficients appear to be statistically significant at a p𝑝p-value of less than 104superscript10410^{-4}, we interpret the importance of node matching on the different demographic characteristics directly from the magnitude of the corresponding model coefficients. We summarize the results for these 16 institutions using the box plots in Figures 3 and 4. The box plots identify the outliers by institution number: Caltech (36), Oberlin (44), Smith (60), Simmons (81), Vassar (85), and Reed (98). (As we have only performed this regression analysis for the 16 smallest institutions in the data, one should not jump to conclusions from this list of outliers.) For all institutions and all four types of networks for each institution, the highest coefficient in the employed ERGM model (with triangle terms) is given for matching the High School category, and the value of this coefficient is significantly higher than those for the other node-matching coefficients. Only the Caltech (36) Female network has ERGM coefficients for Year, Residence, and High School that are very close to each other.

4.3 Comparison of Communities

We now discuss community-level results for each network using z𝑧z-scores of the Rand coefficient to compare partitions obtained via algorithmic community detection to partitions based on each characteristic. That is, each community-detection result identifies a group assignment for each node, thereby producing a partition (called a “hard” partition) in which each node is assigned to exactly one community. One can also obtain a hard partition for each network by selecting a single characteristic and grouping nodes according to that characteristic. Every network that we study (including the subnetworks) has at least one z𝑧z-score in the set {zMajor,zYear,zHS,zResidence}subscript𝑧Majorsubscript𝑧Yearsubscript𝑧HSsubscript𝑧Residence\{z_{\mbox{Major}},z_{\mbox{Year}},z_{\mbox{HS}},z_{\mbox{Residence}}\} with a value greater than 555. Although the distribution of Rand coefficients is decidedly not Gaussian, particularly in the tails of the distributions [Traud et al., 2010, Brook and Stirling, 1984, Kulisnkaya, 1994], this z=5𝑧5z=5 threshold indicates that at least one characteristic in each network exhibits strong statistical significance. Moreover, we will see that the vast majority of our comparisons below exceed the z=2𝑧2z=2 threshold. (That is, they essentially lie outside 95% confidence intervals.)

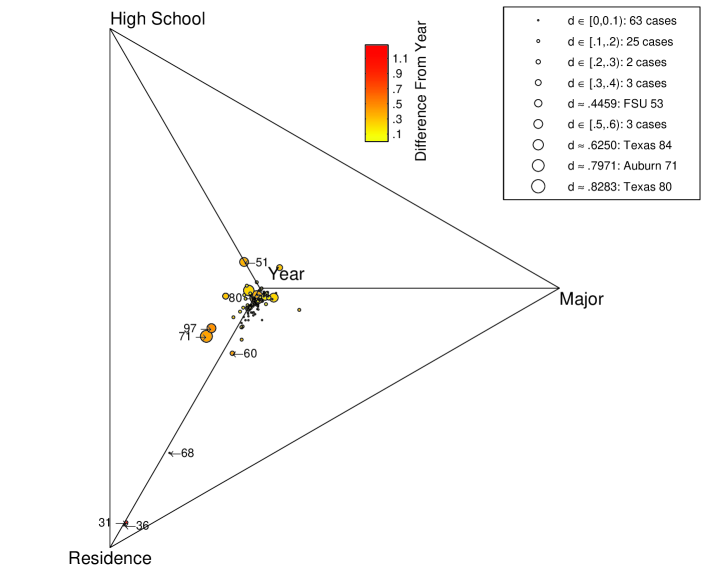
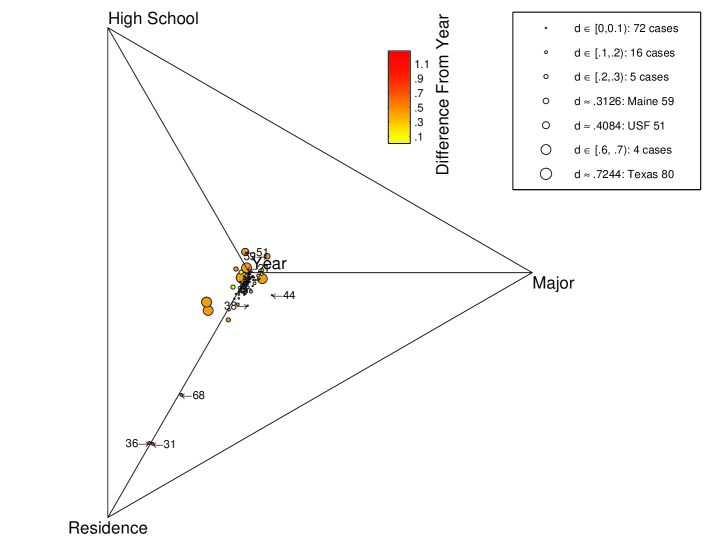
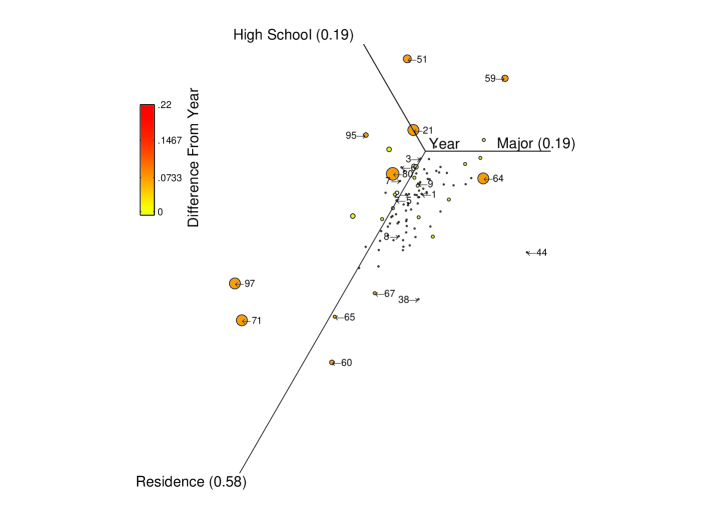
To visualize and compare the varied strengths of organization according to the different demographic characteristics, we represent the four z𝑧z-scores obtained for each network (Full, Student, Female, and Male) of an institution using 3-dimensional barycentric (tetrahedral) coordinates [Weisstein, 2011, Franklin, 2002]. We start by setting all negative z𝑧z-scores to 00, as all observed negative z𝑧z-score values are small enough to be statistically insignificant. We then normalize by the sum of the z𝑧z-scores to obtain

z1subscript𝑧1\displaystyle z_{1} =zMajorzMajor+zYear+zHS+zResidence,absentsubscript𝑧Majorsubscript𝑧Majorsubscript𝑧Yearsubscript𝑧HSsubscript𝑧Residence\displaystyle=\frac{z_{\mbox{Major}}}{z_{\mbox{Major}}+z_{\mbox{Year}}+z_{\mbox{HS}}+z_{\mbox{Residence}}}\,, (7)
z2subscript𝑧2\displaystyle z_{2} =zResidencezMajor+zYear+zHS+zResidence,absentsubscript𝑧Residencesubscript𝑧Majorsubscript𝑧Yearsubscript𝑧HSsubscript𝑧Residence\displaystyle=\frac{z_{\mbox{Residence}}}{z_{\mbox{Major}}+z_{\mbox{Year}}+z_{\mbox{HS}}+z_{\mbox{Residence}}}\,, (8)
z3subscript𝑧3\displaystyle z_{3} =zYearzMajor+zYear+zHS+zResidence,absentsubscript𝑧Yearsubscript𝑧Majorsubscript𝑧Yearsubscript𝑧HSsubscript𝑧Residence\displaystyle=\frac{z_{\mbox{Year}}}{z_{\mbox{Major}}+z_{\mbox{Year}}+z_{\mbox{HS}}+z_{\mbox{Residence}}}\,, (9)
z4subscript𝑧4\displaystyle z_{4} =zHSzMajor+zYear+zHS+zResidence.absentsubscript𝑧HSsubscript𝑧Majorsubscript𝑧Yearsubscript𝑧HSsubscript𝑧Residence\displaystyle=\frac{z_{\mbox{HS}}}{z_{\mbox{Major}}+z_{\mbox{Year}}+z_{\mbox{HS}}+z_{\mbox{Residence}}}\,. (10)

From these 4 z𝑧z-score values, we calculate coordinates X=(x1,x2,x3)𝑋subscript𝑥1subscript𝑥2subscript𝑥3X=(x_{1},x_{2},x_{3}) located inside a tetrahedron. For example, one can obtain a tetrahedron whose vertices are p1=(1,0,0)subscript𝑝1100p_{1}=(1,0,0), p2=(cos(2π/3),sin(2π/3),0)subscript𝑝22𝜋32𝜋30p_{2}=(\cos(2\pi/3),\sin(2\pi/3),0), p3=(cos(4π/3),sin(4π/3),0)subscript𝑝34𝜋34𝜋30p_{3}=(\cos(4\pi/3),\sin(4\pi/3),0), and p4=(0,0,2)subscript𝑝4002p_{4}=(0,0,\sqrt{2})) with the transformation

X𝑋\displaystyle X =(T×Z)+p4,absent𝑇𝑍subscript𝑝4\displaystyle=(T\times Z)+p_{4}\,,
T𝑇\displaystyle T =[p1p4p2p4p3p4],absentdelimited-[]subscript𝑝1subscript𝑝4subscript𝑝2subscript𝑝4subscript𝑝3subscript𝑝4\displaystyle=\left[\begin{array}[]{ccc}p_{1}-p_{4}&p_{2}-p_{4}&p_{3}-p_{4}\end{array}\right]\,, (12)
Z𝑍\displaystyle Z =[z1z2z3].absentdelimited-[]subscript𝑧1subscript𝑧2subscript𝑧3\displaystyle=\left[\begin{array}[]{c}z_{1}\\ z_{2}\\ z_{3}\end{array}\right]\,. (16)

The information from z4=1(z1+z2+z3)subscript𝑧41subscript𝑧1subscript𝑧2subscript𝑧3z_{4}=1-(z_{1}+z_{2}+z_{3}) is implicitly included in (16) because of the normalization. Each of the 4 vertices of the tetrahedron corresponds to a limit in which the corresponding z𝑧z-score completely dominates the other three z𝑧z-scores. That is, at a vertex, the entire z𝑧z-score sum arises from the corresponding component.

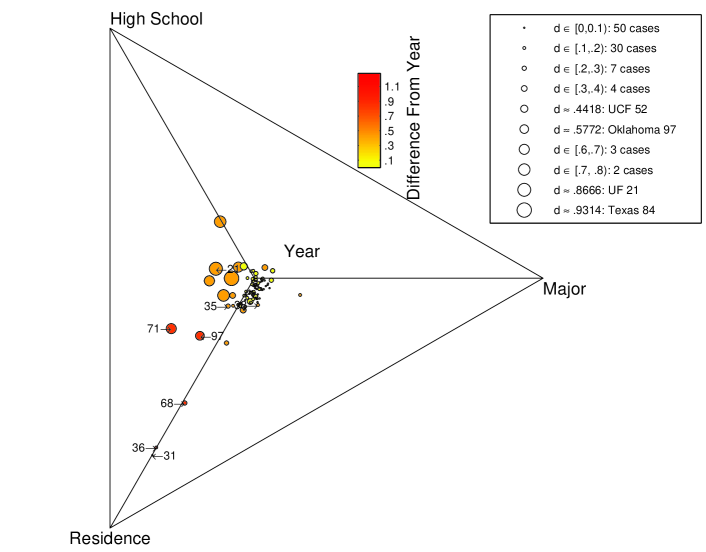
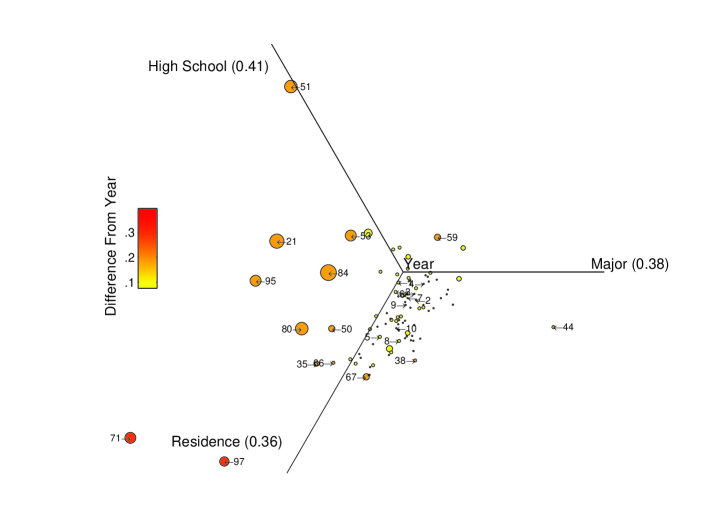
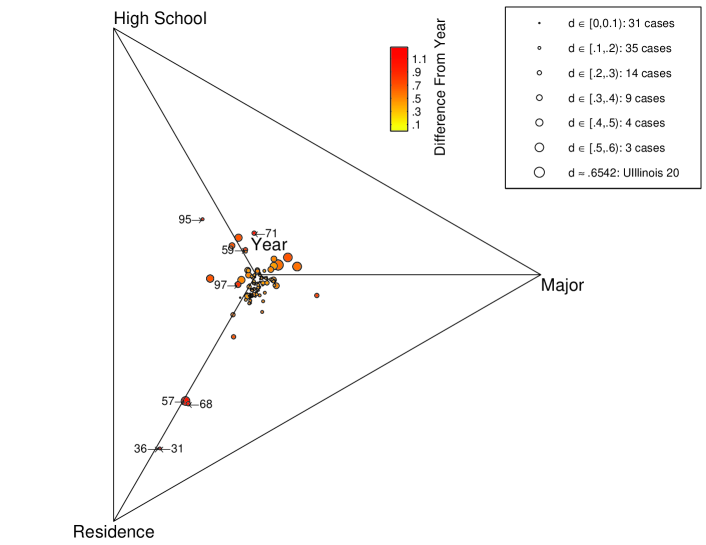
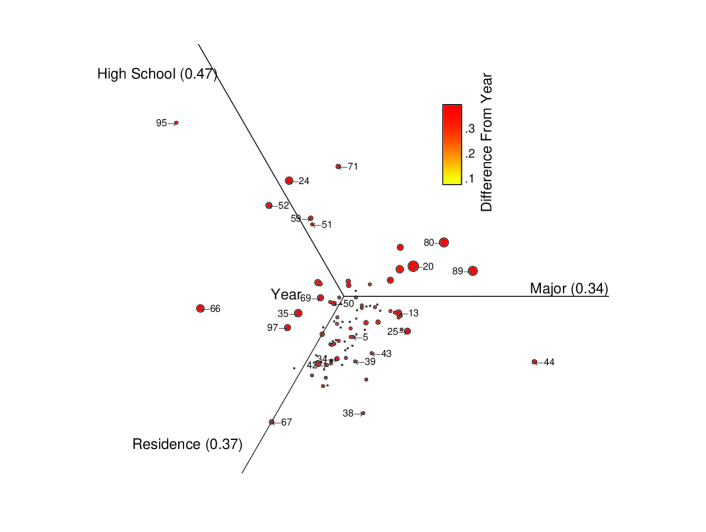
Because of the strong role of class year, we visualize the tetrahedra from a perspective located above the vertex corresponding to class year and project the result into the opposing face of the tetrahedron. We calculate the point X𝑋X for each of the 6 algorithmic partitions of each network (i.e., using the aforementioned 6 different community detection methods). For each institution, we plot a disk whose center lies at the midpoint of these 6 X𝑋X coordinates. The width of each disk is proportional to the maximum observed difference between these 6 sets of coordinates (with these distances separated into bins of width .1.1.1, as indicated in the legends of Figures 58). For example, in Figure 5, the Pepperdine (86) results have a maximum distance of .0141.0141.0141 between partitions, so Pepperdie (86) is represented by one of the smallest disks. Harvard (1) has a maximum distance of .1581 between partitions; this lies in [.1,.2).1.2[.1,.2), so Harvard (1) is represented by one of the disks of second smallest size. We emphasize that the computed differences are much larger than the span of the depicted disks, whose sizes allow one to discern the results from different institutions.

In Figures 58, we show each of the 100 institutions, identified by number (see Table LABEL:tab:CharTable), using a disk that we have color-coded according to the Cartesian distance of its center from the Year vertex. Class year is the predominant organizing category among the ones present in the data, so most of the institutions are located very close to the Year vertex. We zoom in on the Year vertex for each figure in order to better discern the relative importance of class year at the institutions. Importantly, the social organization of a few institutions differs considerably from that of the majority. Each of these institutions lies close to the Residence vertex, so their community structures are organized predominantly according to dormitory residence. Foremost among these institutions are Rice (31) and California Institute of Technology (36). As we discussed in Traud et al. [2010], California Institute of Technology (Caltech) is well-known to be organized almost exclusively according to its undergraduate “House” system [Looijen and Porter, 2007].

In repeatedly observing a strong correlation of class year with community structure, it is relevant to recall that the community detection method that we have employed optimizes modularity at the default resolution. Because of the resolution limit of modularity [Fortunato and Barthelemy, 2007], it might be interesting to explore individual networks at different scales using resolution parameters [Reichardt and Bornholdt, 2006, Fortunato, 2010, Porter et al., 2009]. We reiterate, however, that our focus in the present paper is on large-scale features rather than precise node membership of network partitions.

In Figure 5, we show the social organization tetrahedron for the Full networks (i.e, for the the largest connected components of the complete networks) for each institution. Although the community structure of nearly all of the Full networks are organized overwhelmingly by class year, a few of them are also heavily influenced by dormitory residence. (We already mentioned above that Rice (31) and Caltech (36) are organized predominantly by Residence.) For example, dormitory residence also dominates the community structure at UC Santa Cruz [UCSC] (68), though to a lesser extent than at Rice and Caltech. We also observe relatively high Residence z𝑧z-scores at Smith (60), Auburn (71), and University of Oklahoma (97). Major seems to be most important relative to the other available characteristics at Oberlin (44) and Maine (59), though in both cases its relative correlation pales in comparison to that of class year. High School seems to be most important at USF (51) and Tennessee (95), though class year is again more important. Most of the institutions are clustered tightly near the Year vertex, but Residence can often be rather important (and sometimes even the most important category, as we have seen in three cases).

In Figure 6, we show the social organization tetrahedron for the Student networks (i.e., for the largest connected component of the student-only subnetworks) for each institution. As we saw with the Full networks, most of the institutions have community structures that are organized overwhelming according to class year. Rice, Caltech, Smith, UCSC, Auburn, and Oklahoma are again exceptions, as dormitory residence also exerts considerable (or even primary) influence at these institutions. Additionally, considering the Student network reduces the relative dominance of the Year vertex, although it clearly still dominates the social organization. This feature is illustrated by institutions such as UC (64), UF (21), and Rutgers (89).

In Figure 7, we show the social organization tetrahedron for the Female networks (i.e., for the largest connected component of the female-only subnetworks) for each institution. Class year is once again the overwhelmingly dominant organizing characteristic, and dormitory residence is again important at institutions such as Rice, Caltech, Smith, UCSC, Auburn, and Oklahoma. However, we now observe an increased importance of the High School vertex. USF (51), Tennessee (95), UF (21), FSU (53), and GWU (54) all lie closer to the High School vertex than was the case in the Full and Student networks.

In Figure 8, we show the social organization tetrahedron for the Male networks (i.e., for the largest connected component of the male-only subnetworks) for each institution. Class year is once again the overwhelmingly dominant organizing characteristic, and dormitory residence is again the most important category at institutions such as Rice, Caltech, and UCSC. Interestingly, considering the Male network suggests that Residence is the most important factor for the social organization for the males at Notre Dame (57). Residence also exerts an important influence on the males at Michigan (67). This is starkly different from what we observed for these institutions in the Full, Student, and Female networks (and would seem to be something interesting to investigate more thoroughly in the future using other data and methods). The Male UCF (52), MSU (24), USF (51), Auburn (71), and Maine (59) networks are strongly influenced by High School. The Male networks at Texas (80), Rutgers (89), and University of Illinois at Urbana-Champaign (20) stand out from other universities because of their proximity to the Major vertex.

4.4 Discussion

As described above, we see using the z𝑧z-scores of the Rand coefficients for demographic characteristics versus algorithmic community assignments that Year is the strongest organizing factor at most institutions but that Residence is much more important for the community organization at some institutions than at others. The correlation with Residence is especially prominent at Rice (31) and Caltech (36). We also observe that the Male networks tend to be more scattered around Year, as some institutions exhibit a stronger correlation with Major, whereas others have a stronger correlation with high school. This suggests that there are potential differences in the gender patterns of friendships, which would be interesting to investigate in future studies with new data. We do not explore this general issue further and instead attempt to identify interesting comparisons with the results that we obtained above. Although it is of course impossible to be exhaustive in our observations, we present all of our assortativity values, regression model coefficients, and community-comparing z𝑧z-scores in the tables in Appendix A. We also highlight some interesting facets of our results.

Of particular interest is the comparison of results from the dyad-level regression models to those from community-level correlations. We note in particular that the logistic regression and exponential random graph models that we employed for the smallest 16 institutions specify that almost all institutions and all of their subnetworks give the highest model coefficient contribution towards a link between nodes from a common High School. However, as we have seen—and which is particularly evident using the visualizations with tetrahedra—at the community level, most institutions are organized by class year and have a relatively small correlation with high school.

Even in the rare cases in which the rank ordering of the four correlations (with Year, Residence, Major, and High School) at the community level matches that obtained via dyad-level model coefficients, such as with the logistic regression model for the Full and Female networks from Caltech (36), the relative sizes of the contributions at the dyad level are completely different from those observed at the community level. Caltech supplies an illustrative example of the different insights obtained from community-detection versus logistic regression and exponential random graph models both because of its small size and because of its outlying correlation with dormitory residence at the community level. A simple interpretation of the apparent dichotomy between the dyad-level model coefficients and the correlations at the community scale is that the presence of two students from the same high school at a small institution like Caltech yields a significant increase in the likelihood of a tie between those students. Even though the corresponding model coefficient is smaller than in any of the other of the 16 smallest institutions, it is comparable to that for common residence (called “Houses” at Caltech). Nevertheless, the very small number of node pairs at Caltech that have the same high school relative to the total number of node pairs has a very small effect at the community level, as the algorithmically obtained communities are correlated overwhelmingly with House affiliation. The ERGM result with triangle contributions makes this distinction even more striking, as the common high school coefficient is actually larger than the coefficient from common House.

We also observe other features that might be worthy of future investigation using other data sets and methodologies. We report the results of our calculations in depth in Tables LABEL:tab:CharTableLABEL:tab:ZTable. Here we highlight only a few potentially interesting examples in which different methods or different subnetworks yield apparently different qualitative conclusions. For example, we found that Major is the second most important factor for the organization of the communities in all of the Oberlin (44) networks, but only for the Full and Male networks does the logistic regression give the second highest coefficient for Major. We also observed that the relative ordering of Major at the same institution is sometimes gender-dependent. For example, Major gives the second largest z𝑧z-score in the Female and Male networks of Stanford (3), but it gives the fourth largest z𝑧z-score in Stanford’s Full network. Even more interesting, Major gives the second largest z𝑧z-score for the Female network at UVA (16), the third largest z𝑧z-score for UVA’s Male network, and the fourth largest z𝑧z-score for its Full network. The communities in the Auburn (71) Female network are dominated by Residence, but those in the other Auburn networks are not. Similarly, the communities in the MIT (8) Male network are dominated by Residence, but those in the other MIT (8) networks are not. Another interesting disparity based on gender occurs in the communities in the Tennessee (95) Full and Student networks, which have their second largest contributions from High School, whereas those in the other two Tennessee networks have their second largest contributions from Residence.

5 Conclusions

We have studied the social structure of Facebook “friendship” networks at one hundred American institutions at a single point in time (using data from September 2005). To compare the organizations of the 100 institutions using categorical data, we considered both microscopic and macroscopic perspectives. In particular, calculating assortativity coefficients and regression model coefficients based on observed ties allows one to examine homophily at the local level, and algorithmic community detection allows a complementary macroscopic picture. These approaches complement each other, providing different perspectives on investigations of these Facebook networks. Such complementary calculations are particularly valuable when the microscopic and macroscopic perspectives identify different dominant contributions. For example, in the Caltech networks, the assumed ground truth of the importance of the House system is captured better by computing community structure.

This “real-world ensemble” of 100 networks formed by ostensibly similar mechanisms has the potential to provide a testing ground for various models of network formation. Because of the useful comparisons such an ensemble of data can facilitate, this data will similarly be useful for studies of dynamic processes on networks, algorithmic community detection, and so on. Because of the different rates of initial Facebook adoption at different institutions, the single point in time represented by the data might usefully describe different stages in the formation of an online social network. In order to pursue such ideas further, one needs to start by studying the networks for their own sake and comparing their structures. This was the goal of the present paper. In particular, we have identified some of the key differences across these 100 realizations of online social networks.

Some of our observations confirm conventional wisdom or are intuitively clear, providing soft verification of our investigation via expected results. For example, we found that class year is often important, Houses are important at Caltech, and high school plays a greater role in the social organization of large universities than it does at smaller institutions (where there are typically fewer pairs of people from the same high school). Other results are quite fascinating and merit further investigation. In particular, the differences in the community structures of the female-only and male-only networks would be interesting to investigate in both offline and online settings. The Facebook data suggests that women are typically more likely to have friends within their common residence (among the demographic data to which we have access) but that the characteristics in the communities in the male-only networks exhibit a wider variation. Investigating this thoroughly would require different data sets and methodologies, especially if one wishes to discern the causes of such friendships from observed correlations.

The Facebook networks that we study offer imperfect representations of corresponding real-life social networks, which have different properties from online social networks. It is thus crucial that our results are complemented by studies of the corresponding real networks in order to quantify the extent of such differences.

Acknowledgements

We thank Adam D’Angelo and Facebook for providing the data used in this study. We also acknowledge Sandra González-Bailón and Erik Kelsic for useful discussions. We thank Christina Frost for developing some of the graph visualization code that we used (available at http://netwiki.amath.unc.edu/VisComms). ALT was funded by the NSF through the UNC AGEP (NSF HRD-0450099) and by the UNC ECHO program. PJM was funded by the NSF (DMS-0645369) and the UNC ECHO program. MAP acknowledges a research award (#220020177) from the James S. McDonnell Foundation.

Refer to caption

Figure 1: Largest connected component of the student-only subset of the Reed College Facebook network. (We used a Fruchterman and Reingold [1991] visualization.) Different node shapes and gray scale indicate different class years (gray circles denote users who did not identify an affiliation), and the edges are randomly shaded for easy viewing. Clusters of nodes with the same grayscale/shape suggest that common class year has an important effect on the aggregate Facebook structure.

Refer to caption Refer to caption

Figure 2: [Color] (Left) Vizualization of community structure of the Reed College Student Facebook network shown in Figure 1. Node shapes and colors indicate class year (gray dots denote users who did not identify an affiliation), and the edges are randomly shaded for easy viewing. We place the communities using a Fruchterman and Reingold [1991] layout and use a Kamada and Kawai [1989] layout to position the nodes within communities [Traud et al., 2009]. (Right) The same network layout but with each community depicted as a pie. Larger pies represent communities with larger numbers of nodes. Darker edges indicate the presence of more connections between the corresponding communities.

Refer to caption Refer to caption

Refer to caption Refer to caption

Figure 3: Box plots (indicating median, quartiles, extent, and outliers of the distribution) of the logistic regression nodematch coefficients for the 16 smallest institutions in the data for the model described in the main text. We plot the θedgessubscript𝜃edges-\theta_{\mathrm{edges}} values to present results with greater resolution. We separately present our results for the Full, Student, Female, and Male networks.

Refer to caption Refer to caption

Refer to caption Refer to caption

Figure 4: Box plots (indicating median, quartiles, extent, and outliers of the distribution) of the exponential random graph model coefficients described in the main text for the 16 smallest institutions in the data. We plot the θedgessubscript𝜃edges-\theta_{\mathrm{edges}} values to present results with greater resolution. We separately present our results for the Full, Student, Female, and Male networks.
Refer to caption
Refer to caption
Figure 5: [Color online] (Upper Left) Social organization tetrahedron for the community structures of the Full component (largest connected component) of the networks for each of the 100 institutions. Lighter disks indicate an organization that is based more predominantly on class year. See the main text for a description of this figure. (Lower Right) Magnification near the Year vertex. The legend illustrates the disk size as a function of the maximum distance d𝑑d between the 6 different partitions of the network. Most cases (88 out of 100 institutions) have d<.2𝑑.2d<.2.
Refer to caption
Refer to caption
Figure 6: [Color online] (Upper Left) Social organization tetrahedron for the community structures of the Student component of the networks for each of the 100 institutions. Lighter disks indicate an organization that is based more predominantly on class year. See the main text for a description of this figure. (Lower Right) Magnification near the Year vertex. As in Figure 5, the disk sizes correspond to the maximum distances between partitions.
Refer to caption
Refer to caption
Figure 7: [Color online] (Upper Left) Social organization tetrahedron for the community structures of the Female component of the networks for each of the 100 institutions. Lighter disks indicate an organization that is based more predominantly on class year. See the main text for a description of this figure. (Lower Right) Magnification near the Year vertex. As in the two previous figures, the disk sizes indicate the maximum distances between partitions.
Refer to caption
Refer to caption
Figure 8: [Color online] (Upper Left) Social organization tetrahedron for the community structures of the Male component of the networks for each of the 100 institutions. Lighter disks indicate an organization that is based more predominantly on class year. See the main text for a description of this figure. (Lower Right) Magnification near the Year vertex. As in the three previous figures, disk size indicates the maximum distance between partitions. We note that there are more d>.2𝑑.2d>.2 cases here than in the previous figures, which illustrates the greater variability in the relative positions of the z𝑧z-scores in the different Male networks than was the case for the Full, Student, and Female networks.

Appendix A Tables

In Table LABEL:tab:CharTable, we give for each of the 100 institutions the numbers of nodes and edges for each of the Facebook networks (and subsets thereof) that we have investigated. In Table LABEL:tab:AssortTable, we give the assortativity values for each of the networks. For each institution, we calculate assortativity values for Gender only for the Full and Student network subsets. We calculate Major, Residence, Year, and High School assortativity values for each of the four network subsets (Full, Student, Female, and Male).

Recall that we studied regression models for the 16 institutions with the smallest Facebook networks. In Table LABEL:tab:LogOdds1, we report the results of a logistic regression model with edge and nodematch terms. (All coefficients differ from zero with p𝑝p-values less than 1×1041superscript1041\times 10^{-4}.) In Table LABEL:tab:ZTable, we similarly report the results of an ERGM that supplements the logistic regression model with triangle terms. (Again, all resulting model coefficients differ from zero with a p𝑝p-value of less than 1×1041superscript1041\times 10^{-4}.)

In Table LABEL:tab:ZTable, we report the maximum z𝑧z-score for each demographic category that we obtained from the 6 different community detection partitions (described in the text) of each Facebook network (and their subsets) compared to categorical partitions based on each of Major, Residence, Year, and High School. We divide the networks in this table into five sections: (1) networks for which the High School category gives the highest z𝑧z-score; (2) networks for which the Residence category gives the highest z𝑧z-score; (3) networks for which Year gives the highest z𝑧z-score and High School gives the second highest; (4) networks for which Year gives the highest z𝑧z-score and Major gives the second highest; and (5) networks for which Year gives the highest z𝑧z-score and Residence gives the second highest.

Table 1: Characteristics for each of the networks and subnetworks: institution name, the identifying number given by Facebook, number of nodes in each network and subnetwork, and the number of edges in each network and subnetwork.
Institution Number Nodes (Full, Student, Female, Male) Edges (Full, Student, Female, Male)
Harvard 111 (15086,7425,5865,6850)15086742558656850(15086,7425,5865,6850) (824595,404415,173639,187742)824595404415173639187742(824595,404415,173639,187742)
Columbia 222 (11706,8057,5864,4209)11706805758644209(11706,8057,5864,4209) (444295,296971,135234,76037)44429529697113523476037(444295,296971,135234,76037)
Stanford 333 (11586,7183,4562,5501)11586718345625501(11586,7183,4562,5501) (568309,345561,132904,135932)568309345561132904135932(568309,345561,132904,135932)
Yale 444 (8561,5405,3572,3891)8561540535723891(8561,5405,3572,3891) (405440,258886,85133,95992)4054402588868513395992(405440,258886,85133,95992)
Cornell 555 (18621,12843,8028,8538)186211284380288538(18621,12843,8028,8538) (790753,511386,203303,171118)790753511386203303171118(790753,511386,203303,171118)
Dartmouth 666 (7677,4705,3052,3417)7677470530523417(7677,4705,3052,3417) (304065,176665,68675,70858)3040651766656867570858(304065,176665,68675,70858)
UPenn 777 (14888,10106,6405,6625)148881010664056625(14888,10106,6405,6625) (686485,446037,172277,150449)686485446037172277150449(686485,446037,172277,150449)
MIT 888 (6402,4283,2298,3359)6402428322983359(6402,4283,2298,3359) (251230,158838,58906,70094)2512301588385890670094(251230,158838,58906,70094)
NYU 999 (21623,17039,11723,7822)2162317039117237822(21623,17039,11723,7822) (715673,542431,211226,118898)715673542431211226118898(715673,542431,211226,118898)
BU 101010 (19666,15391,10914,7124)1966615391109147124(19666,15391,10914,7124) (637509,486545,207332,96593)63750948654520733296593(637509,486545,207332,96593)
Brown 111111 (8586,6038,3914,3657)8586603839143657(8586,6038,3914,3657) (384519,245521,92083,74005)3845192455219208374005(384519,245521,92083,74005)
Princeton 121212 (6575,4496,2701,3095)6575449627013095(6575,4496,2701,3095) (293307,190257,69195,64679)2933071902576919564679(293307,190257,69195,64679)
Berkeley 131313 (22900,18376,10848,9694)2290018376108489694(22900,18376,10848,9694) (852419,630929,234714,161454)852419630929234714161454(852419,630929,234714,161454)
Duke 141414 (9885,6681,4280,4577)9885668142804577(9885,6681,4280,4577) (506437,343382,134610,114931)506437343382134610114931(506437,343382,134610,114931)
Georgetown 151515 (9388,6365,4379,3937)9388636543793937(9388,6365,4379,3937) (425619,272625,102398,82406)42561927262510239882406(425619,272625,102398,82406)
UVA 161616 (17178,12453,8327,7182)171781245383277182(17178,12453,8327,7182) (789308,536625,243621,148532)789308536625243621148532(789308,536625,243621,148532)
BC 171717 (11498,8684,5565,4999)11498868455654999(11498,8684,5565,4999) (486961,345943,126788,95907)48696134594312678895907(486961,345943,126788,95907)
Tufts 181818 (6672,4892,3197,2818)6672489231972818(6672,4892,3197,2818) (249722,168309,70154,47561)2497221683097015447561(249722,168309,70154,47561)
Northeastern 191919 (13868,12133,6667,6050)138681213366676050(13868,12133,6667,6050) (381920,323478,102143,71331)38192032347810214371331(381920,323478,102143,71331)
U Illinios 202020 (30795,25385,13899,14663)30795253851389914663(30795,25385,13899,14663) (1264421,1000965,375286,276147)12644211000965375286276147(1264421,1000965,375286,276147)
UF 212121 (35111,27343,17945,14777)35111273431794514777(35111,27343,17945,14777) (1465654,1075152,483889,265983)14656541075152483889265983(1465654,1075152,483889,265983)
Wellesley 222222 (2970,2207,2653,22)29702207265322(2970,2207,2653,22) (94899,63727,78002,120)948996372778002120(94899,63727,78002,120)
Michigan 232323 (30106,23164,13846,13473)30106231641384613473(30106,23164,13846,13473) (1176489,848003,328382,246890)1176489848003328382246890(1176489,848003,328382,246890)
MSU 242424 (32361,26786,16635,13193)32361267861663513193(32361,26786,16635,13193) (1118767,898385,328898,192714)1118767898385328898192714(1118767,898385,328898,192714)
Northwestern 252525 (10537,7730,4948,4591)10537773049484591(10537,7730,4948,4591) (488318,349543,145552,96843)48831834954314555296843(488318,349543,145552,96843)
UCLA 262626 (20453,16571,10446,8029)2045316571104468029(20453,16571,10446,8029) (747604,577811,228164,128975)747604577811228164128975(747604,577811,228164,128975)
Emory 272727 (7449,5781,3851,2926)7449578138512926(7449,5781,3851,2926) (330008,244456,111924,55536)33000824445611192455536(330008,244456,111924,55536)
UNC 282828 (18158,14217,9616,6996)181581421796166996(18158,14217,9616,6996) (766796,570192,240130,131304)766796570192240130131304(766796,570192,240130,131304)
Tulane 292929 (7740,5901,3741,3337)7740590137413337(7740,5901,3741,3337) (283912,204485,92290,51763)2839122044859229051763(283912,204485,92290,51763)
UChicago 303030 (6561,4414,2791,2955)6561441427912955(6561,4414,2791,2955) (208088,132259,48371,46236)2080881322594837146236(208088,132259,48371,46236)
Rice 313131 (4083,2895,1800,1973)4083289518001973(4083,2895,1800,1973) (184826,121648,43119,45274)1848261216484311945274(184826,121648,43119,45274)
WashU 323232 (7730,5737,3658,3441)7730573736583441(7730,5737,3658,3441) (367526,262403,106564,76825)36752626240310656476825(367526,262403,106564,76825)
UC 333333 (16800,14702,8533,6853)168001470285336853(16800,14702,8533,6853) (522141,431035,154626,92905)52214143103515462692905(522141,431035,154626,92905)
UCSD 343434 (14936,13015,7430,6187)149361301574306187(14936,13015,7430,6187) (443215,368225,129064,83237)44321536822512906483237(443215,368225,129064,83237)
USC 353535 (17440,13514,7962,7858)174401351479627858(17440,13514,7962,7858) (801851,585374,232975,163575)801851585374232975163575(801851,585374,232975,163575)
Caltech 363636 (762,543,217,459)762543217459(762,543,217,459) (16651,11508,2349,6266)166511150823496266(16651,11508,2349,6266)
UCSB 373737 (14917,12658,7851,5850)149171265878515850(14917,12658,7851,5850) (482215,389090,154411,74414)48221538909015441174414(482215,389090,154411,74414)
Rochester 383838 (4561,3674,2040,2190)4561367420402190(4561,3674,2040,2190) (161403,120921,42081,37381)1614031209214208137381(161403,120921,42081,37381)
Bucknell 393939 (3824,3082,1929,1632)3824308219291632(3824,3082,1929,1632) (158863,121538,53049,28053)1588631215385304928053(158863,121538,53049,28053)
Williams 404040 (2788,2029,1315,1204)2788202913151204(2788,2029,1315,1204) (112985,76797,27967,24866)112985767972796724866(112985,76797,27967,24866)
Amherst 414141 (2235,1643,1009,1012)2235164310091012(2235,1643,1009,1012) (90954,62252,22374,19398)90954622522237419398(90954,62252,22374,19398)
Swarthmore 424242 (1657,1257,766,744)16571257766744(1657,1257,766,744) (61049,41869,14968,13689)61049418691496813689(61049,41869,14968,13689)
Wesleyan 434343 (3591,2736,1671,1487)3591273616711487(3591,2736,1671,1487) (138034,98758,35448,24262)138034987583544824262(138034,98758,35448,24262)
Oberlin 444444 (2920,2364,1471,1139)2920236414711139(2920,2364,1471,1139) (89912,64203,24174,15464)89912642032417415464(89912,64203,24174,15464)
Middlebury 454545 (3069,2363,1477,1293)3069236314771293(3069,2363,1477,1293) (124607,85848,32059,24577)124607858483205924577(124607,85848,32059,24577)
Hamilton 464646 (2312,1831,1128,989)231218311128989(2312,1831,1128,989) (96393,70744,27068,19901)96393707442706819901(96393,70744,27068,19901)
Bowdoin 474747 (2250,1734,1043,993)225017341043993(2250,1734,1043,993) (84386,61309,20931,17437)84386613092093117437(84386,61309,20931,17437)
Vanderbilt 484848 (8063,5849,3798,3530)8063584937983530(8063,5849,3798,3530) (427829,304350,136857,81976)42782930435013685781976(427829,304350,136857,81976)
Carnegie 494949 (6621,4973,2399,3594)6621497323993594(6621,4973,2399,3594) (249959,172299,56588,67771)2499591722995658867771(249959,172299,56588,67771)
UGA 505050 (24380,19381,13350,9234)2438019381133509234(24380,19381,13350,9234) (1174051,893735,436380,177771)1174051893735436380177771(1174051,893735,436380,177771)
USF 515151 (13367,12285,7229,5062)133671228572295062(13367,12285,7229,5062) (321209,284813,93302,49271)3212092848139330249271(321209,284813,93302,49271)
UCF 525252 (14936,13735,7796,6404)149361373577966404(14936,13735,7796,6404) (428987,373759,137897,77479)42898737375913789777479(428987,373759,137897,77479)
FSU 535353 (27731,22949,15031,10885)27731229491503110885(27731,22949,15031,10885) (1034799,799849,347239,167004)1034799799849347239167004(1034799,799849,347239,167004)
GWU 545454 (12164,9261,6235,4807)12164926162354807(12164,9261,6235,4807) (469511,347323,131028,88642)46951134732313102888642(469511,347323,131028,88642)
Johns Hopkins 555555 (5157,3930,2099,2546)5157393020992546(5157,3930,2099,2546) (186572,136555,48265,44544)1865721365554826544544(186572,136555,48265,44544)
Syracuse 565656 (13640,10756,7043,5489)136401075670435489(13640,10756,7043,5489) (543975,403646,181071,84908)54397540364618107184908(543975,403646,181071,84908)
Notre Dame 575757 (12149,9035,6018,5145)12149903560185145(12149,9035,6018,5145) (541336,386160,158766,118013)541336386160158766118013(541336,386160,158766,118013)
Maryland 585858 (20829,17651,9541,9611)208291765195419611(20829,17651,9541,9611) (744832,595877,204673,156394)744832595877204673156394(744832,595877,204673,156394)
Maine 595959 (9065,8031,4583,3714)9065803145833714(9065,8031,4583,3714) (243245,196814,64780,45544)2432451968146478045544(243245,196814,64780,45544)
Smith 606060 (2970,2322,2596,18)29702322259618(2970,2322,2596,18) (97133,64949,75830,24)97133649497583024(97133,64949,75830,24)
UC 616161 (13736,11904,6394,5919)137361190463945919(13736,11904,6394,5919) (442169,350186,112232,87103)44216935018611223287103(442169,350186,112232,87103)
Villanova 626262 (7755,6022,3680,3260)7755602236803260(7755,6022,3680,3260) (314980,248763,100132,54946)31498024876310013254946(314980,248763,100132,54946)
Virginia 636363 (21319,17509,8584,11053)2131917509858411053(21319,17509,8584,11053) (698175,541632,174033,162409)698175541632174033162409(698175,541632,174033,162409)
UC 646464 (6810,6253,3210,2918)6810625332102918(6810,6253,3210,2918) (155320,137662,38981,31333)1553201376623898131333(155320,137662,38981,31333)
Cal 656565 (11243,10093,4903,5581)112431009349035581(11243,10093,4903,5581) (351356,300118,88615,78266)3513563001188861578266(351356,300118,88615,78266)
Mississippi 666666 (10519,8698,5193,4535)10519869851934535(10519,8698,5193,4535) (610910,478908,204081,107035)610910478908204081107035(610910,478908,204081,107035)
Michigan 676767 (3745,3241,921,2578)374532419212578(3745,3241,921,2578) (81901,63490,11813,31325)81901634901181331325(81901,63490,11813,31325)
UCSC 686868 (8979,8022,4653,3586)8979802246533586(8979,8022,4653,3586) (224578,194833,66048,36442)2245781948336604836442(224578,194833,66048,36442)
Indiana 696969 (29732,24401,14768,12547)29732244011476812547(29732,24401,14768,12547) (1305757,1029487,380700,229919)13057571029487380700229919(1305757,1029487,380700,229919)
Vermont 707070 (7322,6397,3942,2675)7322639739422675(7322,6397,3942,2675) (191220,159707,63460,25651)1912201597076346025651(191220,159707,63460,25651)
Auburn 717171 (18448,15699,9034,8227)184481569990348227(18448,15699,9034,8227) (973918,774952,349929,154251)973918774952349929154251(973918,774952,349929,154251)
USFCA 727272 (2672,2410,1681,763)267224101681763(2672,2410,1681,763) (65244,57006,26725,7213)6524457006267257213(65244,57006,26725,7213)
Wake 737373 (5366,4060,2525,2422)5366406025252422(5366,4060,2525,2422) (279186,207772,87714,54047)2791862077728771454047(279186,207772,87714,54047)
Santa 747474 (3578,3011,1902,1471)3578301119021471(3578,3011,1902,1471) (151747,123252,48015,25950)1517471232524801525950(151747,123252,48015,25950)
American 757575 (6370,5142,3641,2219)6370514236412219(6370,5142,3641,2219) (217654,168330,74317,33897)2176541683307431733897(217654,168330,74317,33897)
Haverford 767676 (1446,1125,727,616)14461125727616(1446,1125,727,616) (59589,46373,17287,11671)59589463731728711671(59589,46373,17287,11671)
Williams 777777 (6472,5068,3284,2621)6472506832842621(6472,5068,3284,2621) (266378,195605,82338,50639)2663781956058233850639(266378,195605,82338,50639)
MU 787878 (15425,13377,8016,6341)154251337780166341(15425,13377,8016,6341) (649441,532098,227362,114203)649441532098227362114203(649441,532098,227362,114203)
JMU 797979 (14070,12160,8427,4762)140701216084274762(14070,12160,8427,4762) (485564,400307,182959,57190)48556440030718295957190(485564,400307,182959,57190)
Texas 808080 (31538,25867,15571,13541)31538258671557113541(31538,25867,15571,13541) (1219639,952918,398776,219953)1219639952918398776219953(1219639,952918,398776,219953)
Simmons 818181 (1510,1302,1399,0)1510130213990(1510,1302,1399,0) (32984,27885,30177,0)3298427885301770(32984,27885,30177,0)
Bingham 828282 (10001,8222,4590,4614)10001822245904614(10001,8222,4590,4614) (362892,270202,89912,75552)3628922702028991275552(362892,270202,89912,75552)
Temple 838383 (13653,12404,7112,5262)136531240471125262(13653,12404,7112,5262) (360774,316028,99928,55747)3607743160289992855747(360774,316028,99928,55747)
Texas 848484 (36364,30182,17556,0)3636430182175560(36364,30182,17556,0) (1590651,1209367,459165,0)159065112093674591650(1590651,1209367,459165,0)
Vassar 858585 (3068,2353,1688,1084)3068235316881084(3068,2353,1688,1084) (119161,86464,36200,17250)119161864643620017250(119161,86464,36200,17250)
Pepperdine 868686 (3440,2663,1858,1345)3440266318581345(3440,2663,1858,1345) (152003,113352,52811,25144)1520031133525281125144(152003,113352,52811,25144)
Wisconsin 878787 (23831,19598,12059,9840)2383119598120599840(23831,19598,12059,9840) (835946,649051,243289,157022)835946649051243289157022(835946,649051,243289,157022)
Colgate 888888 (3482,2702,1691,1471)3482270216911471(3482,2702,1691,1471) (155043,110916,45592,27734)1550431109164559227734(155043,110916,45592,27734)
Rutgers 898989 (24568,20636,11803,10662)24568206361180310662(24568,20636,11803,10662) (784596,613950,209893,160699)784596613950209893160699(784596,613950,209893,160699)
Howard 909090 (4047,3478,2531,1302)4047347825311302(4047,3478,2531,1302) (204850,172360,63446,28308)2048501723606344628308(204850,172360,63446,28308)
UConn 919191 (17206,14746,8443,7430)172061474684437430(17206,14746,8443,7430) (604867,477272,164460,114877)604867477272164460114877(604867,477272,164460,114877)
UMass 929292 (16502,14183,8040,7148)165021418380407148(16502,14183,8040,7148) (519376,415863,138884,86903)51937641586313888486903(519376,415863,138884,86903)
Baylor 939393 (12799,10287,7025,4929)127991028770254929(12799,10287,7025,4929) (679815,514816,241420,109488)679815514816241420109488(679815,514816,241420,109488)
Penn 949494 (41536,35753,18179,20013)41536357531817920013(41536,35753,18179,20013) (1362220,1080608,330980,306922)13622201080608330980306922(1362220,1080608,330980,306922)
Tennessee 959595 (16977,14303,8342,7408)169771430383427408(16977,14303,8342,7408) (770658,611236,242648,138326)770658611236242648138326(770658,611236,242648,138326)
Lehigh 969696 (5073,4144,2060,2645)5073414420602645(5073,4144,2060,2645) (198346,153623,52837,43734)1983461536235283743734(198346,153623,52837,43734)
Oklahoma 979797 (17420,14586,8164,7870)174201458681647870(17420,14586,8164,7870) (892524,709698,284279,170890)892524709698284279170890(892524,709698,284279,170890)
Reed 989898 (962,803,496,348)962803496348(962,803,496,348) (18812,14133,5334,2984)188121413353342984(18812,14133,5334,2984)
Brandeis 999999 (3887,3003,1981,1511)3887300319811511(3887,3003,1981,1511) (137561,98346,38842,23790)137561983463884223790(137561,98346,38842,23790)
Trinity 100100100 (2613,2065,1222,1139)2613206512221139(2613,2065,1222,1139) (111996,80946,29608,21042)111996809462960821042(111996,80946,29608,21042)
Table 2: Assortativity values for each category for each of the 4 networks (Full, Student, Female, and Male) for each of the 100 institutions. We only calculate assortativity by Gender for the Full and Student networks. (We leave blank spots in the corresponding table entries for the Male and Female networks.)
Institution No. Full Student Female Male
Harvard 111
Gender 0.0581440.0581440.058144 0.0491780.0491780.049178
Major 0.0562930.0562930.056293 0.0466590.0466590.046659 0.0518520.0518520.051852 0.0640640.0640640.064064
Residence 0.146790.146790.14679 0.119510.119510.11951 0.138030.138030.13803 0.154310.154310.15431
Year 0.479810.479810.47981 0.607230.607230.60723 0.48710.48710.4871 0.440350.440350.44035
High School 0.0231320.0231320.023132 0.024190.024190.02419 0.0242470.0242470.024247 0.0264730.0264730.026473
Columbia 222
Gender 0.0872830.0872830.087283 0.0858470.0858470.085847
Major 0.0452570.0452570.045257 0.0361120.0361120.036112 0.0437280.0437280.043728 0.060240.060240.06024
Residence 0.132710.132710.13271 0.135510.135510.13551 0.16250.16250.1625 0.142490.142490.14249
Year 0.513480.513480.51348 0.60020.60020.6002 0.553030.553030.55303 0.477430.477430.47743
High School 0.0292590.0292590.029259 0.0300610.0300610.030061 0.032540.032540.03254 0.0285010.0285010.028501
Stanford 333
Gender 0.0565830.0565830.056583 0.0495450.0495450.049545
Major 0.0485740.0485740.048574 0.0339010.0339010.033901 0.0422210.0422210.042221 0.0580830.0580830.058083
Residence 0.120670.120670.12067 0.108870.108870.10887 0.14990.14990.1499 0.165310.165310.16531
Year 0.444560.444560.44456 0.544560.544560.54456 0.439780.439780.43978 0.406320.406320.40632
High School 0.0214720.0214720.021472 0.0238510.0238510.023851 0.0229060.0229060.022906 0.0226490.0226490.022649
Yale 444
Gender 0.0367040.0367040.036704 0.0311440.0311440.031144
Major 0.0417030.0417030.041703 0.0466590.0466590.046659 0.0412280.0412280.041228 0.0448290.0448290.044829
Residence 0.267270.267270.26727 0.119510.119510.11951 0.272040.272040.27204 0.265670.265670.26567
Year 0.483080.483080.48308 0.607230.607230.60723 0.522420.522420.52242 0.434170.434170.43417
High School 0.0182690.0182690.018269 0.024190.024190.02419 0.0197050.0197050.019705 0.0202950.0202950.020295
Cornell 555
Gender 0.0907250.0907250.090725 0.08790.08790.0879
Major 0.103670.103670.10367 0.0957030.0957030.095703 0.105030.105030.10503 0.102180.102180.10218
Residence 0.254260.254260.25426 0.238190.238190.23819 0.351240.351240.35124 0.344710.344710.34471
Year 0.475040.475040.47504 0.565880.565880.56588 0.474340.474340.47434 0.428280.428280.42828
High School 0.0331640.0331640.033164 0.035430.035430.03543 0.0295790.0295790.029579 0.0370210.0370210.037021
Dartmouth 666
Gender 0.102840.102840.10284 0.0627930.0627930.062793
Major 0.037290.037290.03729 0.0292810.0292810.029281 0.0379230.0379230.037923 0.0398820.0398820.039882
Residence 0.177730.177730.17773 0.125510.125510.12551 0.247330.247330.24733 0.283360.283360.28336
Year 0.490140.490140.49014 0.610520.610520.61052 0.537870.537870.53787 0.413580.413580.41358
High School 0.0143660.0143660.014366 0.0152130.0152130.015213 0.0152850.0152850.015285 0.0147070.0147070.014707
UPenn 777
Gender 0.0905470.0905470.090547 0.0822360.0822360.082236
Major 0.0577830.0577830.057783 0.0528690.0528690.052869 0.0598280.0598280.059828 0.0627280.0627280.062728
Residence 0.262990.262990.26299 0.235190.235190.23519 0.344730.344730.34473 0.348660.348660.34866
Year 0.495670.495670.49567 0.585930.585930.58593 0.518310.518310.51831 0.417140.417140.41714
High School 0.0317710.0317710.031771 0.0344540.0344540.034454 0.0320070.0320070.032007 0.0348440.0348440.034844
MIT 888
Gender 0.125470.125470.12547 0.121230.121230.12123
Major 0.0644280.0644280.064428 0.0503360.0503360.050336 0.0551010.0551010.055101 0.0673870.0673870.067387
Residence 0.228790.228790.22879 0.218940.218940.21894 0.22890.22890.2289 0.342620.342620.34262
Year 0.361620.361620.36162 0.440110.440110.44011 0.389540.389540.38954 0.285380.285380.28538
High School 0.013760.013760.01376 0.014680.014680.01468 0.0100540.0100540.010054 0.0160560.0160560.016056
NYU 999
Gender 0.00313710.0031371-0.0031371 0.00757260.0075726-0.0075726
Major 0.12680.12680.1268 0.123320.123320.12332 0.134440.134440.13444 0.146570.146570.14657
Residence 0.180130.180130.18013 0.182310.182310.18231 0.205980.205980.20598 0.198670.198670.19867
Year 0.557740.557740.55774 0.633390.633390.63339 0.60410.60410.6041 0.501020.501020.50102
High School 0.0408480.0408480.040848 0.0428420.0428420.042842 0.0472280.0472280.047228 0.0437820.0437820.043782
BU 101010
Gender 0.0205280.0205280.020528 0.00851490.00851490.0085149
Major 0.0752680.0752680.075268 0.0674280.0674280.067428 0.0884440.0884440.088444 0.0737320.0737320.073732
Residence 0.165270.165270.16527 0.167020.167020.16702 0.181780.181780.18178 0.166310.166310.16631
Year 0.538350.538350.53835 0.601010.601010.60101 0.558820.558820.55882 0.498610.498610.49861
High School 0.0332290.0332290.033229 0.0356440.0356440.035644 0.0354560.0354560.035456 0.0377170.0377170.037717
Brown 111111
Gender 0.0283440.0283440.028344 0.0228710.0228710.022871
Major 0.0376060.0376060.037606 0.0317110.0317110.031711 0.0361970.0361970.036197 0.0491590.0491590.049159
Residence 0.140050.140050.14005 0.119670.119670.11967 0.157280.157280.15728 0.153370.153370.15337
Year 0.497140.497140.49714 0.58050.58050.5805 0.533510.533510.53351 0.442480.442480.44248
High School 0.0243640.0243640.024364 0.0264670.0264670.026467 0.0263640.0263640.026364 0.0250490.0250490.025049
Princeton 121212
Gender 0.0650040.0650040.065004 0.0568890.0568890.056889
Major 0.0473990.0473990.047399 0.0415280.0415280.041528 0.0478980.0478980.047898 0.0510680.0510680.051068
Residence 0.0872180.0872180.087218 0.087360.087360.08736 0.0947540.0947540.094754 0.0967220.0967220.096722
Year 0.494720.494720.49472 0.580050.580050.58005 0.50550.50550.5055 0.471550.471550.47155
High School 0.0197080.0197080.019708 0.0217430.0217430.021743 0.0181080.0181080.018108 0.0242820.0242820.024282
Berkeley 131313
Gender 0.051320.051320.05132 0.0495430.0495430.049543
Major 0.0675160.0675160.067516 0.0608430.0608430.060843 0.0625820.0625820.062582 0.0815180.0815180.081518
Residence 0.221880.221880.22188 0.221880.221880.22188 0.284920.284920.28492 0.245910.245910.24591
Year 0.388810.388810.38881 0.446050.446050.44605 0.413940.413940.41394 0.357340.357340.35734
High School 0.0938540.0938540.093854 0.105110.105110.10511 0.094040.094040.09404 0.103990.103990.10399
Duke 141414
Gender 0.101420.101420.10142 0.094670.094670.09467
Major 0.0444880.0444880.044488 0.0388520.0388520.038852 0.042690.042690.04269 0.0477290.0477290.047729
Residence 0.157590.157590.15759 0.144440.144440.14444 0.202030.202030.20203 0.226140.226140.22614
Year 0.504380.504380.50438 0.596170.596170.59617 0.519130.519130.51913 0.451590.451590.45159
High School 0.0178410.0178410.017841 0.0187650.0187650.018765 0.01730.01730.0173 0.018790.018790.01879
Georgetown 151515
Gender 0.01450.01450.0145 0.01440.01440.0144
Major 0.0438880.0438880.043888 0.0392550.0392550.039255 0.0517450.0517450.051745 0.0490580.0490580.049058
Residence 0.172520.172520.17252 0.162170.162170.16217 0.185180.185180.18518 0.181870.181870.18187
Year 0.557530.557530.55753 0.631320.631320.63132 0.610520.610520.61052 0.504920.504920.50492
High School 0.0237260.0237260.023726 0.0252720.0252720.025272 0.0279820.0279820.027982 0.0335920.0335920.033592
UVA 161616
Gender 0.096710.096710.09671 0.0920750.0920750.092075
Major 0.0528320.0528320.052832 0.0444820.0444820.044482 0.053710.053710.05371 0.0545980.0545980.054598
Residence 0.247360.247360.24736 0.229870.229870.22987 0.391020.391020.39102 0.29140.29140.2914
Year 0.457020.457020.45702 0.540550.540550.54055 0.47040.47040.4704 0.417520.417520.41752
High School 0.0803880.0803880.080388 0.0908830.0908830.090883 0.077250.077250.07725 0.0854650.0854650.085465
BC 171717
Gender 0.0144880.0144880.014488 0.0182410.0182410.018241
Major 0.0420430.0420430.042043 0.0393470.0393470.039347 0.0569710.0569710.056971 0.0382930.0382930.038293
Residence 0.139480.139480.13948 0.135850.135850.13585 0.188350.188350.18835 0.160840.160840.16084
Year 0.652840.652840.65284 0.71090.71090.7109 0.694390.694390.69439 0.615620.615620.61562
High School 0.031040.031040.03104 0.0330570.0330570.033057 0.0346070.0346070.034607 0.0490440.0490440.049044
Tufts 181818
Gender 0.0627890.0627890.062789 0.0581080.0581080.058108
Major 0.0419480.0419480.041948 0.0368810.0368810.036881 0.0429220.0429220.042922 0.0409250.0409250.040925
Residence 0.128830.128830.12883 0.13010.13010.1301 0.146310.146310.14631 0.142880.142880.14288
Year 0.499570.499570.49957 0.56240.56240.5624 0.524210.524210.52421 0.460430.460430.46043
High School 0.0186980.0186980.018698 0.0195950.0195950.019595 0.0172440.0172440.017244 0.0223290.0223290.022329
Northeastern 191919
Gender 0.00607780.0060778-0.0060778 0.00908920.0090892-0.0090892
Major 0.110080.110080.11008 0.111480.111480.11148 0.154080.154080.15408 0.119220.119220.11922
Residence 0.191650.191650.19165 0.189730.189730.18973 0.244070.244070.24407 0.203640.203640.20364
Year 0.453010.453010.45301 0.492850.492850.49285 0.453070.453070.45307 0.469860.469860.46986
High School 0.040640.040640.04064 0.041980.041980.04198 0.0392240.0392240.039224 0.0519350.0519350.051935
UIllinios 202020
Gender 0.112740.112740.11274 0.11070.11070.1107
Major 0.0565790.0565790.056579 0.0494910.0494910.049491 0.0561170.0561170.056117 0.0638560.0638560.063856
Residence 0.308050.308050.30805 0.296990.296990.29699 0.461060.461060.46106 0.385290.385290.38529
Year 0.401050.401050.40105 0.447480.447480.44748 0.403910.403910.40391 0.360430.360430.36043
High School 0.170990.170990.17099 0.185710.185710.18571 0.159550.159550.15955 0.190050.190050.19005
UF 212121
Gender 0.0807150.0807150.080715 0.0868480.0868480.086848
Major 0.0488880.0488880.048888 0.0332660.0332660.033266 0.0511990.0511990.051199 0.0518940.0518940.051894
Residence 0.17220.17220.1722 0.164870.164870.16487 0.263090.263090.26309 0.249290.249290.24929
Year 0.330370.330370.33037 0.38050.38050.3805 0.335270.335270.33527 0.313260.313260.31326
High School 0.193960.193960.19396 0.212220.212220.21222 0.182860.182860.18286 0.199650.199650.19965
Wellesley 222222
Gender 0.246120.246120.24612 0.349840.349840.34984
Major 0.0365280.0365280.036528 0.0301810.0301810.030181 0.0363670.0363670.036367 00
Residence 0.124120.124120.12412 0.126570.126570.12657 0.129570.129570.12957 00
Year 0.427580.427580.42758 0.505290.505290.50529 0.435040.435040.43504 00
High School 0.0116280.0116280.011628 0.0118780.0118780.011878 0.011560.011560.01156 00
Michigan 232323
Gender 0.0752790.0752790.075279 0.0740230.0740230.074023
Major 0.0664960.0664960.066496 0.0585830.0585830.058583 0.0666270.0666270.066627 0.0743320.0743320.074332
Residence 0.247290.247290.24729 0.236080.236080.23608 0.342870.342870.34287 0.288860.288860.28886
Year 0.42870.42870.4287 0.48340.48340.4834 0.46140.46140.4614 0.37650.37650.3765
High School 0.13410.13410.1341 0.148670.148670.14867 0.137380.137380.13738 0.149460.149460.14946
MSU 242424
Gender 0.00621340.00621340.0062134 0.00263910.00263910.0026391
Major 0.0444830.0444830.044483 0.0359090.0359090.035909 0.0517640.0517640.051764 0.0484540.0484540.048454
Residence 0.202430.202430.20243 0.194870.194870.19487 0.265540.265540.26554 0.280350.280350.28035
Year 0.364380.364380.36438 0.396150.396150.39615 0.403680.403680.40368 0.329030.329030.32903
High School 0.211650.211650.21165 0.225660.225660.22566 0.227160.227160.22716 0.22910.22910.2291
Northwestern 252525
Gender 0.104590.104590.10459 0.0905280.0905280.090528
Major 0.0961230.0961230.096123 0.0923990.0923990.092399 0.0905610.0905610.090561 0.0960490.0960490.096049
Residence 0.253520.253520.25352 0.233840.233840.23384 0.343640.343640.34364 0.324760.324760.32476
Year 0.41480.41480.4148 0.480.480.48 0.427140.427140.42714 0.336970.336970.33697
High School 0.020890.020890.02089 0.0221520.0221520.022152 0.0195960.0195960.019596 0.0217290.0217290.021729
UCLA 262626
Gender 0.0304670.0304670.030467 0.0238940.0238940.023894
Major 0.0509950.0509950.050995 0.0464880.0464880.046488 0.05190.05190.0519 0.0569970.0569970.056997
Residence 0.231540.231540.23154 0.207950.207950.20795 0.316860.316860.31686 0.329160.329160.32916
Year 0.391280.391280.39128 0.445270.445270.44527 0.411890.411890.41189 0.337080.337080.33708
High School 0.0848650.0848650.084865 0.0916240.0916240.091624 0.0886250.0886250.088625 0.0898850.0898850.089885
Emory 272727
Gender 0.0924730.0924730.092473 0.0778710.0778710.077871
Major 0.0304050.0304050.030405 0.0262560.0262560.026256 0.0313410.0313410.031341 0.0289360.0289360.028936
Residence 0.220740.220740.22074 0.20510.20510.2051 0.281080.281080.28108 0.314220.314220.31422
Year 0.48040.48040.4804 0.547650.547650.54765 0.482750.482750.48275 0.428160.428160.42816
High School 0.0211190.0211190.021119 0.0220940.0220940.022094 0.0206820.0206820.020682 0.0209630.0209630.020963
UNC 282828
Gender 0.0598370.0598370.059837 0.0549770.0549770.054977
Major 0.0511470.0511470.051147 0.039490.039490.03949 0.0553630.0553630.055363 0.0521240.0521240.052124
Residence 0.202440.202440.20244 0.185470.185470.18547 0.298380.298380.29838 0.24590.24590.2459
Year 0.396410.396410.39641 0.440010.440010.44001 0.431880.431880.43188 0.329940.329940.32994
High School 0.134180.134180.13418 0.147740.147740.14774 0.141240.141240.14124 0.128720.128720.12872
Tulane 292929
Gender 0.100830.100830.10083 0.0897190.0897190.089719
Major 0.0525790.0525790.052579 0.0466830.0466830.046683 0.0427960.0427960.042796 0.0599480.0599480.059948
Residence 0.352960.352960.35296 0.313140.313140.31314 0.527090.527090.52709 0.452240.452240.45224
Year 0.439380.439380.43938 0.499690.499690.49969 0.444210.444210.44421 0.363710.363710.36371
High School 0.0206940.0206940.020694 0.0221120.0221120.022112 0.0179220.0179220.017922 0.0294770.0294770.029477
UChicago 303030
Gender 0.0458190.0458190.045819 0.023270.023270.02327
Major 0.0539210.0539210.053921 0.0426120.0426120.042612 0.0487410.0487410.048741 0.0631780.0631780.063178
Residence 0.29790.29790.2979 0.290650.290650.29065 0.342670.342670.34267 0.328580.328580.32858
Year 0.364930.364930.36493 0.443420.443420.44342 0.383160.383160.38316 0.323780.323780.32378
High School 0.0160780.0160780.016078 0.0170180.0170180.017018 0.0166290.0166290.016629 0.0169530.0169530.016953
Rice 313131
Gender 0.0300860.0300860.030086 0.0378580.0378580.037858
Major 0.0552250.0552250.055225 0.0535920.0535920.053592 0.0570520.0570520.057052 0.0614070.0614070.061407
Residence 0.484630.484630.48463 0.503730.503730.50373 0.483410.483410.48341 0.508870.508870.50887
Year 0.310440.310440.31044 0.366220.366220.36622 0.341530.341530.34153 0.286570.286570.28657
High School 0.016260.016260.01626 0.0174920.0174920.017492 0.016250.016250.01625 0.0169860.0169860.016986
WashU 323232
Gender 0.0939080.0939080.093908 0.0780410.0780410.078041
Major 0.0406880.0406880.040688 0.0362030.0362030.036203 0.0429830.0429830.042983 0.0382920.0382920.038292
Residence 0.166490.166490.16649 0.161530.161530.16153 0.164490.164490.16449 0.203080.203080.20308
Year 0.518580.518580.51858 0.600380.600380.60038 0.491020.491020.49102 0.468720.468720.46872
High School 0.0181060.0181060.018106 0.0195080.0195080.019508 0.016960.016960.01696 0.0198460.0198460.019846
UC 333333
Gender 0.0205050.0205050.020505 0.0171570.0171570.017157
Major 0.0393290.0393290.039329 0.0363440.0363440.036344 0.0416810.0416810.041681 0.0444660.0444660.044466
Residence 0.382420.382420.38242 0.361020.361020.36102 0.567320.567320.56732 0.480070.480070.48007
Year 0.454030.454030.45403 0.501430.501430.50143 0.464140.464140.46414 0.429920.429920.42992
High School 0.105140.105140.10514 0.113840.113840.11384 0.109540.109540.10954 0.123260.123260.12326
UCSD 343434
Gender 0.0304540.0304540.030454 0.0234720.0234720.023472
Major 0.0353690.0353690.035369 0.0311250.0311250.031125 0.0363810.0363810.036381 0.0400880.0400880.040088
Residence 0.348790.348790.34879 0.354740.354740.35474 0.398660.398660.39866 0.400030.400030.40003
Year 0.469070.469070.46907 0.524430.524430.52443 0.489740.489740.48974 0.430050.430050.43005
High School 0.0931350.0931350.093135 0.099450.099450.09945 0.0950860.0950860.095086 0.100910.100910.10091
USC 353535
Gender 0.0861280.0861280.086128 0.0828150.0828150.082815
Major 0.0895290.0895290.089529 0.0857230.0857230.085723 0.0854580.0854580.085458 0.0960260.0960260.096026
Residence 0.236640.236640.23664 0.224040.224040.22404 0.366910.366910.36691 0.310810.310810.31081
Year 0.380350.380350.38035 0.44210.44210.4421 0.373870.373870.37387 0.33780.33780.3378
High School 0.0477290.0477290.047729 0.0517940.0517940.051794 0.0433970.0433970.043397 0.0558510.0558510.055851
Caltech 363636
Gender 0.0539880.0539880.053988 0.0636520.0636520.063652
Major 0.0381810.0381810.038181 0.0321530.0321530.032153 0.0371910.0371910.037191 0.037990.037990.03799
Residence 0.448620.448620.44862 0.42610.42610.4261 0.397130.397130.39713 0.482190.482190.48219
Year 0.269410.269410.26941 0.324520.324520.32452 0.278210.278210.27821 0.263260.263260.26326
High School 0.00210830.00210830.0021083 0.00132580.00132580.0013258 0.00457460.0045746-0.0045746 0.00228290.00228290.0022829
UCSB 373737
Gender 0.00324210.0032421-0.0032421 0.00826360.0082636-0.0082636
Major 0.0430690.0430690.043069 0.0370630.0370630.037063 0.0420580.0420580.042058 0.0541370.0541370.054137
Residence 0.289770.289770.28977 0.277450.277450.27745 0.356180.356180.35618 0.398010.398010.39801
Year 0.457380.457380.45738 0.507610.507610.50761 0.455840.455840.45584 0.443180.443180.44318
High School 0.0629720.0629720.062972 0.0657160.0657160.065716 0.0664770.0664770.066477 0.0705050.0705050.070505
Rochester 383838
Gender 0.0758020.0758020.075802 0.0623840.0623840.062384
Major 0.0732740.0732740.073274 0.0753110.0753110.075311 0.0627190.0627190.062719 0.0879770.0879770.087977
Residence 0.260090.260090.26009 0.255730.255730.25573 0.298810.298810.29881 0.2980.2980.298
Year 0.434130.434130.43413 0.506580.506580.50658 0.438890.438890.43889 0.388510.388510.38851
High School 0.018630.018630.01863 0.0200220.0200220.020022 0.0190740.0190740.019074 0.0176750.0176750.017675
Bucknell 393939
Gender 0.116810.116810.11681 0.0892380.0892380.089238
Major 0.0497320.0497320.049732 0.0453760.0453760.045376 0.0420460.0420460.042046 0.06330.06330.0633
Residence 0.196560.196560.19656 0.193630.193630.19363 0.206970.206970.20697 0.248570.248570.24857
Year 0.528770.528770.52877 0.592160.592160.59216 0.528780.528780.52878 0.465840.465840.46584
High School 0.0116680.0116680.011668 0.0121640.0121640.012164 0.00967120.00967120.0096712 0.0119930.0119930.011993
Williams 404040
Gender 0.0706360.0706360.070636 0.0614340.0614340.061434
Major 0.0340380.0340380.034038 0.0314560.0314560.031456 0.0339240.0339240.033924 0.0384030.0384030.038403
Residence 0.125020.125020.12502 0.13270.13270.1327 0.137280.137280.13728 0.126530.126530.12653
Year 0.509610.509610.50961 0.595070.595070.59507 0.531980.531980.53198 0.455840.455840.45584
High School 0.0118620.0118620.011862 0.0123970.0123970.012397 0.0129150.0129150.012915 0.0117360.0117360.011736
Amherst 414141
Gender 0.0597620.0597620.059762 0.0648030.0648030.064803
Major 0.0324940.0324940.032494 0.0277420.0277420.027742 0.0246050.0246050.024605 0.039020.039020.03902
Residence 0.079390.079390.07939 0.0810670.0810670.081067 0.0936030.0936030.093603 0.0774280.0774280.077428
Year 0.464840.464840.46484 0.56330.56330.5633 0.50280.50280.5028 0.409880.409880.40988
High School 0.00965150.00965150.0096515 0.0103870.0103870.010387 0.00817540.00817540.0081754 0.0133110.0133110.013311
Swarthmore 424242
Gender 0.0662740.0662740.066274 0.0571450.0571450.057145
Major 0.0429280.0429280.042928 0.0359280.0359280.035928 0.0407750.0407750.040775 0.0543110.0543110.054311
Residence 0.11250.11250.1125 0.109380.109380.10938 0.120650.120650.12065 0.113010.113010.11301
Year 0.3710.3710.371 0.441680.441680.44168 0.416340.416340.41634 0.323370.323370.32337
High School 0.00321330.00321330.0032133 0.00335190.00335190.0033519 0.00262590.00262590.0026259 0.0014780.0014780.001478
Wesleyan 434343
Gender 0.0352480.0352480.035248 0.0294640.0294640.029464
Major 0.0521350.0521350.052135 0.0454780.0454780.045478 0.0462730.0462730.046273 0.0678170.0678170.067817
Residence 0.120990.120990.12099 0.127860.127860.12786 0.130570.130570.13057 0.135830.135830.13583
Year 0.467090.467090.46709 0.531160.531160.53116 0.495040.495040.49504 0.424670.424670.42467
High School 0.018140.018140.01814 0.0183840.0183840.018384 0.0178860.0178860.017886 0.0202640.0202640.020264
Oberlin 444444
Gender 0.0202510.0202510.020251 0.0195120.0195120.019512
Major 0.10920.10920.1092 0.105630.105630.10563 0.124930.124930.12493 0.10970.10970.1097
Residence 0.146280.146280.14628 0.150530.150530.15053 0.170020.170020.17002 0.136950.136950.13695
Year 0.335470.335470.33547 0.386210.386210.38621 0.369110.369110.36911 0.296320.296320.29632
High School 0.0119150.0119150.011915 0.0121020.0121020.012102 0.0127140.0127140.012714 0.0106690.0106690.010669
Middlebury 454545
Gender 0.0395290.0395290.039529 0.0428070.0428070.042807
Major 0.0381220.0381220.038122 0.0315080.0315080.031508 0.041390.041390.04139 0.035410.035410.03541
Residence 0.18090.18090.1809 0.189980.189980.18998 0.19930.19930.1993 0.181880.181880.18188
Year 0.512950.512950.51295 0.580570.580570.58057 0.545980.545980.54598 0.474780.474780.47478
High School 0.0157590.0157590.015759 0.0161640.0161640.016164 0.015970.015970.01597 0.0181340.0181340.018134
Hamilton 464646
Gender 0.0917620.0917620.091762 0.082250.082250.08225
Major 0.03280.03280.0328 0.0304570.0304570.030457 0.032150.032150.03215 0.0301410.0301410.030141
Residence 0.111610.111610.11161 0.113380.113380.11338 0.12980.12980.1298 0.120340.120340.12034
Year 0.451660.451660.45166 0.540880.540880.54088 0.493970.493970.49397 0.377360.377360.37736
High School 0.0104380.0104380.010438 0.0105660.0105660.010566 0.00876140.00876140.0087614 0.013710.013710.01371
Bowdoin 474747
Gender 0.0427280.0427280.042728 0.0320090.0320090.032009
Major 0.0319930.0319930.031993 0.0288420.0288420.028842 0.0287370.0287370.028737 0.0389960.0389960.038996
Residence 0.112110.112110.11211 0.118120.118120.11812 0.152470.152470.15247 0.104060.104060.10406
Year 0.513850.513850.51385 0.582520.582520.58252 0.557950.557950.55795 0.444290.444290.44429
High School 0.0133620.0133620.013362 0.014070.014070.01407 0.0130320.0130320.013032 0.0156780.0156780.015678
Vanderbilt 484848
Gender 0.159140.159140.15914 0.152950.152950.15295
Major 0.0578080.0578080.057808 0.0507290.0507290.050729 0.0483750.0483750.048375 0.0696030.0696030.069603
Residence 0.224250.224250.22425 0.200990.200990.20099 0.34960.34960.3496 0.277680.277680.27768
Year 0.486660.486660.48666 0.560710.560710.56071 0.484280.484280.48428 0.435180.435180.43518
High School 0.0199620.0199620.019962 0.0205360.0205360.020536 0.0159980.0159980.015998 0.0267940.0267940.026794
Carnegie 494949
Gender 0.0980850.0980850.098085 0.0927430.0927430.092743
Major 0.150930.150930.15093 0.15190.15190.1519 0.150890.150890.15089 0.142320.142320.14232
Residence 0.182730.182730.18273 0.170750.170750.17075 0.216120.216120.21612 0.289370.289370.28937
Year 0.392680.392680.39268 0.46580.46580.4658 0.385050.385050.38505 0.389270.389270.38927
High School 0.0168760.0168760.016876 0.0187540.0187540.018754 0.0111150.0111150.011115 0.0230890.0230890.023089
UGA 505050
Gender 0.104480.104480.10448 0.107310.107310.10731
Major 0.0349620.0349620.034962 0.026410.026410.02641 0.0354810.0354810.035481 0.0414160.0414160.041416
Residence 0.356480.356480.35648 0.336190.336190.33619 0.469570.469570.46957 0.454890.454890.45489
Year 0.364970.364970.36497 0.403940.403940.40394 0.391450.391450.39145 0.312870.312870.31287
High School 0.183480.183480.18348 0.191980.191980.19198 0.165320.165320.16532 0.193170.193170.19317
USF 515151
Gender 0.0754740.075474-0.075474 0.0785150.078515-0.078515
Major 0.0328530.0328530.032853 0.0304390.0304390.030439 0.0427560.0427560.042756 0.0372320.0372320.037232
Residence 0.191880.191880.19188 0.186630.186630.18663 0.295870.295870.29587 0.274540.274540.27454
Year 0.271910.271910.27191 0.286170.286170.28617 0.309040.309040.30904 0.25270.25270.2527
High School 0.142440.142440.14244 0.149360.149360.14936 0.163140.163140.16314 0.161210.161210.16121
UCF 525252
Gender 0.0287640.0287640.028764 0.0217570.0217570.021757
Major 0.0344550.0344550.034455 0.0313070.0313070.031307 0.0354130.0354130.035413 0.0412180.0412180.041218
Residence 0.197720.197720.19772 0.187320.187320.18732 0.312240.312240.31224 0.251230.251230.25123
Year 0.312470.312470.31247 0.334650.334650.33465 0.301320.301320.30132 0.300390.300390.30039
High School 0.144180.144180.14418 0.153220.153220.15322 0.133040.133040.13304 0.170580.170580.17058
FSU 535353
Gender 0.0393090.0393090.039309 0.036960.036960.03696
Major 0.0473670.0473670.047367 0.03840.03840.0384 0.0515850.0515850.051585 0.0541060.0541060.054106
Residence 0.252520.252520.25252 0.238020.238020.23802 0.363240.363240.36324 0.411380.411380.41138
Year 0.313890.313890.31389 0.351250.351250.35125 0.329710.329710.32971 0.266170.266170.26617
High School 0.144710.144710.14471 0.161330.161330.16133 0.148710.148710.14871 0.139130.139130.13913
GWU 545454
Gender 0.0280960.0280960.028096 0.0113950.0113950.011395
Major 0.0478020.0478020.047802 0.0419890.0419890.041989 0.0505960.0505960.050596 0.0482120.0482120.048212
Residence 0.169930.169930.16993 0.170850.170850.17085 0.20820.20820.2082 0.167950.167950.16795
Year 0.514080.514080.51408 0.588980.588980.58898 0.536260.536260.53626 0.423250.423250.42325
High School 0.021170.021170.02117 0.0223650.0223650.022365 0.0240650.0240650.024065 0.0200610.0200610.020061
Johns Hopkins 555555
Gender 0.0971630.0971630.097163 0.0830040.0830040.083004
Major 0.0724870.0724870.072487 0.069610.069610.06961 0.0618830.0618830.061883 0.0781660.0781660.078166
Residence 0.113280.113280.11328 0.109750.109750.10975 0.127690.127690.12769 0.132630.132630.13263
Year 0.435190.435190.43519 0.506430.506430.50643 0.396710.396710.39671 0.428930.428930.42893
High School 0.0134180.0134180.013418 0.0136740.0136740.013674 0.00967950.00967950.0096795 0.017720.017720.01772
Syracuse 565656
Gender 0.0622720.0622720.062272 0.0490580.0490580.049058
Major 0.084860.084860.08486 0.083030.083030.08303 0.083140.083140.08314 0.101690.101690.10169
Residence 0.296310.296310.29631 0.269580.269580.26958 0.426360.426360.42636 0.357140.357140.35714
Year 0.465460.465460.46546 0.520610.520610.52061 0.461210.461210.46121 0.408720.408720.40872
High School 0.0271750.0271750.027175 0.0291380.0291380.029138 0.0259410.0259410.025941 0.0306920.0306920.030692
Notre Dame 575757
Gender 0.133220.133220.13322 0.136360.136360.13636
Major 0.0529090.0529090.052909 0.0460470.0460470.046047 0.0612210.0612210.061221 0.045080.045080.04508
Residence 0.253850.253850.25385 0.254890.254890.25489 0.397520.397520.39752 0.509160.509160.50916
Year 0.540480.540480.54048 0.592160.592160.59216 0.59060.59060.5906 0.429310.429310.42931
High School 0.0297350.0297350.029735 0.0318580.0318580.031858 0.0319860.0319860.031986 0.0346020.0346020.034602
Maryland 585858
Gender 0.0558050.0558050.055805 0.0503810.0503810.050381
Major 0.0595220.0595220.059522 0.0548950.0548950.054895 0.0596570.0596570.059657 0.0692430.0692430.069243
Residence 0.210080.210080.21008 0.199210.199210.19921 0.296920.296920.29692 0.242070.242070.24207
Year 0.436470.436470.43647 0.477090.477090.47709 0.455850.455850.45585 0.407210.407210.40721
High School 0.147690.147690.14769 0.157760.157760.15776 0.138980.138980.13898 0.18720.18720.1872
Maine 595959
Gender 0.00486840.0048684-0.0048684 0.00442510.0044251-0.0044251
Major 0.0701520.0701520.070152 0.0679080.0679080.067908 0.0869980.0869980.086998 0.0884740.0884740.088474
Residence 0.197450.197450.19745 0.189970.189970.18997 0.232310.232310.23231 0.287750.287750.28775
Year 0.261870.261870.26187 0.285120.285120.28512 0.304530.304530.30453 0.22530.22530.2253
High School 0.200990.200990.20099 0.214930.214930.21493 0.226910.226910.22691 0.203290.203290.20329
Smith 606060
Gender 0.0252150.0252150.025215 0.0178280.0178280.017828
Major 0.0533710.0533710.053371 0.0482530.0482530.048253 0.0545980.0545980.054598 00
Residence 0.305620.305620.30562 0.291890.291890.29189 0.31790.31790.3179 00
Year 0.321330.321330.32133 0.393660.393660.39366 0.340140.340140.34014 00
High School 0.00934120.00934120.0093412 0.00984050.00984050.0098405 0.00977730.00977730.0097773 00
UC 616161
Gender 0.00260050.00260050.0026005 0.00148920.0014892-0.0014892
Major 0.0666430.0666430.066643 0.0620170.0620170.062017 0.0834270.0834270.083427 0.0599130.0599130.059913
Residence 0.273350.273350.27335 0.265470.265470.26547 0.341820.341820.34182 0.40180.40180.4018
Year 0.41150.41150.4115 0.467460.467460.46746 0.430120.430120.43012 0.379180.379180.37918
High School 0.084130.084130.08413 0.0935610.0935610.093561 0.0908040.0908040.090804 0.0966070.0966070.096607
Villanova 626262
Gender 0.100710.100710.10071 0.0961560.0961560.096156
Major 0.0602020.0602020.060202 0.0553610.0553610.055361 0.0711070.0711070.071107 0.061060.061060.06106
Residence 0.169620.169620.16962 0.158060.158060.15806 0.223340.223340.22334 0.191180.191180.19118
Year 0.616540.616540.61654 0.663350.663350.66335 0.593160.593160.59316 0.587830.587830.58783
High School 0.023290.023290.02329 0.0244890.0244890.024489 0.022760.022760.02276 0.0382260.0382260.038226
Virginia 636363
Gender 0.0670950.0670950.067095 0.0576350.0576350.057635
Major 0.0602870.0602870.060287 0.0545830.0545830.054583 0.0686160.0686160.068616 0.0608590.0608590.060859
Residence 0.152050.152050.15205 0.149090.149090.14909 0.222110.222110.22211 0.198390.198390.19839
Year 0.368990.368990.36899 0.416360.416360.41636 0.386630.386630.38663 0.343080.343080.34308
High School 0.122820.122820.12282 0.134980.134980.13498 0.115670.115670.11567 0.132090.132090.13209
UC 646464
Gender 0.0283020.028302-0.028302 0.0372060.037206-0.037206
Major 0.0451810.0451810.045181 0.0418650.0418650.041865 0.0482360.0482360.048236 0.0543240.0543240.054324
Residence 0.267990.267990.26799 0.250850.250850.25085 0.382610.382610.38261 0.426370.426370.42637
Year 0.371680.371680.37168 0.399930.399930.39993 0.400310.400310.40031 0.343040.343040.34304
High School 0.0721220.0721220.072122 0.0771370.0771370.077137 0.080640.080640.08064 0.0895780.0895780.089578
Cal 656565
Gender 0.0221190.0221190.022119 0.0166410.0166410.016641
Major 0.114230.114230.11423 0.108270.108270.10827 0.129930.129930.12993 0.123290.123290.12329
Residence 0.295550.295550.29555 0.278840.278840.27884 0.451070.451070.45107 0.39680.39680.3968
Year 0.375410.375410.37541 0.396210.396210.39621 0.419180.419180.41918 0.317820.317820.31782
High School 0.0705780.0705780.070578 0.0728980.0728980.072898 0.0721930.0721930.072193 0.0809670.0809670.080967
Mississippi 666666
Gender 0.113720.113720.11372 0.118820.118820.11882
Major 0.0460730.0460730.046073 0.0364910.0364910.036491 0.0438540.0438540.043854 0.0492160.0492160.049216
Residence 0.312880.312880.31288 0.296580.296580.29658 0.503980.503980.50398 0.489780.489780.48978
Year 0.310980.310980.31098 0.342970.342970.34297 0.352850.352850.35285 0.25970.25970.2597
High School 0.109620.109620.10962 0.112280.112280.11228 0.085340.085340.08534 0.126910.126910.12691
Mich 676767
Gender 0.0575430.0575430.057543 0.0475470.0475470.047547
Major 0.0816180.0816180.081618 0.077070.077070.07707 0.0864680.0864680.086468 0.0935270.0935270.093527
Residence 0.33660.33660.3366 0.321640.321640.32164 0.458650.458650.45865 0.474990.474990.47499
Year 0.248250.248250.24825 0.275290.275290.27529 0.20060.20060.2006 0.261510.261510.26151
High School 0.0476380.0476380.047638 0.0524660.0524660.052466 0.0405190.0405190.040519 0.0561370.0561370.056137
UCSC 686868
Gender 0.0274050.027405-0.027405 0.0316760.031676-0.031676
Major 0.0537020.0537020.053702 0.04680.04680.0468 0.059260.059260.05926 0.0598110.0598110.059811
Residence 0.466430.466430.46643 0.479610.479610.47961 0.470390.470390.47039 0.481380.481380.48138
Year 0.458650.458650.45865 0.494640.494640.49464 0.495870.495870.49587 0.42350.42350.4235
High School 0.0671360.0671360.067136 0.0707170.0707170.070717 0.0744110.0744110.074411 0.077410.077410.07741
Indiana 696969
Gender 0.0150870.0150870.015087 0.00442080.00442080.0044208
Major 0.0478840.0478840.047884 0.0386280.0386280.038628 0.0566780.0566780.056678 0.0516130.0516130.051613
Residence 0.371290.371290.37129 0.356240.356240.35624 0.530210.530210.53021 0.552820.552820.55282
Year 0.412190.412190.41219 0.451520.451520.45152 0.453470.453470.45347 0.337480.337480.33748
High School 0.166250.166250.16625 0.177040.177040.17704 0.161540.161540.16154 0.177050.177050.17705
Vermont 707070
Gender 0.00366210.00366210.0036621 0.0141540.014154-0.014154
Major 0.0553760.0553760.055376 0.0505020.0505020.050502 0.0685970.0685970.068597 0.0519760.0519760.051976
Residence 0.210070.210070.21007 0.199160.199160.19916 0.261190.261190.26119 0.277150.277150.27715
Year 0.50630.50630.5063 0.541770.541770.54177 0.53710.53710.5371 0.431360.431360.43136
High School 0.0653180.0653180.065318 0.069060.069060.06906 0.0665230.0665230.066523 0.0755690.0755690.075569
Auburn 717171
Gender 0.0946210.0946210.094621 0.0963640.0963640.096364
Major 0.045380.045380.04538 0.0360490.0360490.036049 0.0419330.0419330.041933 0.06710.06710.0671
Residence 0.389470.389470.38947 0.370380.370380.37038 0.494660.494660.49466 0.677260.677260.67726
Year 0.277670.277670.27767 0.303290.303290.30329 0.291630.291630.29163 0.242620.242620.24262
High School 0.150380.150380.15038 0.157530.157530.15753 0.124970.124970.12497 0.178760.178760.17876
USFCA 727272
Gender 0.0240330.0240330.024033 0.0287030.0287030.028703
Major 0.0817630.0817630.081763 0.0766980.0766980.076698 0.10490.10490.1049 0.0601110.0601110.060111
Residence 0.262370.262370.26237 0.262740.262740.26274 0.315670.315670.31567 0.276510.276510.27651
Year 0.475050.475050.47505 0.514390.514390.51439 0.508010.508010.50801 0.501340.501340.50134
High School 0.0258660.0258660.025866 0.0273360.0273360.027336 0.0324160.0324160.032416 0.0278270.0278270.027827
Wake 737373
Gender 0.130860.130860.13086 0.117850.117850.11785
Major 0.036590.036590.03659 0.0315660.0315660.031566 0.028230.028230.02823 0.0391310.0391310.039131
Residence 0.226780.226780.22678 0.212410.212410.21241 0.313560.313560.31356 0.304730.304730.30473
Year 0.414290.414290.41429 0.477860.477860.47786 0.398240.398240.39824 0.380070.380070.38007
High School 0.0153070.0153070.015307 0.0163060.0163060.016306 0.0123780.0123780.012378 0.0174330.0174330.017433
Santa 747474
Gender 0.0353130.0353130.035313 0.0257090.0257090.025709
Major 0.0486320.0486320.048632 0.0461480.0461480.046148 0.0470930.0470930.047093 0.0596480.0596480.059648
Residence 0.181360.181360.18136 0.187560.187560.18756 0.196680.196680.19668 0.192620.192620.19262
Year 0.454870.454870.45487 0.500320.500320.50032 0.458080.458080.45808 0.420260.420260.42026
High School 0.035270.035270.03527 0.0369760.0369760.036976 0.037230.037230.03723 0.0580710.0580710.058071
American 757575
Gender 0.0271410.0271410.027141 0.00940.00940.0094
Major 0.0512120.0512120.051212 0.0453960.0453960.045396 0.0509260.0509260.050926 0.0523860.0523860.052386
Residence 0.272910.272910.27291 0.252680.252680.25268 0.348580.348580.34858 0.328470.328470.32847
Year 0.414080.414080.41408 0.459270.459270.45927 0.451750.451750.45175 0.317160.317160.31716
High School 0.0102710.0102710.010271 0.0107320.0107320.010732 0.0110320.0110320.011032 0.00822030.00822030.0082203
Haverford 767676
Gender 0.0642720.0642720.064272 0.0542730.0542730.054273
Major 0.0320480.0320480.032048 0.0237010.0237010.023701 0.0288590.0288590.028859 0.0313930.0313930.031393
Residence 0.125630.125630.12563 0.127570.127570.12757 0.132990.132990.13299 0.126430.126430.12643
Year 0.396360.396360.39636 0.430040.430040.43004 0.428730.428730.42873 0.327130.327130.32713
High School 0.0052210.0052210.005221 0.00524330.00524330.0052433 0.00413920.00413920.0041392 0.00438860.00438860.0043886
William 777777
Gender 0.117320.117320.11732 0.122610.122610.12261
Major 0.0435560.0435560.043556 0.0372530.0372530.037253 0.0377880.0377880.037788 0.0452950.0452950.045295
Residence 0.201450.201450.20145 0.202920.202920.20292 0.248590.248590.24859 0.290390.290390.29039
Year 0.434410.434410.43441 0.499760.499760.49976 0.425360.425360.42536 0.427740.427740.42774
High School 0.0345230.0345230.034523 0.0380740.0380740.038074 0.0338570.0338570.033857 0.0331520.0331520.033152
MU 787878
Gender 0.121170.121170.12117 0.104610.104610.10461
Major 0.0504750.0504750.050475 0.0468520.0468520.046852 0.0552550.0552550.055255 0.0469510.0469510.046951
Residence 0.325940.325940.32594 0.306440.306440.30644 0.428170.428170.42817 0.453960.453960.45396
Year 0.502890.502890.50289 0.548810.548810.54881 0.504850.504850.50485 0.424380.424380.42438
High School 0.0856620.0856620.085662 0.0912230.0912230.091223 0.0753730.0753730.075373 0.101530.101530.10153
JMU 797979
Gender 0.00910650.0091065-0.0091065 0.024670.02467-0.02467
Major 0.0596930.0596930.059693 0.0530250.0530250.053025 0.0679990.0679990.067999 0.0693930.0693930.069393
Residence 0.186140.186140.18614 0.186970.186970.18697 0.233820.233820.23382 0.220170.220170.22017
Year 0.510170.510170.51017 0.557230.557230.55723 0.522890.522890.52289 0.438570.438570.43857
High School 0.0958350.0958350.095835 0.101660.101660.10166 0.100320.100320.10032 0.108480.108480.10848
Texas 808080
Gender 0.0944810.0944810.094481 0.095290.095290.09529
Major 0.0665520.0665520.066552 0.0609590.0609590.060959 0.0596980.0596980.059698 0.0855720.0855720.085572
Residence 0.2770.2770.277 0.260550.260550.26055 0.386510.386510.38651 0.376580.376580.37658
Year 0.337720.337720.33772 0.372780.372780.37278 0.346620.346620.34662 0.318360.318360.31836
High School 0.165810.165810.16581 0.176870.176870.17687 0.149590.149590.14959 0.18490.18490.1849
Simmons 818181
Gender 0.00797530.00797530.0079753 0.00160020.0016002-0.0016002
Major 0.0697440.0697440.069744 0.0673020.0673020.067302 0.0701090.0701090.070109 00
Residence 0.186810.186810.18681 0.186220.186220.18622 0.187250.187250.18725 00
Year 0.531330.531330.53133 0.586240.586240.58624 0.537670.537670.53767 00
High School 0.0140880.0140880.014088 0.0143320.0143320.014332 0.014120.014120.01412 00
Bingham 828282
Gender 0.0149960.0149960.014996 0.0127910.0127910.012791
Major 0.0514050.0514050.051405 0.0451790.0451790.045179 0.0657190.0657190.065719 0.0532140.0532140.053214
Residence 0.174230.174230.17423 0.175770.175770.17577 0.196250.196250.19625 0.197570.197570.19757
Year 0.351080.351080.35108 0.394240.394240.39424 0.38030.38030.3803 0.328710.328710.32871
High School 0.066760.066760.06676 0.0739470.0739470.073947 0.0620640.0620640.062064 0.0845480.0845480.084548
Temple 838383
Gender 0.0667990.066799-0.066799 0.0742550.074255-0.074255
Major 0.0644540.0644540.064454 0.0593740.0593740.059374 0.0765310.0765310.076531 0.073270.073270.07327
Residence 0.228580.228580.22858 0.227930.227930.22793 0.279190.279190.27919 0.23330.23330.2333
Year 0.455790.455790.45579 0.489350.489350.48935 0.527950.527950.52795 0.407270.407270.40727
High School 0.0841410.0841410.084141 0.0884280.0884280.088428 0.0930980.0930980.093098 0.107030.107030.10703
Texas 848484
Gender 0.0630710.0630710.063071 0.0573430.0573430.057343
Major 0.0591760.0591760.059176 0.0545670.0545670.054567 0.063160.063160.06316 0.0673130.0673130.067313
Residence 0.31220.31220.3122 0.290620.290620.29062 0.480190.480190.48019 0.383120.383120.38312
Year 0.307250.307250.30725 0.333350.333350.33335 0.318260.318260.31826 0.301860.301860.30186
High School 0.149230.149230.14923 0.158950.158950.15895 0.148440.148440.14844 0.152460.152460.15246
Vassar 858585
Gender 0.00201520.00201520.0020152 0.0101380.010138-0.010138
Major 0.0494760.0494760.049476 0.0398090.0398090.039809 0.0526450.0526450.052645 0.0580730.0580730.058073
Residence 0.243380.243380.24338 0.256450.256450.25645 0.255380.255380.25538 0.233290.233290.23329
Year 0.46680.46680.4668 0.524760.524760.52476 0.51980.51980.5198 0.395990.395990.39599
High School 0.0105750.0105750.010575 0.0110740.0110740.011074 0.0112570.0112570.011257 0.0114450.0114450.011445
Pepperdine 868686
Gender 0.0593140.0593140.059314 0.0447940.0447940.044794
Major 0.0375970.0375970.037597 0.0277350.0277350.027735 0.0355870.0355870.035587 0.0410340.0410340.041034
Residence 0.229320.229320.22932 0.197970.197970.19797 0.358920.358920.35892 0.275110.275110.27511
Year 0.427530.427530.42753 0.490540.490540.49054 0.435350.435350.43535 0.373740.373740.37374
High School 0.00821510.00821510.0082151 0.00837030.00837030.0083703 0.00810950.00810950.0081095 0.00738640.00738640.0073864
Wisconsin 878787
Gender 0.0467070.0467070.046707 0.0425870.0425870.042587
Major 0.0395190.0395190.039519 0.0330340.0330340.033034 0.0480210.0480210.048021 0.0433720.0433720.043372
Residence 0.342470.342470.34247 0.337840.337840.33784 0.457560.457560.45756 0.390750.390750.39075
Year 0.40460.40460.4046 0.454130.454130.45413 0.465520.465520.46552 0.318410.318410.31841
High School 0.145830.145830.14583 0.15510.15510.1551 0.147190.147190.14719 0.152860.152860.15286
Colgate 888888
Gender 0.0899860.0899860.089986 0.0590970.0590970.059097
Major 0.0362490.0362490.036249 0.0328670.0328670.032867 0.0321310.0321310.032131 0.0390730.0390730.039073
Residence 0.173030.173030.17303 0.163990.163990.16399 0.195610.195610.19561 0.259620.259620.25962
Year 0.549940.549940.54994 0.630840.630840.63084 0.566550.566550.56655 0.461050.461050.46105
High School 0.0125340.0125340.012534 0.0129830.0129830.012983 0.0114240.0114240.011424 0.0147680.0147680.014768
Rutgers 898989
Gender 0.0308690.0308690.030869 0.0268270.0268270.026827
Major 0.0664690.0664690.066469 0.0595020.0595020.059502 0.0761720.0761720.076172 0.0698410.0698410.069841
Residence 0.236240.236240.23624 0.234840.234840.23484 0.284580.284580.28458 0.281420.281420.28142
Year 0.392030.392030.39203 0.438440.438440.43844 0.42930.42930.4293 0.375270.375270.37527
High School 0.15390.15390.1539 0.166030.166030.16603 0.159010.159010.15901 0.178690.178690.17869
Howard 909090
Gender 0.0922430.092243-0.092243 0.0956140.095614-0.095614
Major 0.0496630.0496630.049663 0.0439860.0439860.043986 0.0635120.0635120.063512 0.0484780.0484780.048478
Residence 0.16990.16990.1699 0.158730.158730.15873 0.244970.244970.24497 0.201270.201270.20127
Year 0.429130.429130.42913 0.482770.482770.48277 0.522210.522210.52221 0.390810.390810.39081
High School 0.0162970.0162970.016297 0.0164310.0164310.016431 0.0223960.0223960.022396 0.0138630.0138630.013863
UConn 919191
Gender 0.0117670.0117670.011767 0.012620.012620.01262
Major 0.0529490.0529490.052949 0.0507960.0507960.050796 0.0766420.0766420.076642 0.0494080.0494080.049408
Residence 0.126210.126210.12621 0.12870.12870.1287 0.174270.174270.17427 0.147290.147290.14729
Year 0.406780.406780.40678 0.448140.448140.44814 0.460420.460420.46042 0.364410.364410.36441
High School 0.147340.147340.14734 0.159110.159110.15911 0.147310.147310.14731 0.179110.179110.17911
UMass 929292
Gender 0.0461360.046136-0.046136 0.053320.05332-0.05332
Major 0.0785340.0785340.078534 0.0723080.0723080.072308 0.100770.100770.10077 0.0958080.0958080.095808
Residence 0.228180.228180.22818 0.221560.221560.22156 0.274020.274020.27402 0.276780.276780.27678
Year 0.43840.43840.4384 0.476420.476420.47642 0.488310.488310.48831 0.382430.382430.38243
High School 0.115490.115490.11549 0.123820.123820.12382 0.117560.117560.11756 0.149510.149510.14951
Baylor 939393
Gender 0.0957140.0957140.095714 0.0858880.0858880.085888
Major 0.0501550.0501550.050155 0.0436350.0436350.043635 0.0563810.0563810.056381 0.0519980.0519980.051998
Residence 0.334420.334420.33442 0.296660.296660.29666 0.547960.547960.54796 0.509840.509840.50984
Year 0.396370.396370.39637 0.446270.446270.44627 0.418240.418240.41824 0.359050.359050.35905
High School 0.0560620.0560620.056062 0.05780.05780.0578 0.0506490.0506490.050649 0.0583990.0583990.058399
Penn 949494
Gender 0.0209220.0209220.020922 0.0203920.0203920.020392
Major 0.0546990.0546990.054699 0.0492290.0492290.049229 0.0666910.0666910.066691 0.0599160.0599160.059916
Residence 0.243830.243830.24383 0.230520.230520.23052 0.410690.410690.41069 0.350640.350640.35064
Year 0.398990.398990.39899 0.432050.432050.43205 0.440120.440120.44012 0.370950.370950.37095
High School 0.146580.146580.14658 0.158730.158730.15873 0.134160.134160.13416 0.185280.185280.18528
Tennessee 959595
Gender 0.0542720.0542720.054272 0.0486630.0486630.048663
Major 0.0425890.0425890.042589 0.034260.034260.03426 0.0436550.0436550.043655 0.050750.050750.05075
Residence 0.226540.226540.22654 0.208720.208720.20872 0.349450.349450.34945 0.330830.330830.33083
Year 0.291280.291280.29128 0.31390.31390.3139 0.306650.306650.30665 0.261750.261750.26175
High School 0.171720.171720.17172 0.181160.181160.18116 0.150560.150560.15056 0.204650.204650.20465
Lehigh 969696
Gender 0.069540.069540.06954 0.0598330.0598330.059833
Major 0.0494720.0494720.049472 0.0452090.0452090.045209 0.0401370.0401370.040137 0.0564380.0564380.056438
Residence 0.281690.281690.28169 0.258270.258270.25827 0.435460.435460.43546 0.392540.392540.39254
Year 0.499920.499920.49992 0.558490.558490.55849 0.490090.490090.49009 0.448060.448060.44806
High School 0.0187580.0187580.018758 0.0194710.0194710.019471 0.0139340.0139340.013934 0.0248680.0248680.024868
Oklahoma 979797
Gender 0.111760.111760.11176 0.11720.11720.1172
Major 0.041150.041150.04115 0.0325220.0325220.032522 0.0396450.0396450.039645 0.045120.045120.04512
Residence 0.403260.403260.40326 0.396820.396820.39682 0.580120.580120.58012 0.59480.59480.5948
Year 0.292350.292350.29235 0.314610.314610.31461 0.297480.297480.29748 0.24930.24930.2493
High School 0.15830.15830.1583 0.167120.167120.16712 0.129930.129930.12993 0.174180.174180.17418
Reed 989898
Gender 0.0219030.0219030.021903 0.0122250.0122250.012225
Major 0.0472330.0472330.047233 0.0375940.0375940.037594 0.0582920.0582920.058292 0.0525580.0525580.052558
Residence 0.132950.132950.13295 0.133770.133770.13377 0.149150.149150.14915 0.0904870.0904870.090487
Year 0.347480.347480.34748 0.391180.391180.39118 0.421120.421120.42112 0.277150.277150.27715
High School 0.00323330.00323330.0032333 0.00285040.00285040.0028504 0.00202840.00202840.0020284 0.00168930.00168930.0016893
Brandeis 999999
Gender 0.0194010.0194010.019401 0.0227820.0227820.022782
Major 0.0414970.0414970.041497 0.0357480.0357480.035748 0.044760.044760.04476 0.0430440.0430440.043044
Residence 0.194010.194010.19401 0.193380.193380.19338 0.227250.227250.22725 0.182930.182930.18293
Year 0.529640.529640.52964 0.616820.616820.61682 0.585170.585170.58517 0.475240.475240.47524
High School 0.0142410.0142410.014241 0.0148720.0148720.014872 0.0149660.0149660.014966 0.0146630.0146630.014663
Trinity 100100100
Gender 0.0520120.0520120.052012 0.0414590.0414590.041459
Major 0.0504410.0504410.050441 0.0435780.0435780.043578 0.0458390.0458390.045839 0.0651840.0651840.065184
Residence 0.105770.105770.10577 0.106340.106340.10634 0.122060.122060.12206 0.102480.102480.10248
Year 0.50790.50790.5079 0.589710.589710.58971 0.554020.554020.55402 0.438750.438750.43875
High School 0.016130.016130.01613 0.0166560.0166560.016656 0.0145220.0145220.014522 0.0217510.0217510.021751
Table 3: Logistic regression coefficients for a model combining a density (edge) term and nodematch contributions for the increased propensity of two nodes with the same categorical value to have an edge connected between them. This is calculated individually for Year, Residence, High School, and Major. We give the standard error for each coefficient in parentheses. All coefficients are statistically significantly different from zero with p𝑝p-value less than 1×1041superscript1041\times 10^{-4}. Wellesley (22), Smith (60), and Simmons (81) are female-only institutions, so we list the values for their Male networks as NA.
Wellesley 222222 Edge Year Residence High School Major
Full 4.4291(0.0047086)4.42910.0047086-4.4291(0.0047086) 1.8249(0.0067097)1.82490.00670971.8249(0.0067097) 1.2546(0.012002)1.25460.0120021.2546(0.012002) 3.1738(0.041398)3.17380.0413983.1738(0.041398) 0.70232(0.013501)0.702320.0135010.70232(0.013501)
Student 4.3656(0.0063232)4.36560.0063232-4.3656(0.0063232) 1.7437(0.0082165)1.74370.00821651.7437(0.0082165) 1.2512(0.013129)1.25120.0131291.2512(0.013129) 3.2966(0.05217)3.29660.052173.2966(0.05217) 0.62071(0.01745)0.620710.017450.62071(0.01745)
Female 4.4673(0.0054048)4.46730.0054048-4.4673(0.0054048) 1.8587(0.0073823)1.85870.00738231.8587(0.0073823) 1.2749(0.012577)1.27490.0125771.2749(0.012577) 3.19(0.044896)3.190.0448963.19(0.044896) 0.66471(0.014677)0.664710.0146770.66471(0.014677)
Male NA NA NA NA NA
Caltech 363636 Edge Year Residence High School Major
Full 3.6903(0.012891)3.69030.012891-3.6903(0.012891) 1.5382(0.018233)1.53820.0182331.5382(0.018233) 2.4151(0.018644)2.41510.0186442.4151(0.018644) 2.3789(0.14869)2.37890.148692.3789(0.14869) 0.53388(0.02881)0.533880.028810.53388(0.02881)
Student 3.4932(0.017086)3.49320.017086-3.4932(0.017086) 1.4006(0.021534)1.40060.0215341.4006(0.021534) 2.3896(0.022905)2.38960.0229052.3896(0.022905) 2.5169(0.1944)2.51690.19442.5169(0.1944) 0.47013(0.035936)0.470130.0359360.47013(0.035936)
Female 3.045(0.035464)3.0450.035464-3.045(0.035464) 1.4288(0.049983)1.42880.0499831.4288(0.049983) 2.1684(0.053205)2.16840.0532052.1684(0.053205) 1.3514(0.43722)1.35140.437221.3514(0.43722) 0.44336(0.072743)0.443360.0727430.44336(0.072743)
Male 3.7902(0.022582)3.79020.022582-3.7902(0.022582) 1.5104(0.029781)1.51040.0297811.5104(0.029781) 2.4803(0.029657)2.48030.0296572.4803(0.029657) 2.887(0.23382)2.8870.233822.887(0.23382) 0.51028(0.044684)0.510280.0446840.51028(0.044684)
Williams 404040 Edge Year Residence High School Major
Full 4.221(0.0045298)4.2210.0045298-4.221(0.0045298) 2.1133(0.0063052)2.11330.00630522.1133(0.0063052) 0.93506(0.011943)0.935060.0119430.93506(0.011943) 3.1413(0.036901)3.14130.0369013.1413(0.036901) 0.63891(0.01226)0.638910.012260.63891(0.01226)
Student 4.1503(0.0062345)4.15030.0062345-4.1503(0.0062345) 2.0076(0.007883)2.00760.0078832.0076(0.007883) 0.95814(0.012448)0.958140.0124480.95814(0.012448) 3.3846(0.047399)3.38460.0473993.3846(0.047399) 0.59197(0.015798)0.591970.0157980.59197(0.015798)
Female 4.2218(0.0097145)4.22180.0097145-4.2218(0.0097145) 2.1577(0.012801)2.15770.0128012.1577(0.012801) 1.0063(0.023198)1.00630.0231981.0063(0.023198) 3.1839(0.06889)3.18390.068893.1839(0.06889) 0.62403(0.02406)0.624030.024060.62403(0.02406)
Male 4.0071(0.0095503)4.00710.0095503-4.0071(0.0095503) 1.9273(0.013487)1.92730.0134871.9273(0.013487) 0.88885(0.024598)0.888850.0245980.88885(0.024598) 3.0015(0.07507)3.00150.075073.0015(0.07507) 0.63484(0.023232)0.634840.0232320.63484(0.023232)
Amherst 414141 Edge Year Residence High School Major
Full 3.9164(0.0049089)3.91640.0049089-3.9164(0.0049089) 2.0068(0.0069995)2.00680.00699952.0068(0.0069995) 1.1385(0.017204)1.13850.0172041.1385(0.017204) 2.7878(0.043122)2.78780.0431222.7878(0.043122) 0.56196(0.014974)0.561960.0149740.56196(0.014974)
Student 3.8449(0.0066932)3.84490.0066932-3.8449(0.0066932) 1.9466(0.0086346)1.94660.00863461.9466(0.0086346) 1.0997(0.018196)1.09970.0181961.0997(0.018196) 3.0146(0.053588)3.01460.0535883.0146(0.053588) 0.45937(0.019933)0.459370.0199330.45937(0.019933)
Female 3.8278(0.010538)3.82780.010538-3.8278(0.010538) 2.1198(0.014293)2.11980.0142932.1198(0.014293) 1.1944(0.034174)1.19440.0341741.1944(0.034174) 2.9552(0.091756)2.95520.0917562.9552(0.091756) 0.44155(0.03109)0.441550.031090.44155(0.03109)
Male 3.8611(0.010649)3.86110.010649-3.8611(0.010649) 1.8312(0.015146)1.83120.0151461.8312(0.015146) 1.2709(0.033384)1.27090.0333841.2709(0.033384) 2.6513(0.076298)2.65130.0762982.6513(0.076298) 0.57283(0.028969)0.572830.0289690.57283(0.028969)
Swarthmore 424242 Edge Year Residence High School Major
Full 3.635(0.0058633)3.6350.0058633-3.635(0.0058633) 1.7006(0.0085934)1.70060.00859341.7006(0.0085934) 0.70677(0.014092)0.706770.0140920.70677(0.014092) 2.8177(0.087157)2.81770.0871572.8177(0.087157) 0.71062(0.015732)0.710620.0157320.71062(0.015732)
Student 3.5712(0.0077451)3.57120.0077451-3.5712(0.0077451) 1.6388(0.010329)1.63880.0103291.6388(0.010329) 0.70249(0.015382)0.702490.0153820.70249(0.015382) 3.108(0.11187)3.1080.111873.108(0.11187) 0.62213(0.020307)0.622130.0203070.62213(0.020307)
Female 3.5944(0.012607)3.59440.012607-3.5944(0.012607) 1.7912(0.017337)1.79120.0173371.7912(0.017337) 0.70752(0.028369)0.707520.0283690.70752(0.028369) 3.1246(0.17728)3.12460.177283.1246(0.17728) 0.71791(0.03107)0.717910.031070.71791(0.03107)
Male 3.4944(0.012307)3.49440.012307-3.4944(0.012307) 1.553(0.018316)1.5530.0183161.553(0.018316) 0.73946(0.027981)0.739460.0279810.73946(0.027981) 2.4786(0.18762)2.47860.187622.4786(0.18762) 0.73991(0.030376)0.739910.0303760.73991(0.030376)
Oberlin 444444 Edge Year Residence High School Major
Full 4.3357(0.0045547)4.33570.0045547-4.3357(0.0045547) 1.4322(0.0071089)1.43220.00710891.4322(0.0071089) 1.0716(0.013797)1.07160.0137971.0716(0.013797) 3.2257(0.042543)3.22570.0425433.2257(0.042543) 1.4604(0.010714)1.46040.0107141.4604(0.010714)
Student 4.3477(0.0057572)4.34770.0057572-4.3477(0.0057572) 1.4406(0.0081899)1.44060.00818991.4406(0.0081899) 1.1044(0.014159)1.10440.0141591.1044(0.014159) 3.3936(0.050744)3.39360.0507443.3936(0.050744) 1.3832(0.01303)1.38320.013031.3832(0.01303)
Female 4.382(0.0092964)4.3820.0092964-4.382(0.0092964) 1.512(0.013473)1.5120.0134731.512(0.013473) 1.1808(0.024895)1.18080.0248951.1808(0.024895) 3.3713(0.077285)3.37130.0772853.3713(0.077285) 1.5071(0.019651)1.50710.0196511.5071(0.019651)
Male 4.2048(0.011081)4.20480.011081-4.2048(0.011081) 1.3069(0.017141)1.30690.0171411.3069(0.017141) 1.0426(0.031315)1.04260.0313151.0426(0.031315) 3.051(0.10063)3.0510.100633.051(0.10063) 1.3883(0.025176)1.38830.0251761.3883(0.025176)
Middlebury 454545 Edge Year Residence High School Major
Full 4.4107(0.0045357)4.41070.0045357-4.4107(0.0045357) 2.0753(0.0059187)2.07530.00591872.0753(0.0059187) 0.76052(0.0074835)0.760520.00748350.76052(0.0074835) 3.3979(0.031385)3.39790.0313853.3979(0.031385) 0.79632(0.012067)0.796320.0120670.79632(0.012067)
Student 4.4519(0.0061279)4.45190.0061279-4.4519(0.0061279) 2.0652(0.0073273)2.06520.00732732.0652(0.0073273) 0.82491(0.0082675)0.824910.00826750.82491(0.0082675) 3.6831(0.04)3.68310.043.6831(0.04) 0.71206(0.015883)0.712060.0158830.71206(0.015883)
Female 4.4496(0.0096593)4.44960.0096593-4.4496(0.0096593) 2.1589(0.01186)2.15890.011862.1589(0.01186) 0.82401(0.014034)0.824010.0140340.82401(0.014034) 3.6264(0.063049)3.62640.0630493.6264(0.063049) 0.77215(0.023298)0.772150.0232980.77215(0.023298)
Male 4.2906(0.01027)4.29060.01027-4.2906(0.01027) 1.9748(0.013337)1.97480.0133371.9748(0.013337) 0.72369(0.016737)0.723690.0167370.72369(0.016737) 3.3119(0.064183)3.31190.0641833.3119(0.064183) 0.76615(0.024516)0.766150.0245160.76615(0.024516)
Hamilton 464646 Edge Year Residence High School Major
Full 3.9231(0.0047892)3.92310.0047892-3.9231(0.0047892) 1.8442(0.0067955)1.84420.00679551.8442(0.0067955) 0.84034(0.011975)0.840340.0119750.84034(0.011975) 3.026(0.042724)3.0260.0427243.026(0.042724) 0.66129(0.014902)0.661290.0149020.66129(0.014902)
Student 3.9278(0.0062417)3.92780.0062417-3.9278(0.0062417) 1.8496(0.0080481)1.84960.00804811.8496(0.0080481) 0.83128(0.012498)0.831280.0124980.83128(0.012498) 3.2264(0.052715)3.22640.0527153.2264(0.052715) 0.59501(0.018189)0.595010.0181890.59501(0.018189)
Female 3.8481(0.0095168)3.84810.0095168-3.8481(0.0095168) 1.9502(0.012943)1.95020.0129431.9502(0.012943) 0.9582(0.021613)0.95820.0216130.9582(0.021613) 3.0543(0.085707)3.05430.0857073.0543(0.085707) 0.65026(0.02958)0.650260.029580.65026(0.02958)
Male 3.7214(0.010321)3.72140.010321-3.7214(0.010321) 1.5511(0.015012)1.55110.0150121.5511(0.015012) 0.90341(0.025581)0.903410.0255810.90341(0.025581) 3.1322(0.081785)3.13220.0817853.1322(0.081785) 0.57013(0.027734)0.570130.0277340.57013(0.027734)
Bowdoin 474747 Edge Year Residence High School Major
Full 4.0994(0.0053132)4.09940.0053132-4.0994(0.0053132) 2.0771(0.0073015)2.07710.00730152.0771(0.0073015) 0.9616(0.012875)0.96160.0128750.9616(0.012875) 3.1465(0.041196)3.14650.0411963.1465(0.041196) 0.63376(0.015324)0.633760.0153240.63376(0.015324)
Student 4.0369(0.0068883)4.03690.0068883-4.0369(0.0068883) 1.9903(0.0087614)1.99030.00876141.9903(0.0087614) 0.96466(0.013573)0.964660.0135730.96466(0.013573) 3.3839(0.050362)3.38390.0503623.3839(0.050362) 0.58314(0.018703)0.583140.0187030.58314(0.018703)
Female 4.0971(0.011542)4.09710.011542-4.0971(0.011542) 2.1747(0.014967)2.17470.0149672.1747(0.014967) 1.1435(0.023846)1.14350.0238461.1435(0.023846) 3.1707(0.083632)3.17070.0836323.1707(0.083632) 0.58128(0.033008)0.581280.0330080.58128(0.033008)
Male 4.0007(0.011566)4.00070.011566-4.0007(0.011566) 1.8768(0.016042)1.87680.0160421.8768(0.016042) 1.0069(0.027116)1.00690.0271161.0069(0.027116) 3.2853(0.080941)3.28530.0809413.2853(0.080941) 0.68168(0.028132)0.681680.0281320.68168(0.028132)
Smith 606060 Edge Year Residence High School Major
Full 4.5226(0.0048951)4.52260.0048951-4.5226(0.0048951) 1.44(0.0070185)1.440.00701851.44(0.0070185) 3.0814(0.0086746)3.08140.00867463.0814(0.0086746) 3.8(0.049519)3.80.0495193.8(0.049519) 0.93814(0.013074)0.938140.0130740.93814(0.013074)
Student 4.5565(0.0064751)4.55650.0064751-4.5565(0.0064751) 1.4702(0.008444)1.47020.0084441.4702(0.008444) 3.065(0.010562)3.0650.0105623.065(0.010562) 4.0877(0.062345)4.08770.0623454.0877(0.062345) 0.86763(0.017044)0.867630.0170440.86763(0.017044)
Female 4.6143(0.0058739)4.61430.0058739-4.6143(0.0058739) 1.5123(0.0079156)1.51230.00791561.5123(0.0079156) 3.1297(0.009554)3.12970.0095543.1297(0.009554) 3.9079(0.054194)3.90790.0541943.9079(0.054194) 0.94156(0.01446)0.941560.014460.94156(0.01446)
Male NA NA NA NA NA
USFCA 727272 Edge Year Residence High School Major
Full 4.6268(0.0058034)4.62680.0058034-4.6268(0.0058034) 1.6115(0.0083192)1.61150.00831921.6115(0.0083192) 0.90162(0.011441)0.901620.0114410.90162(0.011441) 3.1032(0.031585)3.10320.0315853.1032(0.031585) 0.66308(0.011574)0.663080.0115740.66308(0.011574)
Student 4.6201(0.0064663)4.62010.0064663-4.6201(0.0064663) 1.6342(0.0088723)1.63420.00887231.6342(0.0088723) 0.8675(0.01168)0.86750.011680.8675(0.01168) 3.2174(0.033997)3.21740.0339973.2174(0.033997) 0.629(0.012479)0.6290.0124790.629(0.012479)
Female 4.7401(0.0097375)4.74010.0097375-4.7401(0.0097375) 1.6713(0.013044)1.67130.0130441.6713(0.013044) 0.99928(0.016643)0.999280.0166430.99928(0.016643) 3.3412(0.044919)3.34120.0449193.3412(0.044919) 0.83048(0.017243)0.830480.0172430.83048(0.017243)
Male 4.3531(0.018115)4.35310.018115-4.3531(0.018115) 1.6391(0.025116)1.63910.0251161.6391(0.025116) 0.96613(0.033156)0.966130.0331560.96613(0.033156) 2.7253(0.088089)2.72530.0880892.7253(0.088089) 0.41582(0.032116)0.415820.0321160.41582(0.032116)
Haverford 767676 Edge Year Residence High School Major
Full 3.4051(0.0060883)3.40510.0060883-3.4051(0.0060883) 1.7879(0.0088662)1.78790.00886621.7879(0.0088662) 0.45404(0.011702)0.454040.0117020.45404(0.011702) 2.9137(0.07691)2.91370.076912.9137(0.07691) 0.64285(0.019116)0.642850.0191160.64285(0.019116)
Student 3.2009(0.0074664)3.20090.0074664-3.2009(0.0074664) 1.6081(0.0099901)1.60810.00999011.6081(0.0099901) 0.39078(0.012184)0.390780.0121840.39078(0.012184) 3.0223(0.092203)3.02230.0922033.0223(0.092203) 0.51009(0.02355)0.510090.023550.51009(0.02355)
Female 3.3442(0.011877)3.34420.011877-3.3442(0.011877) 1.9069(0.016546)1.90690.0165461.9069(0.016546) 0.42992(0.022171)0.429920.0221710.42992(0.022171) 2.9156(0.14531)2.91560.145312.9156(0.14531) 0.59125(0.034678)0.591250.0346780.59125(0.034678)
Male 3.2342(0.013433)3.23420.013433-3.2342(0.013433) 1.5054(0.020176)1.50540.0201761.5054(0.020176) 0.44079(0.02505)0.440790.025050.44079(0.02505) 2.9901(0.16665)2.99010.166652.9901(0.16665) 0.62004(0.040993)0.620040.0409930.62004(0.040993)
Simmons 818181 Edge Year Residence High School Major
Full 4.2939(0.0087542)4.29390.0087542-4.2939(0.0087542) 1.9127(0.011746)1.91270.0117461.9127(0.011746) 0.71252(0.017391)0.712520.0173910.71252(0.017391) 3.1819(0.061849)3.18190.0618493.1819(0.061849) 0.95847(0.019342)0.958470.0193420.95847(0.019342)
Student 4.2823(0.010262)4.28230.010262-4.2823(0.010262) 1.941(0.013004)1.9410.0130041.941(0.013004) 0.67853(0.017657)0.678530.0176570.67853(0.017657) 3.2452(0.06925)3.24520.069253.2452(0.06925) 0.93096(0.021004)0.930960.0210040.93096(0.021004)
Female 4.266(0.0093971)4.2660.0093971-4.266(0.0093971) 1.8995(0.01233)1.89950.012331.8995(0.01233) 0.69221(0.017762)0.692210.0177620.69221(0.017762) 3.16(0.063873)3.160.0638733.16(0.063873) 0.93484(0.019949)0.934840.0199490.93484(0.019949)
Male NA NA NA NA NA
Vassar 858585 Edge Year Residence High School Major
Full 4.4257(0.0045202)4.42570.0045202-4.4257(0.0045202) 1.813(0.0060722)1.8130.00607221.813(0.0060722) 1.3142(0.007704)1.31420.0077041.3142(0.007704) 3.4271(0.039439)3.42710.0394393.4271(0.039439) 0.92801(0.012093)0.928010.0120930.92801(0.012093)
Student 4.3601(0.0058449)4.36010.0058449-4.3601(0.0058449) 1.7041(0.0072602)1.70410.00726021.7041(0.0072602) 1.4151(0.0083399)1.41510.00833991.4151(0.0083399) 3.7486(0.049088)3.74860.0490883.7486(0.049088) 0.79613(0.015441)0.796130.0154410.79613(0.015441)
Female 4.582(0.0088969)4.5820.0088969-4.582(0.0088969) 1.9572(0.011179)1.95720.0111791.9572(0.011179) 1.3373(0.013584)1.33730.0135841.3373(0.013584) 3.7342(0.0691)3.73420.06913.7342(0.0691) 0.8989(0.021542)0.89890.0215420.8989(0.021542)
Male 4.195(0.011564)4.1950.011564-4.195(0.011564) 1.5908(0.015975)1.59080.0159751.5908(0.015975) 1.2077(0.020043)1.20770.0200431.2077(0.020043) 3.1518(0.093015)3.15180.0930153.1518(0.093015) 1.0176(0.028251)1.01760.0282511.0176(0.028251)
Reed 989898 Edge Year Residence High School Major
Full 3.6205(0.0099372)3.62050.0099372-3.6205(0.0099372) 1.5(0.015705)1.50.0157051.5(0.015705) 1.4399(0.033769)1.43990.0337691.4399(0.033769) 2.9666(0.14784)2.96660.147842.9666(0.14784) 0.78979(0.029502)0.789790.0295020.78979(0.029502)
Student 3.6229(0.012141)3.62290.012141-3.6229(0.012141) 1.4782(0.017725)1.47820.0177251.4782(0.017725) 1.4925(0.034523)1.49250.0345231.4925(0.034523) 3.0584(0.17396)3.05840.173963.0584(0.17396) 0.6773(0.035648)0.67730.0356480.6773(0.035648)
Female 3.6937(0.020247)3.69370.020247-3.6937(0.020247) 1.614(0.028894)1.6140.0288941.614(0.028894) 1.5385(0.060679)1.53850.0606791.5385(0.060679) 2.8801(0.24827)2.88010.248272.8801(0.24827) 0.86436(0.049343)0.864360.0493430.86436(0.049343)
Male 3.3999(0.025163)3.39990.025163-3.3999(0.025163) 1.3096(0.039777)1.30960.0397771.3096(0.039777) 1.2103(0.086745)1.21030.0867451.2103(0.086745) 3.2633(0.36283)3.26330.362833.2633(0.36283) 1.0037(0.067066)1.00370.0670661.0037(0.067066)
Trinity 100100100 Edge Year Residence High School Major
Full 4.1159(0.0046382)4.11590.0046382-4.1159(0.0046382) 2.0271(0.0063319)2.02710.00633192.0271(0.0063319) 0.77702(0.012227)0.777020.0122270.77702(0.012227) 3.1233(0.032458)3.12330.0324583.1233(0.032458) 0.80619(0.012694)0.806190.0126940.80619(0.012694)
Student 4.1318(0.0060873)4.13180.0060873-4.1318(0.0060873) 2.0143(0.0076607)2.01430.00766072.0143(0.0076607) 0.7988(0.01275)0.79880.012750.7988(0.01275) 3.4011(0.040157)3.40110.0401573.4011(0.040157) 0.71446(0.016092)0.714460.0160920.71446(0.016092)
Female 4.0764(0.0098017)4.07640.0098017-4.0764(0.0098017) 2.1975(0.012669)2.19750.0126692.1975(0.012669) 0.79113(0.022218)0.791130.0222180.79113(0.022218) 3.2724(0.067273)3.27240.0672733.2724(0.067273) 0.89966(0.025649)0.899660.0256490.89966(0.025649)
Male 4.0567(0.010444)4.05670.010444-4.0567(0.010444) 1.7776(0.014516)1.77760.0145161.7776(0.014516) 0.76933(0.027546)0.769330.0275460.76933(0.027546) 3.0224(0.060545)3.02240.0605453.0224(0.060545) 0.73818(0.024533)0.738180.0245330.73818(0.024533)
Table 4: ERGM coefficients for the model (described in the text) that combines density (edge) and triangle terms with nodematch contributions representing the increased propensity for two nodes with the same categorical value to have an edge connected between them. (This is calculated individually for Year, Residence, High School, and Major.) We give the standard error for each coefficient in parentheses. All coefficients are statistically significantly different from zero with p𝑝p-value less than 1×1041superscript1041\times 10^{-4}. Wellesley (22), Smith (60), and Simmons (81) are female-only institutions, so we list the values for their Male networks as NA.
Wellesley 222222 Edges Triangles Year Residence High School Major
Full 5.5166(0.29946)5.51660.29946-5.5166(0.29946) 0.18714(0.00040795)0.187140.000407950.18714(0.00040795) 1.0432(1.1574)1.04321.15741.0432(1.1574) 1.2079(0.014731)1.20790.0147311.2079(0.014731) 3.612(8.5012)3.6128.50123.612(8.5012) 0.58573(0.01648)0.585730.016480.58573(0.01648)
Student 5.395(0.40299)5.3950.40299-5.395(0.40299) 0.18873(0.00054665)0.188730.000546650.18873(0.00054665) 0.89815(0.93197)0.898150.931970.89815(0.93197) 1.262(0.83757)1.2620.837571.262(0.83757) 3.7139(8.9764)3.71398.97643.7139(8.9764) 0.44432(1.2761)0.444321.27610.44432(1.2761)
Female 5.5395(0.47528)5.53950.47528-5.5395(0.47528) 0.20854(0.00050963)0.208540.000509630.20854(0.00050963) 1.0713(0.70673)1.07130.706731.0713(0.70673) 1.2339(0.53312)1.23390.533121.2339(0.53312) 3.6698(6.0111)3.66986.01113.6698(6.0111) 0.61932(1.858)0.619321.8580.61932(1.858)
Male NA NA NA NA NA NA
Caltech 363636 Edges Triangles Year Residence High School Major
Full 4.9776(0.0013776)4.97760.0013776-4.9776(0.0013776) 0.17766(1.64e005)0.177661.64𝑒0050.17766(1.64e-005) 0.99434(0.0014976)0.994340.00149760.99434(0.0014976) 1.1638(0.0010284)1.16380.00102841.1638(0.0010284) 2.8536(0.087757)2.85360.0877572.8536(0.087757) 0.64673(0.0021013)0.646730.00210130.64673(0.0021013)
Student 4.8284(0.001786)4.82840.001786-4.8284(0.001786) 0.1836(1.89e005)0.18361.89𝑒0050.1836(1.89e-005) 0.89239(0.0017737)0.892390.00177370.89239(0.0017737) 1.2991(0.00098228)1.29910.000982281.2991(0.00098228) 3.0022(0.12434)3.00220.124343.0022(0.12434) 0.59894(0.001494)0.598940.0014940.59894(0.001494)
Female 4.5427(0.058123)4.54270.058123-4.5427(0.058123) 0.34325(0.0067684)0.343250.00676840.34325(0.0067684) 1.0623(0.016542)1.06230.0165421.0623(0.016542) 1.3504(0.035112)1.35040.0351121.3504(0.035112) 1.6776(0.099503)1.67760.0995031.6776(0.099503) 0.64556(0.011212)0.645560.0112120.64556(0.011212)
Male 4.9734(0.033352)4.97340.033352-4.9734(0.033352) 0.28127(0.0030727)0.281270.00307270.28127(0.0030727) 1.0405(0.036294)1.04050.0362941.0405(0.036294) 1.1781(0.039183)1.17810.0391831.1781(0.039183) 3.3862(0.25271)3.38620.252713.3862(0.25271) 0.61173(0.17517)0.611730.175170.61173(0.17517)
Williams 404040 Edges Triangles Year Residence High School Major
Full 5.3284(0.19432)5.32840.19432-5.3284(0.19432) 0.14604(0.00031271)0.146040.000312710.14604(0.00031271) 0.85073(0.0080651)0.850730.00806510.85073(0.0080651) 1.1718(0.82606)1.17180.826061.1718(0.82606) 3.5184(4.5405)3.51844.54053.5184(4.5405) 0.39443(0.42159)0.394430.421590.39443(0.42159)
Student 5.1347(0.24863)5.13470.24863-5.1347(0.24863) 0.16169(0.00043304)0.161690.000433040.16169(0.00043304) 0.60271(0.47267)0.602710.472670.60271(0.47267) 1.1717(0.94455)1.17170.944551.1717(0.94455) 3.7627(15.1999)3.762715.19993.7627(15.1999) 0.38077(1.3158)0.380771.31580.38077(1.3158)
Female 5.3368(0.013971)5.33680.013971-5.3368(0.013971) 0.28741(0.0012684)0.287410.00126840.28741(0.0012684) 0.89619(0.01105)0.896190.011050.89619(0.01105) 1.3187(0.0024651)1.31870.00246511.3187(0.0024651) 3.6318(0.13512)3.63180.135123.6318(0.13512) 0.45421(0.0031961)0.454210.00319610.45421(0.0031961)
Male 5.2602(0.014726)5.26020.014726-5.2602(0.014726) 0.26068(0.001206)0.260680.0012060.26068(0.001206) 1.0773(0.0035795)1.07730.00357951.0773(0.0035795) 1.1681(0.0051222)1.16810.00512221.1681(0.0051222) 3.4581(0.044289)3.45810.0442893.4581(0.044289) 0.31836(0.0021898)0.318360.00218980.31836(0.0021898)
Amherst 414141 Edges Triangles Year Residence High School Major
Full 5.0914(0.097866)5.09140.097866-5.0914(0.097866) 0.12103(0.00030109)0.121030.000301090.12103(0.00030109) 0.88125(0.30594)0.881250.305940.88125(0.30594) 0.88007(0.60964)0.880070.609640.88007(0.60964) 3.1539(2.531)3.15392.5313.1539(2.531) 0.5757(0.89419)0.57570.894190.5757(0.89419)
Student 4.9092(0.071772)4.90920.071772-4.9092(0.071772) 0.12695(0.011275)0.126950.0112750.12695(0.011275) 0.73901(0.18123)0.739010.181230.73901(0.18123) 0.94128(0.9257)0.941280.92570.94128(0.9257) 3.3902(3.3786)3.39023.37863.3902(3.3786) 0.53866(0.93067)0.538660.930670.53866(0.93067)
Female 5.0074(0.01569)5.00740.01569-5.0074(0.01569) 0.21904(0.0011268)0.219040.00112680.21904(0.0011268) 0.98463(0.018087)0.984630.0180870.98463(0.018087) 0.98007(1.1477)0.980071.14770.98007(1.1477) 3.3534(12.2931)3.353412.29313.3534(12.2931) 0.5091(0.47295)0.50910.472950.5091(0.47295)
Male 5.106(0.016455)5.1060.016455-5.106(0.016455) 0.24842(0.0013)0.248420.00130.24842(0.0013) 0.99941(0.019207)0.999410.0192070.99941(0.019207) 0.86681(0.006822)0.866810.0068220.86681(0.006822) 3.0624(0.12347)3.06240.123473.0624(0.12347) 0.5913(0.0030018)0.59130.00300180.5913(0.0030018)
Swarthmore 424242 Edges Triangles Year Residence High School Major
Full 4.8312(0.17358)4.83120.17358-4.8312(0.17358) 0.12423(0.016066)0.124230.0160660.12423(0.016066) 0.96422(0.26284)0.964220.262840.96422(0.26284) 0.79737(0.34465)0.797370.344650.79737(0.34465) 3.2278(11.7489)3.227811.74893.2278(11.7489) 0.63143(0.75281)0.631430.752810.63143(0.75281)
Student 4.698(0.011101)4.6980.011101-4.698(0.011101) 0.12352(8.09e005)0.123528.09𝑒0050.12352(8.09e-005) 0.85491(0.018375)0.854910.0183750.85491(0.018375) 0.85656(0.034037)0.856560.0340370.85656(0.034037) 3.5384(0.14695)3.53840.146953.5384(0.14695) 0.52548(0.014076)0.525480.0140760.52548(0.014076)
Female 4.7717(0.018696)4.77170.018696-4.7717(0.018696) 0.21474(0.0013858)0.214740.00138580.21474(0.0013858) 1.0746(0.00017492)1.07460.000174921.0746(0.00017492) 0.93786(0.0024781)0.937860.00247810.93786(0.0024781) 3.6738(0.38146)3.67380.381463.6738(0.38146) 0.49991(0.0025816)0.499910.00258160.49991(0.0025816)
Male 4.8247(0.019575)4.82470.019575-4.8247(0.019575) 0.24087(0.001571)0.240870.0015710.24087(0.001571) 0.98215(0.022589)0.982150.0225890.98215(0.022589) 0.6948(0.00082592)0.69480.000825920.6948(0.00082592) 2.8505(0.14226)2.85050.142262.8505(0.14226) 0.61786(0.003426)0.617860.0034260.61786(0.003426)
Oberlin 444444 Edges Triangles Year Residence High School Major
Full 5.3989(0.088183)5.39890.088183-5.3989(0.088183) 0.19739(0.015958)0.197390.0159580.19739(0.015958) 0.7668(0.42501)0.76680.425010.7668(0.42501) 1.1172(0.9797)1.11720.97971.1172(0.9797) 3.5716(69.9269)3.571669.92693.5716(69.9269) 0.4834(0.79777)0.48340.797770.4834(0.79777)
Student 5.3757(0.67096)5.37570.67096-5.3757(0.67096) 0.21399(0.00056897)0.213990.000568970.21399(0.00056897) 0.68832(1.9864)0.688321.98640.68832(1.9864) 1.1047(2.2993)1.10472.29931.1047(2.2993) 3.7576(66.9912)3.757666.99123.7576(66.9912) 0.66727(3.0137)0.667273.01370.66727(3.0137)
Female 5.4066(0.013259)5.40660.013259-5.4066(0.013259) 0.38758(0.0016842)0.387580.00168420.38758(0.0016842) 0.79641(0.097431)0.796410.0974310.79641(0.097431) 1.2488(3.0612)1.24883.06121.2488(3.0612) 3.7024(30.0234)3.702430.02343.7024(30.0234) 0.37583(0.90965)0.375830.909650.37583(0.90965)
Male 5.2834(0.016255)5.28340.016255-5.2834(0.016255) 0.39322(0.0021443)0.393220.00214430.39322(0.0021443) 0.8105(0.021123)0.81050.0211230.8105(0.021123) 1.0634(0.027757)1.06340.0277571.0634(0.027757) 3.3725(1.3266)3.37251.32663.3725(1.3266) 0.83047(0.018054)0.830470.0180540.83047(0.018054)
Middlebury 454545 Edges Triangles Year Residence High School Major
Full 5.5042(0.67137)5.50420.67137-5.5042(0.67137) 0.14939(0.07867)0.149390.078670.14939(0.07867) 0.98073(0.9038)0.980730.90380.98073(0.9038) 0.61487(1.2033)0.614871.20330.61487(1.2033) 3.7714(8.0401)3.77148.04013.7714(8.0401) 0.51794(5.4033)0.517945.40330.51794(5.4033)
Student 5.3837(0.77243)5.38370.77243-5.3837(0.77243) 0.15998(0.00039806)0.159980.000398060.15998(0.00039806) 0.79027(1.1441)0.790271.14410.79027(1.1441) 0.64183(0.9573)0.641830.95730.64183(0.9573) 4.0159(11.4279)4.015911.42794.0159(11.4279) 0.47678(2.1974)0.476782.19740.47678(2.1974)
Female 5.5484(0.0067934)5.54840.0067934-5.5484(0.0067934) 0.29748(0.0011819)0.297480.00118190.29748(0.0011819) 0.92112(0.026494)0.921120.0264940.92112(0.026494) 0.56416(0.0037157)0.564160.00371570.56416(0.0037157) 4.0895(0.086636)4.08950.0866364.0895(0.086636) 0.61937(0.020853)0.619370.0208530.61937(0.020853)
Male 5.4012(0.014882)5.40120.014882-5.4012(0.014882) 0.27717(3.31e006)0.277173.31𝑒0060.27717(3.31e-006) 1.165(0.01032)1.1650.010321.165(0.01032) 0.70103(0.023808)0.701030.0238080.70103(0.023808) 3.7024(0.051105)3.70240.0511053.7024(0.051105) 0.24567(0.0032737)0.245670.00327370.24567(0.0032737)
Hamilton 464646 Edges Triangles Year Residence High School Major
Full 5.1526(0.15758)5.15260.15758-5.1526(0.15758) 0.13229(0.010524)0.132290.0105240.13229(0.010524) 0.89247(0.38942)0.892470.389420.89247(0.38942) 0.60097(0.9291)0.600970.92910.60097(0.9291) 3.4533(2.764)3.45332.7643.4533(2.764) 0.57065(0.66635)0.570650.666350.57065(0.66635)
Student 5.0475(0.20987)5.04750.20987-5.0475(0.20987) 0.13542(0.00038928)0.135420.000389280.13542(0.00038928) 0.78719(0.39866)0.787190.398660.78719(0.39866) 0.61503(0.85391)0.615030.853910.61503(0.85391) 3.639(5.3808)3.6395.38083.639(5.3808) 0.52289(1.3097)0.522891.30970.52289(1.3097)
Female 5.1103(0.00025686)5.11030.00025686-5.1103(0.00025686) 0.22978(0.0010554)0.229780.00105540.22978(0.0010554) 0.91713(0.1191)0.917130.11910.91713(0.1191) 0.6133(0.99652)0.61330.996520.6133(0.99652) 3.5653(6.2228)3.56536.22283.5653(6.2228) 0.71784(0.30967)0.717840.309670.71784(0.30967)
Male 5.2164(0.017572)5.21640.017572-5.2164(0.017572) 0.25379(0.0012891)0.253790.00128910.25379(0.0012891) 1.1662(0.019208)1.16620.0192081.1662(0.019208) 0.81602(0.0043879)0.816020.00438790.81602(0.0043879) 3.6524(0.13302)3.65240.133023.6524(0.13302) 0.26404(0.0025362)0.264040.00253620.26404(0.0025362)
Bowdoin 474747 Edges Triangles Year Residence High School Major
Full 5.1231(0.49764)5.12310.49764-5.1231(0.49764) 0.12537(0.0003663)0.125370.00036630.12537(0.0003663) 0.84602(0.44413)0.846020.444130.84602(0.44413) 0.86002(1.7887)0.860021.78870.86002(1.7887) 3.5147(14.3023)3.514714.30233.5147(14.3023) 0.53053(1.4671)0.530531.46710.53053(1.4671)
Student 4.9871(0.17599)4.98710.17599-4.9871(0.17599) 0.13258(0.0004469)0.132580.00044690.13258(0.0004469) 0.73847(0.010887)0.738470.0108870.73847(0.010887) 0.9108(0.85058)0.91080.850580.9108(0.85058) 3.7404(2.129)3.74042.1293.7404(2.129) 0.48614(0.94847)0.486140.948470.48614(0.94847)
Female 5.1156(0.00099468)5.11560.00099468-5.1156(0.00099468) 0.2751(0.00149)0.27510.001490.2751(0.00149) 0.89048(0.0045874)0.890480.00458740.89048(0.0045874) 0.96132(0.015526)0.961320.0155260.96132(0.015526) 3.6624(0.068102)3.66240.0681023.6624(0.068102) 0.62781(0.0045592)0.627810.00455920.62781(0.0045592)
Male 5.2312(0.00035892)5.23120.00035892-5.2312(0.00035892) 0.28383(0.0015608)0.283830.00156080.28383(0.0015608) 1.1377(0.00064391)1.13770.000643911.1377(0.00064391) 0.81674(0.0047172)0.816740.00471720.81674(0.0047172) 3.7484(0.056753)3.74840.0567533.7484(0.056753) 0.405(0.0021074)0.4050.00210740.405(0.0021074)
Smith 606060 Edges Triangles Year Residence High School Major
Full 5.7499(0.46896)5.74990.46896-5.7499(0.46896) 0.23032(0.040735)0.230320.0407350.23032(0.040735) 1.0244(0.71782)1.02440.717821.0244(0.71782) 1.318(1.7496)1.3181.74961.318(1.7496) 4.3908(27.5879)4.390827.58794.3908(27.5879) 0.95945(1.1995)0.959451.19950.95945(1.1995)
Student 5.6751(0.35105)5.67510.35105-5.6751(0.35105) 0.25538(0.00069)0.255380.000690.25538(0.00069) 0.87631(0.61986)0.876310.619860.87631(0.61986) 1.4951(1.5255)1.49511.52551.4951(1.5255) 4.6639(26.1729)4.663926.17294.6639(26.1729) 0.96959(1.0772)0.969591.07720.96959(1.0772)
Female 5.7559(0.14784)5.75590.14784-5.7559(0.14784) 0.28145(0.0054268)0.281450.00542680.28145(0.0054268) 1.0443(0.22894)1.04430.228941.0443(0.22894) 1.2561(0.53313)1.25610.533131.2561(0.53313) 4.466(6.4417)4.4666.44174.466(6.4417) 0.96695(0.7678)0.966950.76780.96695(0.7678)
Male NA NA NA NA NA NA
USFCA 727272 Edges Triangles Year Residence High School Major
Full 5.5339(0.08133)5.53390.08133-5.5339(0.08133) 0.21369(0.019896)0.213690.0198960.21369(0.019896) 0.81903(0.31274)0.819030.312740.81903(0.31274) 0.75232(0.48257)0.752320.482570.75232(0.48257) 3.3646(3.7542)3.36463.75423.3646(3.7542) 0.65908(0.40194)0.659080.401940.65908(0.40194)
Student 5.4978(0.4816)5.49780.4816-5.4978(0.4816) 0.218(0.00060193)0.2180.000601930.218(0.00060193) 0.77135(0.20243)0.771350.202430.77135(0.20243) 0.75418(0.5606)0.754180.56060.75418(0.5606) 3.4592(2.2951)3.45922.29513.4592(2.2951) 0.61892(0.66365)0.618920.663650.61892(0.66365)
Female 5.6942(0.013524)5.69420.013524-5.6942(0.013524) 0.31715(0.0013151)0.317150.00131510.31715(0.0013151) 1.0311(0.016106)1.03110.0161061.0311(0.016106) 0.85946(0.031407)0.859460.0314070.85946(0.031407) 3.5978(0.072184)3.59780.0721843.5978(0.072184) 0.78521(0.0056399)0.785210.00563990.78521(0.0056399)
Male 5.2138(0.024502)5.21380.024502-5.2138(0.024502) 0.4218(0.0034552)0.42180.00345520.4218(0.0034552) 0.71035(0.032585)0.710350.0325850.71035(0.032585) 0.74138(0.0012662)0.741380.00126620.74138(0.0012662) 3.0314(0.020408)3.03140.0204083.0314(0.020408) 0.41939(0.00063143)0.419390.000631430.41939(0.00063143)
Haverford 767676 Edges Triangles Year Residence High School Major
Full 4.5864(0.17922)4.58640.17922-4.5864(0.17922) 0.099312(0.00033645)0.0993120.000336450.099312(0.00033645) 0.88251(0.36604)0.882510.366040.88251(0.36604) 0.4303(0.49797)0.43030.497970.4303(0.49797) 3.4762(5.3548)3.47625.35483.4762(5.3548) 0.68087(0.86129)0.680870.861290.68087(0.86129)
Student 4.5248(0.011488)4.52480.011488-4.5248(0.011488) 0.097998(0.00038937)0.0979980.000389370.097998(0.00038937) 0.8307(0.012088)0.83070.0120880.8307(0.012088) 0.50822(0.027194)0.508220.0271940.50822(0.027194) 3.6771(0.19927)3.67710.199273.6771(0.19927) 0.54286(0.016676)0.542860.0166760.54286(0.016676)
Female 4.5842(0.018029)4.58420.018029-4.5842(0.018029) 0.18037(0.0011641)0.180370.00116410.18037(0.0011641) 0.83102(0.020477)0.831020.0204770.83102(0.020477) 0.45689(0.026914)0.456890.0269140.45689(0.026914) 3.5413(0.15545)3.54130.155453.5413(0.15545) 0.60269(0.04109)0.602690.041090.60269(0.04109)
Male 4.5974(0.021694)4.59740.021694-4.5974(0.021694) 0.20668(0.0015226)0.206680.00152260.20668(0.0015226) 1.0335(0.024614)1.03350.0246141.0335(0.024614) 0.47377(0.00061681)0.473770.000616810.47377(0.00061681) 3.5159(0.26688)3.51590.266883.5159(0.26688) 0.66119(0.0035633)0.661190.00356330.66119(0.0035633)
Simmons 818181 Edges Triangles Year Residence High School Major
Full 5.1447(0.011497)5.14470.011497-5.1447(0.011497) 0.2364(0.00096724)0.23640.000967240.2364(0.00096724) 0.62361(0.015007)0.623610.0150070.62361(0.015007) 0.04641(0.022947)0.046410.0229470.04641(0.022947) 3.6491(0.066845)3.64910.0668453.6491(0.066845) 0.95822(0.006254)0.958220.0062540.95822(0.006254)
Student 5.0396(0.012814)5.03960.012814-5.0396(0.012814) 0.23882(0.0001411)0.238820.00014110.23882(0.0001411) 0.52922(0.01664)0.529220.016640.52922(0.01664) 0.017321(0.093667)0.0173210.0936670.017321(0.093667) 3.6926(0.16704)3.69260.167043.6926(0.16704) 0.88137(0.012457)0.881370.0124570.88137(0.012457)
Female 5.0919(0.012148)5.09190.012148-5.0919(0.012148) 0.23884(0.00075486)0.238840.000754860.23884(0.00075486) 0.61268(0.0044493)0.612680.00444930.61268(0.0044493) 0.0096188(0.026243)0.00961880.0262430.0096188(0.026243) 3.6168(0.099064)3.61680.0990643.6168(0.099064) 0.94789(0.0039044)0.947890.00390440.94789(0.0039044)
Male NA NA NA NA NA NA
Vassar 858585 Edges Triangles Year Residence High School Major
Full 5.4365(0.042913)5.43650.042913-5.4365(0.042913) 0.16286(0.00033258)0.162860.000332580.16286(0.00033258) 0.89224(0.36023)0.892240.360230.89224(0.36023) 1.0009(1.5575)1.00091.55751.0009(1.5575) 3.8325(13.4455)3.832513.44553.8325(13.4455) 0.76399(0.83096)0.763990.830960.76399(0.83096)
Student 5.3447(0.66641)5.34470.66641-5.3447(0.66641) 0.1653(0.0004181)0.16530.00041810.1653(0.0004181) 0.78236(1.1368)0.782361.13680.78236(1.1368) 1.0869(0.73536)1.08690.735361.0869(0.73536) 4.1626(2.7852)4.16262.78524.1626(2.7852) 0.66064(1.1939)0.660641.19390.66064(1.1939)
Female 5.4876(0.01176)5.48760.01176-5.4876(0.01176) 0.31638(9.93e005)0.316389.93𝑒0050.31638(9.93e-005) 0.85905(0.013732)0.859050.0137320.85905(0.013732) 1.0423(0.0013954)1.04230.00139541.0423(0.0013954) 4.0763(0.073194)4.07630.0731944.0763(0.073194) 0.77276(0.033551)0.772760.0335510.77276(0.033551)
Male 5.2473(0.016541)5.24730.016541-5.2473(0.016541) 0.31715(0.0017542)0.317150.00175420.31715(0.0017542) 1.0972(0.019096)1.09720.0190961.0972(0.019096) 1.0899(0.024127)1.08990.0241271.0899(0.024127) 3.5254(0.05049)3.52540.050493.5254(0.05049) 0.71203(0.0019611)0.712030.00196110.71203(0.0019611)
Reed 989898 Edges Triangles Year Residence High School Major
Full 4.7342(0.014847)4.73420.014847-4.7342(0.014847) 0.19271(0.0010667)0.192710.00106670.19271(0.0010667) 0.89641(0.019018)0.896410.0190180.89641(0.019018) 1.5839(0.41431)1.58390.414311.5839(0.41431) 3.4991(10.8338)3.499110.83383.4991(10.8338) 0.94969(0.24672)0.949690.246720.94969(0.24672)
Student 4.6732(0.017455)4.67320.017455-4.6732(0.017455) 0.20779(0.0013555)0.207790.00135550.20779(0.0013555) 0.81768(0.021382)0.817680.0213820.81768(0.021382) 1.586(0.040154)1.5860.0401541.586(0.040154) 3.5945(0.18597)3.59450.185973.5945(0.18597) 0.80753(0.04143)0.807530.041430.80753(0.04143)
Female 4.7287(0.028907)4.72870.028907-4.7287(0.028907) 0.34763(0.0037349)0.347630.00373490.34763(0.0037349) 0.97335(0.034508)0.973350.0345080.97335(0.034508) 1.7788(0.0037734)1.77880.00377341.7788(0.0037734) 3.3521(0.12521)3.35210.125213.3521(0.12521) 0.8996(0.0035483)0.89960.00354830.8996(0.0035483)
Male 4.4269(0.036284)4.42690.036284-4.4269(0.036284) 0.38754(0.0057624)0.387540.00576240.38754(0.0057624) 0.81151(0.047624)0.811510.0476240.81151(0.047624) 1.2315(0.005725)1.23150.0057251.2315(0.005725) 3.9308(0.15859)3.93080.158593.9308(0.15859) 0.96303(0.0026607)0.963030.00266070.96303(0.0026607)
Trinity 100100100 Edges Triangles Year Residence High School Major
Full 5.2594(0.50302)5.25940.50302-5.2594(0.50302) 0.13124(0.067744)0.131240.0677440.13124(0.067744) 0.88149(1.0778)0.881491.07780.88149(1.0778) 0.81391(1.9123)0.813911.91230.81391(1.9123) 3.5938(3.3991)3.59383.39913.5938(3.3991) 0.62169(1.5141)0.621691.51410.62169(1.5141)
Student 5.144(0.82673)5.1440.82673-5.144(0.82673) 0.13839(0.030441)0.138390.0304410.13839(0.030441) 0.66726(0.81806)0.667260.818060.66726(0.81806) 0.86642(1.6612)0.866421.66120.86642(1.6612) 3.7899(23.8254)3.789923.82543.7899(23.8254) 0.57219(1.6865)0.572191.68650.57219(1.6865)
Female 5.2108(0.014321)5.21080.014321-5.2108(0.014321) 0.21239(0.00096177)0.212390.000961770.21239(0.00096177) 1.1086(0.016232)1.10860.0162321.1086(0.016232) 0.78131(0.0033131)0.781310.00331310.78131(0.0033131) 3.8014(0.056335)3.80140.0563353.8014(0.056335) 0.75326(0.0233)0.753260.02330.75326(0.0233)
Male 5.3106(4.73e006)5.31064.73𝑒006-5.3106(4.73e-006) 0.27532(0.0013436)0.275320.00134360.27532(0.0013436) 1.1575(0.26773)1.15750.267731.1575(0.26773) 0.92286(7.0628)0.922867.06280.92286(7.0628) 3.5167(22.874)3.516722.8743.5167(22.874) 0.53424(0.6823)0.534240.68230.53424(0.6823)
Table 5: Maximum z𝑧z-scores of the Rand coefficient obtained for the 6 employed community detection algorithms (see the discussion in the text) for each categorical variable in every network (Full, Student, Female, and Male) for each of the 100 institutions. We italicize z𝑧z-scores that are less than 2. We divide the table into five parts: (1) networks in which High School yields the highest z𝑧z-score, (2) networks in which Residence yields the highest z𝑧z-score, (3) networks in which Year yields the highest z𝑧z-score and High School yields the second highest z𝑧z-score, (4) networks in which Year yields the highest z𝑧z-score and Major yields the second highest z𝑧z-score, and (5) networks in which Year yields the highest z𝑧z-score and Residence yields the second highest z𝑧z-score.
Institution and Network Major Residence Graduation Year High School
High School:
Auburn 71 Male 37.689337.689337.6893 14.849714.849714.8497 42.778442.778442.7784 70.677670.677670.6776
Tennessee 95 Male 15.674115.674115.6741 20.403420.403420.4034 42.801942.801942.8019 58.550858.550858.5508
Residence:
Rice 31 Full 15.312315.312315.3123 1404.45021404.45021404.4502 196.14196.14196.14 4.38584.38584.3858
Caltech 36 Full 4.06494.06494.0649 222.9566222.9566222.9566 8.59678.59678.5967 4.90784.90784.9078
UCSC 68 Full 36.788936.788936.7889 945.8502945.8502945.8502 481.3222481.3222481.3222 10.304310.304310.3043
Rice 31 Student 19.267719.267719.2677 1523.44231523.44231523.4423 137.8101137.8101137.8101 1.62531.6253\mathit{1.6253}
Caltech 36 Student 3.07623.07623.0762 202.1448202.1448202.1448 13.792913.792913.7929 6.3036.3036.303
UCSC 68 Student 28.884328.884328.8843 1240.12191240.12191240.1219 584.0597584.0597584.0597 5.71075.71075.7107
Rice 31 Female 4.9124.9124.912 882.3474882.3474882.3474 45.633245.633245.6332 2.97732.97732.9773
Caltech 36 Female 1.47881.4788\mathit{1.4788} 74.198874.198874.1988 7.68527.68527.6852 1.26371.2637\mathit{1.2637}
UCSC 68 Female 24.651724.651724.6517 558.2736558.2736558.2736 315.4706315.4706315.4706 6.3386.3386.338
Auburn 71 Female 11.01111.01111.011 62.31662.31662.316 14.455114.455114.4551 33.967333.967333.9673
Rice 31 Male 13.904613.904613.9046 703.6264703.6264703.6264 30.549130.549130.5491 2.30492.30492.3049
Caltech 36 Male 3.32163.32163.3216 168.4986168.4986168.4986 7.78927.78927.7892 1.06721.0672\mathit{1.0672}
Notre Dame 57 Male 15.001415.001415.0014 881.5186881.5186881.5186 301.8338301.8338301.8338 8.42778.42778.4277
UCSC 68 Male 23.49723.49723.497 421.0489421.0489421.0489 185.544185.544185.544 6.08516.08516.0851
Year then High School:
Harvard 1 Full 32.928332.928332.9283 46.251546.251546.2515 707.9697707.9697707.9697 47.442447.442447.4424
USF 51 Full 13.216813.216813.2168 17.096217.096217.0962 178.794178.794178.794 19.133319.133319.1333
Tennessee 95 Student 23.906723.906723.9067 78.873878.873878.8738 486.6029486.6029486.6029 86.665386.665386.6653
USF 51 Female 6.4846.4846.484 10.197110.197110.1971 105.5474105.5474105.5474 24.193324.193324.1933
UCF 52 Female 13.029113.029113.0291 11.012711.012711.0127 349.4409349.4409349.4409 24.350124.350124.3501
MSU 24 Male 15.521715.521715.5217 11.458611.458611.4586 105.1908105.1908105.1908 31.438131.438131.4381
USF 51 Male 9.94739.94739.9473 17.623717.623717.6237 133.8587133.8587133.8587 29.916229.916229.9162
UCF 52 Male 6.00266.00266.0026 22.867922.867922.8679 135.8974135.8974135.8974 30.237430.237430.2374
Maine 59 Male 14.671414.671414.6714 13.51713.51713.517 31.831931.831931.8319 24.519324.519324.5193
Smith 60 Male 14.671414.671414.6714 13.51713.51713.517 31.831931.831931.8319 24.519324.519324.5193
Year then Major:
Northwestern 25 Full 63.725563.725563.7255 61.967361.967361.9673 952.1696952.1696952.1696 17.749317.749317.7493
Oberlin 44 Full 98.138898.138898.1388 66.865466.865466.8654 453.1168453.1168453.1168 5.79395.79395.7939
Carnegie 49 Full 51.359951.359951.3599 25.813825.813825.8138 731.3975731.3975731.3975 7.89627.89627.8962
Johns Hopkins 55 Full 47.199547.199547.1995 42.815442.815442.8154 691.5817691.5817691.5817 4.83424.83424.8342
Maine 59 Full 19.724719.724719.7247 19.429319.429319.4293 294.1129294.1129294.1129 17.884517.884517.8845
MU 78 Full 109.3402109.3402109.3402 83.322883.322883.3228 2156.44692156.44692156.4469 11.86411.86411.864
Texas 84 Full 75.986875.986875.9868 66.892366.892366.8923 942.1053942.1053942.1053 18.332818.332818.3328
Pepperdine 86 Full 19.758719.758719.7587 16.120916.120916.1209 514.1583514.1583514.1583 2.68472.68472.6847
Rutgers 89 Full 65.598165.598165.5981 58.130258.130258.1302 1006.33211006.33211006.3321 15.064615.064615.0646
Yale 4 Student 43.707243.707243.7072 42.917442.917442.9174 1749.19951749.19951749.1995 12.44312.44312.443
Wellesley 22 Student 32.935932.935932.9359 18.291418.291418.2914 604.0402604.0402604.0402 11.395911.395911.3959
Northwestern 25 Student 56.721656.721656.7216 43.736443.736443.7364 761.809761.809761.809 11.873311.873311.8733
Oberlin 44 Student 121.7061121.7061121.7061 97.776897.776897.7768 422.8126422.8126422.8126 5.40975.40975.4097
Middlebury 45 Student 35.731135.731135.7311 25.188725.188725.1887 1021.12591021.12591021.1259 10.169410.169410.1694
Carnegie 49 Student 58.770958.770958.7709 28.114628.114628.1146 678.5146678.5146678.5146 4.20954.20954.2095
Johns Hopkins 55 Student 51.5951.5951.59 46.861846.861846.8618 977.8851977.8851977.8851 1.02341.0234\mathit{1.0234}
Maine 59 Student 18.127818.127818.1278 6.84576.84576.8457 198.4138198.4138198.4138 12.007812.007812.0078
Texas 84 Student 59.736259.736259.7362 40.154340.154340.1543 627.1121627.1121627.1121 11.344711.344711.3447
Rutgers 89 Student 54.932954.932954.9329 46.329546.329546.3295 854.1174854.1174854.1174 6.11416.11416.1141
Harvard 1 Female 49.82449.82449.824 46.03546.03546.035 594.5535594.5535594.5535 36.259636.259636.2596
Stanford 3 Female 49.203349.203349.2033 29.957929.957929.9579 402.8892402.8892402.8892 14.106914.106914.1069
Yale 4 Female 44.014244.014244.0142 27.476427.476427.4764 919.2215919.2215919.2215 6.84576.84576.8457
Berkeley 13 Female 46.168546.168546.1685 30.44330.44330.443 886.1622886.1622886.1622 5.04675.04675.0467
Duke 14 Female 54.499354.499354.4993 54.210354.210354.2103 817.5276817.5276817.5276 8.86878.86878.8687
UVA 16 Female 66.757266.757266.7572 52.410352.410352.4103 657.0101657.0101657.0101 9.91629.91629.9162
Northwestern 25 Female 32.165932.165932.1659 29.6929.6929.69 434.8702434.8702434.8702 2.84022.84022.8402
UChicago 30 Female 33.208933.208933.2089 23.690923.690923.6909 438.7235438.7235438.7235 4.79794.79794.7979
Amherst 41 Female 27.328827.328827.3288 21.74321.74321.743 294.6258294.6258294.6258 3.5073.5073.507
Oberlin 44 Female 100.2134100.2134100.2134 48.268448.268448.2684 260.1137260.1137260.1137 3.4553.4553.455
Carnegie 49 Female 47.492947.492947.4929 40.365140.365140.3651 407.0773407.0773407.0773 4.21534.21534.2153
Johns Hopkins 55 Female 28.4728.4728.47 20.269720.269720.2697 333.9934333.9934333.9934 3.42393.42393.4239
Maryland 58 Female 44.133844.133844.1338 41.546941.546941.5469 822.4117822.4117822.4117 17.881817.881817.8818
Maine 59 Female 38.341638.341638.3416 20.804120.804120.8041 200.7833200.7833200.7833 31.341331.341331.3413
UC 61 Female 28.521528.521528.5215 14.38514.38514.385 622.9345622.9345622.9345 5.82065.82065.8206
UC 64 Female 14.413914.413914.4139 11.966411.966411.9664 149.0986149.0986149.0986 10.925610.925610.9256
JMU 79 Female 36.102436.102436.1024 363636 796.4756796.4756796.4756 4.2014.2014.201
Bingham 82 Female 22.364822.364822.3648 21.32121.32121.321 284.0935284.0935284.0935 15.061615.061615.0616
Temple 83 Female 46.128646.128646.1286 31.365331.365331.3653 757.509757.509757.509 9.93229.93229.9322
Rutgers 89 Female 53.823853.823853.8238 16.188116.188116.1881 488.0149488.0149488.0149 14.852214.852214.8522
UConn 91 Female 34.967234.967234.9672 25.495125.495125.4951 723.1034723.1034723.1034 10.551710.551710.5517
Penn 94 Female 39.986439.986439.9864 26.905926.905926.9059 936.2613936.2613936.2613 27.016527.016527.0165
Stanford 3 Male 54.173754.173754.1737 27.492127.492127.4921 371.1569371.1569371.1569 16.565616.565616.5656
Yale 4 Male 24.896724.896724.8967 23.382123.382123.3821 370.9076370.9076370.9076 8.678.678.67
NYU 9 Male 94.414394.414394.4143 54.104554.104554.1045 1021.78621021.78621021.7862 6.57016.57016.5701
UIllinios 20 Male 46.314446.314446.3144 31.559831.559831.5598 336.3754336.3754336.3754 28.421828.421828.4218
UF 21 Male 23.116523.116523.1165 22.945222.945222.9452 507.6766507.6766507.6766 20.27220.27220.272
Wellesley 22 Male 23.116523.116523.1165 22.945222.945222.9452 507.6766507.6766507.6766 20.27220.27220.272
Northwestern 25 Male 37.730737.730737.7307 31.906231.906231.9062 345.6295345.6295345.6295 6.67826.67826.6782
UC 33 Male 22.166522.166522.1665 20.038520.038520.0385 567.4739567.4739567.4739 7.61477.61477.6147
Oberlin 44 Male 72.422472.422472.4224 27.913827.913827.9138 101.0428101.0428101.0428 3.29153.29153.2915
Carnegie 49 Male 36.668436.668436.6684 25.760825.760825.7608 387.3158387.3158387.3158 5.47155.47155.4715
FSU 53 Male 29.394329.394329.3943 10.541610.541610.5416 287.6117287.6117287.6117 12.041512.041512.0415
Johns Hopkins 55 Male 58.202258.202258.2022 34.305734.305734.3057 407.8593407.8593407.8593 3.09923.09923.0992
Syracuse 56 Male 25.751125.751125.7511 11.402811.402811.4028 336.2923336.2923336.2923 3.68383.68383.6838
Virginia 63 Male 26.333826.333826.3338 6.23086.23086.2308 407.6451407.6451407.6451 10.169110.169110.1691
MU 78 Male 29.74829.74829.748 19.222819.222819.2228 399.0186399.0186399.0186 7.65447.65447.6544
JMU 79 Male 28.133828.133828.1338 18.006818.006818.0068 384.1443384.1443384.1443 2.68072.68072.6807
Texas 80 Male 43.580643.580643.5806 34.411934.411934.4119 304.2728304.2728304.2728 22.408922.408922.4089
Simmons 81 Male 43.580643.580643.5806 34.411934.411934.4119 304.2728304.2728304.2728 22.408922.408922.4089
Bingham 82 Male 15.107115.107115.1071 13.470113.470113.4701 256.2084256.2084256.2084 9.20089.20089.2008
Temple 83 Male 28.346728.346728.3467 19.858319.858319.8583 384.461384.461384.461 5.19585.19585.1958
Texas 84 Male 66.481166.481166.4811 18.909818.909818.9098 411.8199411.8199411.8199 11.594911.594911.5949
Pepperdine 86 Male 16.505616.505616.5056 14.935914.935914.9359 252.9983252.9983252.9983 0.165110.16511\mathit{-0.16511}
Rutgers 89 Male 48.829648.829648.8296 15.510715.510715.5107 380.7912380.7912380.7912 12.656512.656512.6565
UMass 92 Male 33.254933.254933.2549 30.872730.872730.8727 355.3603355.3603355.3603 3.05833.05833.0583
Penn 94 Male 38.491738.491738.4917 5.87355.87355.8735 658.7507658.7507658.7507 26.360126.360126.3601
Year then Residence:
Columbia 2 Full 36.515336.515336.5153 54.92454.92454.924 1374.30831374.30831374.3083 7.22937.22937.2293
Stanford 3 Full 14.786314.786314.7863 41.915441.915441.9154 664.1124664.1124664.1124 29.968629.968629.9686
Yale 4 Full 20.511720.511720.5117 25.120525.120525.1205 1099.42331099.42331099.4233 11.899811.899811.8998
Cornell 5 Full 25.250625.250625.2506 89.587889.587889.5878 1593.18041593.18041593.1804 21.278121.278121.2781
Dartmouth 6 Full 11.102711.102711.1027 50.137750.137750.1377 1020.23181020.23181020.2318 28.970428.970428.9704
UPenn 7 Full 20.368920.368920.3689 95.798195.798195.7981 1923.5271923.5271923.527 44.289644.289644.2896
MIT 8 Full 21.17121.17121.171 50.565250.565250.5652 729.7555729.7555729.7555 17.329817.329817.3298
NYU 9 Full 56.509656.509656.5096 174.4169174.4169174.4169 2330.66872330.66872330.6687 26.098326.098326.0983
BU 10 Full 38.152238.152238.1522 158.5765158.5765158.5765 2002.80062002.80062002.8006 33.783933.783933.7839
Brown 11 Full 43.795843.795843.7958 93.369593.369593.3695 1528.64731528.64731528.6473 20.013920.013920.0139
Princeton 12 Full 46.282246.282246.2822 87.741787.741787.7417 1378.41711378.41711378.4171 25.328325.328325.3283
Berkeley 13 Full 36.192636.192636.1926 69.118569.118569.1185 1363.20051363.20051363.2005 17.945517.945517.9455
Duke 14 Full 11.583111.583111.5831 57.914757.914757.9147 976.1039976.1039976.1039 17.375117.375117.3751
Georgetown 15 Full 22.496622.496622.4966 167.8567167.8567167.8567 2653.54862653.54862653.5486 24.573524.573524.5735
UVA 16 Full 12.243912.243912.2439 62.657462.657462.6574 819.8208819.8208819.8208 30.761730.761730.7617
BC 17 Full 38.820338.820338.8203 122.7586122.7586122.7586 2681.13232681.13232681.1323 26.672226.672226.6722
Tufts 18 Full 42.021342.021342.0213 145.7541145.7541145.7541 1358.33531358.33531358.3353 12.859512.859512.8595
Northeastern 19 Full 13.834713.834713.8347 88.1688.1688.16 1681.86721681.86721681.8672 5.37535.37535.3753
UIllinios 20 Full 40.074940.074940.0749 86.738686.738686.7386 1199.88241199.88241199.8824 28.252828.252828.2528
UF 21 Full 26.801526.801526.8015 64.800464.800464.8004 724.6443724.6443724.6443 22.040122.040122.0401
Wellesley 22 Full 29.113129.113129.1131 54.663554.663554.6635 742.4539742.4539742.4539 6.26526.26526.2652
Michigan 23 Full 43.341543.341543.3415 82.768782.768782.7687 1649.31781649.31781649.3178 16.477416.477416.4774
MSU 24 Full 26.787426.787426.7874 87.008587.008587.0085 1009.66511009.66511009.6651 13.279413.279413.2794
UCLA 26 Full 40.062240.062240.0622 74.624174.624174.6241 1468.13271468.13271468.1327 10.934110.934110.9341
Emory 27 Full 19.886119.886119.8861 70.014970.014970.0149 900.4854900.4854900.4854 14.102314.102314.1023
UNC 28 Full 23.183823.183823.1838 121.3854121.3854121.3854 776.3694776.3694776.3694 17.010817.010817.0108
Tulane 29 Full 16.177816.177816.1778 56.066556.066556.0665 671.0963671.0963671.0963 14.655814.655814.6558
UChicago 30 Full 24.714624.714624.7146 24.907124.907124.9071 662.2972662.2972662.2972 8.63298.63298.6329
WashU 32 Full 47.24347.24347.243 136.8021136.8021136.8021 1623.28651623.28651623.2865 15.178115.178115.1781
UC 33 Full 29.03429.03429.034 67.342567.342567.3425 1357.10991357.10991357.1099 15.545415.545415.5454
UCSD 34 Full 97.57497.57497.574 152.9926152.9926152.9926 2473.45452473.45452473.4545 24.899624.899624.8996
USC 35 Full 29.929729.929729.9297 78.027478.027478.0274 453.1745453.1745453.1745 28.527528.527528.5275
UCSB 37 Full 22.094122.094122.0941 85.338185.338185.3381 1198.9331198.9331198.933 16.727216.727216.7272
Rochester 38 Full 75.488775.488775.4887 108.3232108.3232108.3232 552.4707552.4707552.4707 5.25235.25235.2523
Bucknell 39 Full 43.16943.16943.169 157.6246157.6246157.6246 1028.80641028.80641028.8064 6.74216.74216.7421
Williams 40 Full 32.06832.06832.068 60.455960.455960.4559 812.548812.548812.548 7.84177.84177.8417
Amherst 41 Full 10.211610.211610.2116 23.619323.619323.6193 463.9533463.9533463.9533 4.98724.98724.9872
Swarthmore 42 Full 22.653322.653322.6533 56.423656.423656.4236 409.7389409.7389409.7389 15.92615.92615.926
Wesleyan 43 Full 29.801829.801829.8018 66.979866.979866.9798 675.9864675.9864675.9864 3.3193.3193.319
Middlebury 45 Full 42.329242.329242.3292 113.8323113.8323113.8323 1101.43481101.43481101.4348 12.738912.738912.7389
Hamilton 46 Full 20.82920.82920.829 74.408174.408174.4081 560.5977560.5977560.5977 4.37814.37814.3781
Bowdoin 47 Full 24.887224.887224.8872 45.977145.977145.9771 561.9283561.9283561.9283 6.54846.54846.5484
Vanderbilt 48 Full 24.242524.242524.2425 37.584137.584137.5841 794.3818794.3818794.3818 1.96161.9616\mathit{1.9616}
UGA 50 Full 12.068212.068212.0682 110.7201110.7201110.7201 632.719632.719632.719 18.01718.01718.017
UCF 52 Full 11.581911.581911.5819 31.394331.394331.3943 561.5652561.5652561.5652 19.631819.631819.6318
FSU 53 Full 58.576258.576258.5762 67.710967.710967.7109 1076.38231076.38231076.3823 16.135316.135316.1353
GWU 54 Full 19.483119.483119.4831 137.0233137.0233137.0233 1452.651452.651452.65 15.877815.877815.8778
Syracuse 56 Full 21.201421.201421.2014 79.138879.138879.1388 994.8975994.8975994.8975 4.93924.93924.9392
Notre Dame 57 Full 35.824835.824835.8248 88.076188.076188.0761 1881.53721881.53721881.5372 10.612910.612910.6129
Maryland 58 Full 44.096444.096444.0964 75.704675.704675.7046 1602.61151602.61151602.6115 24.424324.424324.4243
Smith 60 Full 16.457116.457116.4571 95.391695.391695.3916 153.5555153.5555153.5555 6.20276.20276.2027
UC 61 Full 18.806118.806118.8061 25.274625.274625.2746 1013.08981013.08981013.0898 21.76621.76621.766
Villanova 62 Full 33.684433.684433.6844 170.8182170.8182170.8182 1887.67011887.67011887.6701 14.070814.070814.0708
Virginia 63 Full 17.220817.220817.2208 35.532835.532835.5328 1071.05211071.05211071.0521 14.297214.297214.2972
UC 64 Full 18.804318.804318.8043 31.419831.419831.4198 354.0712354.0712354.0712 5.84025.84025.8402
Cal 65 Full 22.371922.371922.3719 85.100585.100585.1005 373.0507373.0507373.0507 7.23627.23627.2362
Mississippi 66 Full 21.428421.428421.4284 108.929108.929108.929 558.1005558.1005558.1005 31.626731.626731.6267
Mich 67 Full 9.88729.88729.8872 46.01546.01546.015 187.978187.978187.978 2.5422.5422.542
Indiana 69 Full 39.07839.07839.078 114.936114.936114.936 1044.22621044.22621044.2262 26.156926.156926.1569
Vermont 70 Full 20.833620.833620.8336 99.130399.130399.1303 1558.61931558.61931558.6193 3.7543.7543.754
Auburn 71 Full 10.538110.538110.5381 59.125159.125159.1251 420.8563420.8563420.8563 21.178921.178921.1789
USFCA 72 Full 6.3366.3366.336 62.518162.518162.5181 570.4495570.4495570.4495 1.60581.6058\mathit{1.6058}
Wake 73 Full 26.144826.144826.1448 56.161356.161356.1613 694.32694.32694.32 3.21523.21523.2152
Santa 74 Full 33.348333.348333.3483 60.525660.525660.5256 718.0548718.0548718.0548 11.519211.519211.5192
American 75 Full 33.098533.098533.0985 67.680967.680967.6809 883.8311883.8311883.8311 2.92852.92852.9285
Haverford 76 Full 24.163824.163824.1638 106.6988106.6988106.6988 504.0081504.0081504.0081 5.68615.68615.6861
William 77 Full 14.585514.585514.5855 44.627444.627444.6274 566.6482566.6482566.6482 10.008210.008210.0082
JMU 79 Full 32.970632.970632.9706 164.9227164.9227164.9227 2124.03342124.03342124.0334 10.873410.873410.8734
Texas 80 Full 43.33443.33443.334 91.306591.306591.3065 1167.37671167.37671167.3767 33.704533.704533.7045
Simmons 81 Full 6.60066.60066.6006 97.196697.196697.1966 562.7712562.7712562.7712 1.06271.0627\mathit{1.0627}
Bingham 82 Full 13.632913.632913.6329 41.688941.688941.6889 455.3084455.3084455.3084 6.24846.24846.2484
Temple 83 Full 27.82127.82127.821 56.43456.43456.434 824.6862824.6862824.6862 2.02412.02412.0241
Vassar 85 Full 25.465225.465225.4652 112.3232112.3232112.3232 632.4143632.4143632.4143 8.97358.97358.9735
Wisconsin 87 Full 10.772210.772210.7722 105.468105.468105.468 805.9753805.9753805.9753 14.57614.57614.576
Colgate 88 Full 51.755251.755251.7552 151.8996151.8996151.8996 974.1691974.1691974.1691 8.0878.0878.087
Howard 90 Full 7.93867.93867.9386 80.588980.588980.5889 658.1969658.1969658.1969 0.904950.90495\mathit{0.90495}
UConn 91 Full 14.476614.476614.4766 53.900853.900853.9008 1578.3981578.3981578.398 13.889613.889613.8896
UMass 92 Full 20.536920.536920.5369 102.4828102.4828102.4828 1214.45271214.45271214.4527 9.51249.51249.5124
Baylor 93 Full 30.58330.58330.583 91.725591.725591.7255 1033.27671033.27671033.2767 9.8849.8849.884
Penn 94 Full 20.323420.323420.3234 125.4115125.4115125.4115 999.8411999.8411999.8411 17.335517.335517.3355
Tennessee 95 Full 7.40467.40467.4046 64.844364.844364.8443 322.5114322.5114322.5114 23.151223.151223.1512
Lehigh 96 Full 34.061734.061734.0617 90.152590.152590.1525 917.7177917.7177917.7177 13.026713.026713.0267
Oklahoma 97 Full 9.31099.31099.3109 73.59373.59373.593 230.908230.908230.908 21.618821.618821.6188
Reed 98 Full 7.69747.69747.6974 43.734343.734343.7343 228.6649228.6649228.6649 1.87081.8708\mathit{1.8708}
Brandeis 99 Full 38.225138.225138.2251 125.1044125.1044125.1044 868.2479868.2479868.2479 3.49233.49233.4923
Trinity 100 Full 37.72137.72137.721 79.891979.891979.8919 685.0894685.0894685.0894 9.28169.28169.2816
Harvard 1 Student 99.318899.318899.3188 213.099213.099213.099 3154.07673154.07673154.0767 40.040740.040740.0407
Columbia 2 Student 32.885532.885532.8855 91.024891.024891.0248 1320.4381320.4381320.438 17.570717.570717.5707
Stanford 3 Student 26.435726.435726.4357 28.33828.33828.338 1181.43981181.43981181.4398 18.858118.858118.8581
Cornell 5 Student 37.397437.397437.3974 85.904185.904185.9041 1152.26281152.26281152.2628 20.412620.412620.4126
Dartmouth 6 Student 9.43289.43289.4328 44.932644.932644.9326 1342.68961342.68961342.6896 25.713425.713425.7134
UPenn 7 Student 31.48831.48831.488 91.479791.479791.4797 2173.44812173.44812173.4481 33.193533.193533.1935
MIT 8 Student 17.381217.381217.3812 91.613991.613991.6139 692.0884692.0884692.0884 2.80242.80242.8024
NYU 9 Student 44.866444.866444.8664 120.8477120.8477120.8477 2673.64142673.64142673.6414 14.111714.111714.1117
BU 10 Student 33.405333.405333.4053 258.2824258.2824258.2824 2387.71492387.71492387.7149 33.210433.210433.2104
Brown 11 Student 44.257544.257544.2575 133.344133.344133.344 1631.06731631.06731631.0673 17.947517.947517.9475
Princeton 12 Student 84.096584.096584.0965 158.3249158.3249158.3249 2312.19082312.19082312.1908 57.535857.535857.5358
Berkeley 13 Student 39.66439.66439.664 59.821759.821759.8217 1773.27921773.27921773.2792 16.876516.876516.8765
Duke 14 Student 42.156242.156242.1562 109.9259109.9259109.9259 1625.87061625.87061625.8706 18.91818.91818.918
Georgetown 15 Student 58.09558.09558.095 713.9046713.9046713.9046 3190.41173190.41173190.4117 87.915187.915187.9151
UVA 16 Student 33.685633.685633.6856 54.325354.325354.3253 1303.48871303.48871303.4887 24.913824.913824.9138
BC 17 Student 37.724537.724537.7245 137.9774137.9774137.9774 2075.55612075.55612075.5561 11.871211.871211.8712
Tufts 18 Student 44.060444.060444.0604 232.5307232.5307232.5307 1403.11541403.11541403.1154 21.530321.530321.5303
Northeastern 19 Student 16.326716.326716.3267 78.434978.434978.4349 1471.51521471.51521471.5152 4.87224.87224.8722
UIllinios 20 Student 29.553829.553829.5538 80.496180.496180.4961 985.0426985.0426985.0426 20.80420.80420.804
UF 21 Student 30.160930.160930.1609 33.898133.898133.8981 787.2977787.2977787.2977 27.901127.901127.9011
Michigan 23 Student 24.60724.60724.607 79.237879.237879.2378 1156.94991156.94991156.9499 10.780910.780910.7809
MSU 24 Student 22.176622.176622.1766 99.834599.834599.8345 1173.93831173.93831173.9383 15.143715.143715.1437
UCLA 26 Student 42.887642.887642.8876 97.721297.721297.7212 1466.94961466.94961466.9496 14.651414.651414.6514
Emory 27 Student 29.196829.196829.1968 95.333795.333795.3337 814.384814.384814.384 14.245814.245814.2458
UNC 28 Student 41.413441.413441.4134 117.5846117.5846117.5846 1091.38671091.38671091.3867 14.570114.570114.5701
Tulane 29 Student 43.937543.937543.9375 105.2506105.2506105.2506 998.7201998.7201998.7201 11.783511.783511.7835
UChicago 30 Student 23.632823.632823.6328 29.762829.762829.7628 636.2057636.2057636.2057 7.77147.77147.7714
WashU 32 Student 32.974632.974632.9746 150.03150.03150.03 1274.52971274.52971274.5297 2.20122.20122.2012
UC 33 Student 24.573424.573424.5734 89.267189.267189.2671 1178.51971178.51971178.5197 20.158620.158620.1586
UCSD 34 Student 53.517653.517653.5176 109.0151109.0151109.0151 1624.11331624.11331624.1133 19.874319.874319.8743
USC 35 Student 20.807820.807820.8078 80.7180.7180.71 721.8665721.8665721.8665 24.150924.150924.1509
UCSB 37 Student 42.967442.967442.9674 60.525260.525260.5252 1297.04721297.04721297.0472 11.763611.763611.7636
Rochester 38 Student 86.408186.408186.4081 196.7464196.7464196.7464 834.5066834.5066834.5066 2.94232.94232.9423
Bucknell 39 Student 40.667340.667340.6673 135.4627135.4627135.4627 1047.85291047.85291047.8529 0.466980.46698\mathit{0.46698}
Williams 40 Student 51.830651.830651.8306 148.8178148.8178148.8178 1132.32551132.32551132.3255 10.050210.050210.0502
Amherst 41 Student 32.332332.332332.3323 41.042641.042641.0426 685.2003685.2003685.2003 2.52912.52912.5291
Swarthmore 42 Student 17.049317.049317.0493 53.075853.075853.0758 493.4119493.4119493.4119 32.228632.228632.2286
Wesleyan 43 Student 19.022319.022319.0223 52.817652.817652.8176 452.412452.412452.412 3.68653.68653.6865
Hamilton 46 Student 51.592451.592451.5924 118.0699118.0699118.0699 748.7682748.7682748.7682 4.23974.23974.2397
Bowdoin 47 Student 72.340772.340772.3407 92.342392.342392.3423 981.5874981.5874981.5874 6.39826.39826.3982
Vanderbilt 48 Student 45.920245.920245.9202 159.4014159.4014159.4014 1359.16481359.16481359.1648 9.18699.18699.1869
UGA 50 Student 18.184418.184418.1844 99.784999.784999.7849 883.623883.623883.623 18.507218.507218.5072
USF 51 Student 13.605913.605913.6059 21.03321.03321.033 186.1287186.1287186.1287 19.287919.287919.2879
UCF 52 Student 11.423611.423611.4236 32.079632.079632.0796 497.4315497.4315497.4315 20.189420.189420.1894
FSU 53 Student 48.472648.472648.4726 78.869678.869678.8696 1223.70471223.70471223.7047 16.98916.98916.989
GWU 54 Student 21.606521.606521.6065 201.6003201.6003201.6003 1669.30191669.30191669.3019 10.349910.349910.3499
Syracuse 56 Student 17.518817.518817.5188 78.194378.194378.1943 786.3957786.3957786.3957 1.9561.956\mathit{1.956}
Notre Dame 57 Student 52.606652.606652.6066 125.0482125.0482125.0482 2181.16032181.16032181.1603 0.404350.40435\mathit{-0.40435}
Maryland 58 Student 44.094344.094344.0943 46.509746.509746.5097 1222.26891222.26891222.2689 16.322516.322516.3225
Smith 60 Student 18.325518.325518.3255 129.2886129.2886129.2886 310.6547310.6547310.6547 5.86345.86345.8634
UC 61 Student 22.522922.522922.5229 30.656730.656730.6567 647.5664647.5664647.5664 16.739416.739416.7394
Villanova 62 Student 36.230136.230136.2301 171.1948171.1948171.1948 1588.96721588.96721588.9672 8.08838.08838.0883
Virginia 63 Student 21.261721.261721.2617 36.281136.281136.2811 920.744920.744920.744 4.13144.13144.1314
UC 64 Student 14.034214.034214.0342 21.124521.124521.1245 257.877257.877257.877 5.15825.15825.1582
Cal 65 Student 17.029417.029417.0294 89.623589.623589.6235 390.6672390.6672390.6672 7.7687.7687.768
Mississippi 66 Student 21.167421.167421.1674 110.3752110.3752110.3752 568.1393568.1393568.1393 25.535125.535125.5351
Mich 67 Student 14.018614.018614.0186 55.022355.022355.0223 209.6002209.6002209.6002 8.90418.90418.9041
Indiana 69 Student 28.628728.628728.6287 92.337392.337392.3373 987.3405987.3405987.3405 21.750721.750721.7507
Vermont 70 Student 28.706428.706428.7064 150.2745150.2745150.2745 1657.49941657.49941657.4994 4.31334.31334.3133
Auburn 71 Student 2.60142.60142.6014 54.06954.06954.069 312.2621312.2621312.2621 30.754730.754730.7547
USFCA 72 Student 6.87636.87636.8763 81.585881.585881.5858 469.0973469.0973469.0973 2.62532.62532.6253
Wake 73 Student 32.374932.374932.3749 97.874497.874497.8744 728.8018728.8018728.8018 3.89153.89153.8915
Santa 74 Student 33.920533.920533.9205 106.301106.301106.301 841.1835841.1835841.1835 8.47878.47878.4787
American 75 Student 28.971328.971328.9713 141.3917141.3917141.3917 980.732980.732980.732 2.40232.40232.4023
Haverford 76 Student 25.689425.689425.6894 39.689939.689939.6899 450.7222450.7222450.7222 4.60394.60394.6039
William 77 Student 41.033141.033141.0331 68.814268.814268.8142 673.3207673.3207673.3207 7.297.297.29
MU 78 Student 95.432795.432795.4327 115.7901115.7901115.7901 1800.45761800.45761800.4576 20.849420.849420.8494
JMU 79 Student 36.387236.387236.3872 77.438677.438677.4386 1655.27351655.27351655.2735 1.36041.3604\mathit{1.3604}
Texas 80 Student 36.279636.279636.2796 89.101589.101589.1015 853.338853.338853.338 23.363823.363823.3638
Simmons 81 Student 0.700790.70079\mathit{-0.70079} 42.543142.543142.5431 297.8748297.8748297.8748 2.27972.27972.2797
Bingham 82 Student 15.497415.497415.4974 33.772733.772733.7727 439.2416439.2416439.2416 16.586116.586116.5861
Temple 83 Student 23.706923.706923.7069 55.814155.814155.8141 831.2747831.2747831.2747 2.47492.47492.4749
Vassar 85 Student 57.841557.841557.8415 81.665581.665581.6655 829.158829.158829.158 0.480560.48056\mathit{-0.48056}
Pepperdine 86 Student 17.66217.66217.662 37.687437.687437.6874 803.1151803.1151803.1151 0.255770.25577\mathit{0.25577}
Wisconsin 87 Student 39.557139.557139.5571 94.338394.338394.3383 1139.95211139.95211139.9521 16.755716.755716.7557
Colgate 88 Student 49.325949.325949.3259 121.6428121.6428121.6428 1033.65461033.65461033.6546 5.90095.90095.9009
Howard 90 Student 5.82155.82155.8215 97.882297.882297.8822 840.9143840.9143840.9143 2.93872.93872.9387
UConn 91 Student 17.070717.070717.0707 24.972324.972324.9723 1095.65171095.65171095.6517 10.441410.441410.4414
UMass 92 Student 10.007510.007510.0075 79.596279.596279.5962 701.4362701.4362701.4362 7.33087.33087.3308
Baylor 93 Student 29.86629.86629.866 82.944682.944682.9446 993.8766993.8766993.8766 8.04728.04728.0472
Penn 94 Student 19.692119.692119.6921 28.310728.310728.3107 975.0955975.0955975.0955 12.676512.676512.6765
Lehigh 96 Student 27.474827.474827.4748 78.10278.10278.102 652.2015652.2015652.2015 5.65215.65215.6521
Oklahoma 97 Student 7.11627.11627.1162 78.670678.670678.6706 315.7085315.7085315.7085 23.24723.24723.247
Reed 98 Student 6.92336.92336.9233 32.646932.646932.6469 223.167223.167223.167 5.165.165.16
Brandeis 99 Student 38.233438.233438.2334 298.1184298.1184298.1184 1487.46931487.46931487.4693 3.03733.03733.0373
Trinity 100 Student 88.327988.327988.3279 140.3587140.3587140.3587 847.1625847.1625847.1625 10.66110.66110.661
Columbia 2 Female 59.91159.91159.911 69.145969.145969.1459 1362.69551362.69551362.6955 7.11497.11497.1149
Cornell 5 Female 22.118222.118222.1182 72.608172.608172.6081 429.2737429.2737429.2737 11.762511.762511.7625
Dartmouth 6 Female 34.119534.119534.1195 35.116235.116235.1162 681.7989681.7989681.7989 9.56369.56369.5636
UPenn 7 Female 31.580231.580231.5802 44.325644.325644.3256 606.0889606.0889606.0889 14.92814.92814.928
MIT 8 Female 23.571123.571123.5711 50.699950.699950.6999 419.3002419.3002419.3002 2.81382.81382.8138
NYU 9 Female 45.996145.996145.9961 120.1278120.1278120.1278 1598.58051598.58051598.5805 8.64668.64668.6466
BU 10 Female 53.942353.942353.9423 105.1393105.1393105.1393 1140.38631140.38631140.3863 9.95119.95119.9511
Brown 11 Female 58.727258.727258.7272 92.681992.681992.6819 973.3376973.3376973.3376 15.216615.216615.2166
Princeton 12 Female 52.196652.196652.1966 67.094667.094667.0946 734.7138734.7138734.7138 13.318313.318313.3183
Georgetown 15 Female 31.905331.905331.9053 155.4224155.4224155.4224 1567.58431567.58431567.5843 25.431725.431725.4317
BC 17 Female 49.510849.510849.5108 102.7311102.7311102.7311 1754.35481754.35481754.3548 17.303817.303817.3038
Tufts 18 Female 58.886758.886758.8867 101.6042101.6042101.6042 981.3506981.3506981.3506 10.748510.748510.7485
Northeastern 19 Female 36.783636.783636.7836 60.909160.909160.9091 857.2153857.2153857.2153 7.0297.0297.029
UIllinios 20 Female 29.918929.918929.9189 44.163344.163344.1633 492.9557492.9557492.9557 27.052227.052227.0522
UF 21 Female 15.5715.5715.57 59.883459.883459.8834 539.1188539.1188539.1188 21.740821.740821.7408
Wellesley 22 Female 24.82424.82424.824 43.668843.668843.6688 481.3682481.3682481.3682 4.74564.74564.7456
Michigan 23 Female 39.427439.427439.4274 77.074477.074477.0744 808.026808.026808.026 23.055523.055523.0555
MSU 24 Female 31.787131.787131.7871 67.826467.826467.8264 735.6949735.6949735.6949 37.933137.933137.9331
UCLA 26 Female 41.929341.929341.9293 46.674846.674846.6748 849.1839849.1839849.1839 13.938613.938613.9386
Emory 27 Female 35.526335.526335.5263 62.370262.370262.3702 577.1687577.1687577.1687 9.21699.21699.2169
UNC 28 Female 27.999627.999627.9996 69.479869.479869.4798 581.1929581.1929581.1929 11.953411.953411.9534
Tulane 29 Female 19.664319.664319.6643 63.910663.910663.9106 376.8734376.8734376.8734 5.84345.84345.8434
WashU 32 Female 31.726131.726131.7261 82.98182.98182.981 667.6735667.6735667.6735 9.43849.43849.4384
UC 33 Female 41.05241.05241.052 62.245862.245862.2458 818.7266818.7266818.7266 20.07720.07720.077
UCSD 34 Female 52.037652.037652.0376 120.4275120.4275120.4275 1105.02611105.02611105.0261 8.64928.64928.6492
USC 35 Female 8.84388.84388.8438 56.495856.495856.4958 319.0773319.0773319.0773 12.062212.062212.0622
UCSB 37 Female 21.745321.745321.7453 32.522432.522432.5224 638.1004638.1004638.1004 6.73786.73786.7378
Rochester 38 Female 46.574446.574446.5744 70.017670.017670.0176 287.6943287.6943287.6943 5.25915.25915.2591
Bucknell 39 Female 60.167560.167560.1675 108.3969108.3969108.3969 665.8829665.8829665.8829 1.44861.4486\mathit{1.4486}
Williams 40 Female 41.902941.902941.9029 71.354271.354271.3542 509.9976509.9976509.9976 2.44842.44842.4484
Swarthmore 42 Female 21.83321.83321.833 40.147240.147240.1472 266.4082266.4082266.4082 20.537420.537420.5374
Wesleyan 43 Female 44.658544.658544.6585 63.291563.291563.2915 508.9586508.9586508.9586 2.36242.36242.3624
Middlebury 45 Female 55.687755.687755.6877 68.048868.048868.0488 665.9784665.9784665.9784 11.231911.231911.2319
Hamilton 46 Female 26.826926.826926.8269 51.717351.717351.7173 339.0963339.0963339.0963 3.72963.72963.7296
Bowdoin 47 Female 42.363342.363342.3633 50.020650.020650.0206 443.6413443.6413443.6413 5.17175.17175.1717
Vanderbilt 48 Female 27.46227.46227.462 56.727756.727756.7277 295.3028295.3028295.3028 3.59873.59873.5987
UGA 50 Female 18.881518.881518.8815 91.427591.427591.4275 544.2733544.2733544.2733 24.557724.557724.5577
FSU 53 Female 21.589221.589221.5892 47.687547.687547.6875 549.1743549.1743549.1743 29.143229.143229.1432
GWU 54 Female 19.932719.932719.9327 76.031676.031676.0316 761.2666761.2666761.2666 6.4346.4346.434
Syracuse 56 Female 19.209319.209319.2093 56.825756.825756.8257 412.6795412.6795412.6795 6.6086.6086.608
Notre Dame 57 Female 67.079267.079267.0792 232.5318232.5318232.5318 1501.71831501.71831501.7183 8.85528.85528.8552
Smith 60 Female 26.407926.407926.4079 170.5962170.5962170.5962 188.8864188.8864188.8864 6.45446.45446.4544
Villanova 62 Female 29.015129.015129.0151 86.40186.40186.401 624.5293624.5293624.5293 2.85172.85172.8517
Virginia 63 Female 22.161922.161922.1619 23.315323.315323.3153 531.7238531.7238531.7238 5.06085.06085.0608
Cal 65 Female 5.71655.71655.7165 53.912853.912853.9128 346.3433346.3433346.3433 8.27768.27768.2776
Mississippi 66 Female 18.443318.443318.4433 83.360783.360783.3607 333.3368333.3368333.3368 17.719917.719917.7199
Mich 67 Female 9.73339.73339.7333 21.423221.423221.4232 29.165429.165429.1654 11.609411.609411.6094
Indiana 69 Female 38.479538.479538.4795 77.67977.67977.679 741.5341741.5341741.5341 17.617117.617117.6171
Vermont 70 Female 17.900217.900217.9002 27.642127.642127.6421 498.663498.663498.663 2.59532.59532.5953
USFCA 72 Female 13.944613.944613.9446 69.303569.303569.3035 403.2942403.2942403.2942 4.98544.98544.9854
Wake 73 Female 17.175317.175317.1753 50.510350.510350.5103 243.4489243.4489243.4489 5.05995.05995.0599
Santa 74 Female 19.857819.857819.8578 38.995938.995938.9959 360.4748360.4748360.4748 12.128812.128812.1288
American 75 Female 10.501810.501810.5018 27.650727.650727.6507 440.7661440.7661440.7661 4.53334.53334.5333
Haverford 76 Female 13.050613.050613.0506 58.890858.890858.8908 257.4976257.4976257.4976 2.34532.34532.3453
William 77 Female 40.432540.432540.4325 54.472254.472254.4722 496.434496.434496.434 4.56464.56464.5646
MU 78 Female 32.857732.857732.8577 44.853744.853744.8537 749.5846749.5846749.5846 9.66389.66389.6638
Texas 80 Female 13.634513.634513.6345 46.940646.940646.9406 193.0758193.0758193.0758 16.451916.451916.4519
Simmons 81 Female 12.051212.051212.0512 114.095114.095114.095 581.5996581.5996581.5996 0.814060.81406\mathit{0.81406}
Texas 84 Female 25.778125.778125.7781 54.866954.866954.8669 366.4442366.4442366.4442 15.185915.185915.1859
Vassar 85 Female 59.709959.709959.7099 99.563499.563499.5634 722.4313722.4313722.4313 3.37783.37783.3778
Pepperdine 86 Female 19.04919.04919.049 25.881325.881325.8813 364.2763364.2763364.2763 5.15975.15975.1597
Wisconsin 87 Female 45.236945.236945.2369 79.191679.191679.1916 747.3274747.3274747.3274 17.040517.040517.0405
Colgate 88 Female 56.746356.746356.7463 76.327276.327276.3272 525.7816525.7816525.7816 3.18093.18093.1809
Howard 90 Female 4.42864.42864.4286 84.290884.290884.2908 477.9668477.9668477.9668 2.26272.26272.2627
UMass 92 Female 26.179826.179826.1798 73.252673.252673.2526 677.894677.894677.894 8.26688.26688.2668
Baylor 93 Female 34.138134.138134.1381 83.279283.279283.2792 585.4352585.4352585.4352 7.57277.57277.5727
Tennessee 95 Female 4.98224.98224.9822 44.000444.000444.0004 224.1669224.1669224.1669 33.390733.390733.3907
Lehigh 96 Female 21.4521.4521.45 65.404165.404165.4041 270.3559270.3559270.3559 4.59364.59364.5936
Oklahoma 97 Female 12.643812.643812.6438 60.916660.916660.9166 64.375764.375764.3757 19.463919.463919.4639
Reed 98 Female 6.02686.02686.0268 36.886736.886736.8867 179.4781179.4781179.4781 7.68757.68757.6875
Brandeis 99 Female 47.322247.322247.3222 203.5125203.5125203.5125 936.7937936.7937936.7937 2.23072.23072.2307
Trinity 100 Female 78.577478.577478.5774 101.3843101.3843101.3843 513.9692513.9692513.9692 7.16347.16347.1634
Harvard 1 Male 29.989129.989129.9891 61.208661.208661.2086 945.123945.123945.123 30.512930.512930.5129
Columbia 2 Male 22.522822.522822.5228 50.368250.368250.3682 595.2026595.2026595.2026 5.80845.80845.8084
Cornell 5 Male 37.360437.360437.3604 82.236182.236182.2361 657.6319657.6319657.6319 20.494920.494920.4949
Dartmouth 6 Male 10.439110.439110.4391 37.548637.548637.5486 325.2692325.2692325.2692 12.639112.639112.6391
UPenn 7 Male 13.049913.049913.0499 45.720645.720645.7206 390.0242390.0242390.0242 16.729416.729416.7294
MIT 8 Male 11.171511.171511.1715 55.560455.560455.5604 134.1896134.1896134.1896 2.2752.2752.275
BU 10 Male 36.67536.67536.675 79.392379.392379.3923 818.0288818.0288818.0288 9.78899.78899.7889
Brown 11 Male 36.938836.938836.9388 46.264546.264546.2645 637.6901637.6901637.6901 11.740711.740711.7407
Princeton 12 Male 22.141822.141822.1418 38.568438.568438.5684 591.3097591.3097591.3097 8.54488.54488.5448
Berkeley 13 Male 48.505148.505148.5051 49.136549.136549.1365 827.3955827.3955827.3955 12.870312.870312.8703
Duke 14 Male 20.844220.844220.8442 44.635244.635244.6352 493.8388493.8388493.8388 6.84396.84396.8439
Georgetown 15 Male 13.803113.803113.8031 102.8551102.8551102.8551 834.0682834.0682834.0682 14.627114.627114.6271
UVA 16 Male 21.772221.772221.7722 33.205933.205933.2059 565.5523565.5523565.5523 18.202518.202518.2025
BC 17 Male 27.052127.052127.0521 55.786355.786355.7863 1299.85411299.85411299.8541 6.07916.07916.0791
Tufts 18 Male 25.844125.844125.8441 63.284163.284163.2841 442.9834442.9834442.9834 3.67243.67243.6724
Northeastern 19 Male 23.64723.64723.647 37.374237.374237.3742 645.8802645.8802645.8802 2.80862.80862.8086
Michigan 23 Male 26.209926.209926.2099 34.020934.020934.0209 457.296457.296457.296 23.53623.53623.536
UCLA 26 Male 23.602723.602723.6027 36.913336.913336.9133 470.0726470.0726470.0726 5.29435.29435.2943
Emory 27 Male 19.776619.776619.7766 44.515444.515444.5154 406.9838406.9838406.9838 4.75144.75144.7514
UNC 28 Male 18.345618.345618.3456 20.271320.271320.2713 359.8668359.8668359.8668 5.12745.12745.1274
Tulane 29 Male 12.371412.371412.3714 24.982824.982824.9828 194.3111194.3111194.3111 5.10275.10275.1027
UChicago 30 Male 14.293214.293214.2932 15.770715.770715.7707 302.7644302.7644302.7644 6.35976.35976.3597
WashU 32 Male 20.581620.581620.5816 68.971668.971668.9716 555.3128555.3128555.3128 4.97734.97734.9773
UCSD 34 Male 28.034728.034728.0347 49.93449.93449.934 553.0263553.0263553.0263 7.30257.30257.3025
USC 35 Male 16.355816.355816.3558 40.326940.326940.3269 298.4942298.4942298.4942 19.806219.806219.8062
UCSB 37 Male 15.670115.670115.6701 26.318626.318626.3186 498.8095498.8095498.8095 7.32657.32657.3265
Rochester 38 Male 41.785841.785841.7858 59.737959.737959.7379 200.7157200.7157200.7157 3.9093.9093.909
Bucknell 39 Male 20.815420.815420.8154 40.559540.559540.5595 317.9352317.9352317.9352 1.46251.4625\mathit{1.4625}
Williams 40 Male 21.830921.830921.8309 77.271277.271277.2712 453.5945453.5945453.5945 5.54045.54045.5404
Amherst 41 Male 15.833215.833215.8332 20.519920.519920.5199 262.1057262.1057262.1057 3.42463.42463.4246
Swarthmore 42 Male 13.923713.923713.9237 32.2232.2232.22 170.3011170.3011170.3011 13.760713.760713.7607
Wesleyan 43 Male 33.926433.926433.9264 42.369542.369542.3695 281.1386281.1386281.1386 9.73539.73539.7353
Middlebury 45 Male 24.443124.443124.4431 37.695637.695637.6956 416.4853416.4853416.4853 6.47226.47226.4722
Hamilton 46 Male 12.51112.51112.511 26.982526.982526.9825 191.0375191.0375191.0375 2.86672.86672.8667
Bowdoin 47 Male 21.733421.733421.7334 32.507532.507532.5075 240.1141240.1141240.1141 3.90853.90853.9085
Vanderbilt 48 Male 21.292721.292721.2927 37.778937.778937.7789 358.7814358.7814358.7814 3.81783.81783.8178
UGA 50 Male 28.188528.188528.1885 37.846437.846437.8464 402.9449402.9449402.9449 27.926527.926527.9265
GWU 54 Male 15.189415.189415.1894 52.176452.176452.1764 417.4244417.4244417.4244 3.9693.9693.969
Maryland 58 Male 23.308823.308823.3088 40.407940.407940.4079 467.3145467.3145467.3145 18.457618.457618.4576
UC 61 Male 9.45349.45349.4534 16.884416.884416.8844 289.5348289.5348289.5348 6.94566.94566.9456
Villanova 62 Male 18.538218.538218.5382 71.460871.460871.4608 870.5405870.5405870.5405 2.37592.37592.3759
UC 64 Male 9.7629.7629.762 11.080811.080811.0808 104.4673104.4673104.4673 6.41556.41556.4155
Cal 65 Male 21.468621.468621.4686 44.541444.541444.5414 262.3191262.3191262.3191 9.7879.7879.787
Mississippi 66 Male 0.687320.68732\mathit{-0.68732} 33.509533.509533.5095 146.2177146.2177146.2177 16.843616.843616.8436
Mich 67 Male 5.83735.83735.8373 33.069433.069433.0694 103.8467103.8467103.8467 7.23997.23997.2399
Indiana 69 Male 28.300928.300928.3009 42.413842.413842.4138 300.8445300.8445300.8445 24.682424.682424.6824
Vermont 70 Male 9.42269.42269.4226 27.642427.642427.6424 226.9582226.9582226.9582 2.5762.5762.576
USFCA 72 Male 1.68261.6826\mathit{1.6826} 32.239432.239432.2394 147.5292147.5292147.5292 5.0285.0285.028
Wake 73 Male 9.52679.52679.5267 25.842325.842325.8423 152.0677152.0677152.0677 1.62981.6298\mathit{1.6298}
Santa 74 Male 15.337415.337415.3374 27.170927.170927.1709 184.3393184.3393184.3393 7.9457.9457.945
American 75 Male 4.73864.73864.7386 13.57813.57813.578 156.7257156.7257156.7257 3.54323.54323.5432
Haverford 76 Male 12.617412.617412.6174 30.729930.729930.7299 156.1152156.1152156.1152 2.98562.98562.9856
William 77 Male 11.702311.702311.7023 35.601335.601335.6013 205.7983205.7983205.7983 6.80696.80696.8069
Vassar 85 Male 47.392347.392347.3923 48.79648.79648.796 255.5571255.5571255.5571 2.7412.7412.741
Wisconsin 87 Male 29.503229.503229.5032 35.279935.279935.2799 355.807355.807355.807 13.247513.247513.2475
Colgate 88 Male 30.057330.057330.0573 82.100182.100182.1001 379.9489379.9489379.9489 3.1713.1713.171
Howard 90 Male 11.52311.52311.523 29.006329.006329.0063 193.9819193.9819193.9819 3.86113.86113.8611
UConn 91 Male 11.79211.79211.792 14.368114.368114.3681 441.0755441.0755441.0755 9.70349.70349.7034
Baylor 93 Male 27.986627.986627.9866 50.039250.039250.0392 523.6701523.6701523.6701 7.83157.83157.8315
Lehigh 96 Male 26.470926.470926.4709 50.668350.668350.6683 333.6791333.6791333.6791 3.74363.74363.7436
Oklahoma 97 Male 28.609128.609128.6091 40.500340.500340.5003 119.488119.488119.488 28.451728.451728.4517
Reed 98 Male 5.15995.15995.1599 12.041812.041812.0418 60.289460.289460.2894 1.49111.4911\mathit{1.4911}
Brandeis 99 Male 18.628818.628818.6288 56.997356.997356.9973 376.3272376.3272376.3272 1.31551.3155\mathit{1.3155}
Trinity 100 Male 25.323125.323125.3231 38.545138.545138.5451 279.1799279.1799279.1799 3.60433.60433.6043

References

  • Backstrom et al. [2006] Backstrom, L., Huttenlocher, D., Kleinberg, J., Lan, X., 2006. Group formation in large social networks: Membership, growth, and evolution, in: Proceedings of 12th International Conference on Knowledge Discovery in Data Mining. ACM Press, New York, NY, pp. 44–54.
  • Blondel et al. [2008] Blondel, V.D., Guillaume, J.L., Lambiotte, R., Lefebvre, E., 2008. Fast unfolding of communities in large networks. Journal of Statistical Mechanics: Theory and Experiment 2008, P10008.
  • Boyd [2007a] Boyd, D.M., 2007a. Viewing american class divisions through Facebook and MySpace. Apophenia blog essay. June 24. http://www.danah.org/papers/essays/ClassDivisions.html.
  • Boyd [2007b] Boyd, D.M., 2007b. Why youth (heart) social network sites: The role of networked publics in teenage social life, in: Buckingham, D. (Ed.), MacArthur Foundation Series on Digital Learning - Youth, Identity, and Digital Media Volume. MIT Press, Cambridge, MA, pp. 119–142.
  • Boyd and Ellison [2007] Boyd, D.M., Ellison, N.B., 2007. Social network sites: Definition, history, and scholarship. Journal of Computer-Mediated Communication 13, 11.
  • Brandes et al. [2008] Brandes, U., Delling, D., Gaertler, M., Goerke, R., Hoefer, M., Nikoloski, Z., Wagner, D., 2008. On modularity clustering. IEEE Transactions on Knowledge and Data Engineering 20, 172–188.
  • Brook and Stirling [1984] Brook, R.J., Stirling, W.D., 1984. Agreement between observers when the categories are not specified in advance. British Journal of Mathematical and Statistical Psychology 37, 271–282.
  • Brzozowski et al. [2008] Brzozowski, M., Hogg, T., Szabo, G., 2008. Friends and foes: Ideological social networking, in: Proceedings of the SIGCHI Conference on Human Factors in Computing. ACM Press, New York, NY.
  • Callaghan et al. [2007] Callaghan, T., Mucha, P.J., Porter, M.A., 2007. Random walker ranking for NCAA division I-A football. American Mathematical Monthly 114, 761–777.
  • Chin and Chignell [2007] Chin, A., Chignell, M., 2007. Identifying active subgroups within online communities, in: Proceedings of the Centre for Advanced Studies (CASCON) Conference, Toronto, Canada.
  • Fortunato [2010] Fortunato, S., 2010. Community detection in graphs. Physics Reports 486, 75–174.
  • Fortunato and Barthelemy [2007] Fortunato, S., Barthelemy, M., 2007. Resolution limit in community detection. Proceedings of the National Academy of Sciences 104, 36–41.
  • Fragoso [2006] Fragoso, S., 2006. WTF a crazy Brazilian invasion, in: Sudweeks, F., Hrachovec, H. (Eds.), Proceedings of CATaC 2006. Murdoch University, Murdoch, Australia.
  • Frank and Strauss [1986] Frank, O., Strauss, D., 1986. Markov graphs. Journal of the American Statistical Association 81, 832–842.
  • Franklin [2002] Franklin, J.N., 2002. Methods of Mathematical Economics: Linear and Nonlinear Programming, Fixed-Point Theorems. SIAM, Philadelphia, PA.
  • Fruchterman and Reingold [1991] Fruchterman, T.M.J., Reingold, E.M., 1991. Graph drawing by force-directed placement. Software—Practice and Experience 21, 1129–1164.
  • Gajjala [2007] Gajjala, R., 2007. Shifting frames: Race, ethnicity, and intercultural communication in online social networking and virtual work, in: Hinner, M.B. (Ed.), The Role of Communication in Business Transactions and Relationships. Peter Lang, New York, NY, pp. 257–276.
  • Geidner et al. [2007] Geidner, N.W., Fook, C.A., Bell, M.W., 2007. Masculinity and online social networks: Male self-identification on Facebook.com, in: Paper presented at Eastern Communication Association 98th Annual Meeting. Providence, RI.
  • Girvan and Newman [2002] Girvan, M., Newman, M.E.J., 2002. Community structure in social and biological networks. Proceedings of the National Academy of Sciences 99, 7821–7826.
  • Gjoka et al. [2010] Gjoka, M., Kurant, M., Butts, C.T., Markopoulou, A., 2010. Walking in Facebook: A Case Study of Unbiased Sampling of OSNs, in: Proceedings of IEEE INFOCOM ’10, San Diego, CA.
  • Golder et al. [2007] Golder, S.A., Wilkinson, D., Huberman, B.A., 2007. Rhythms of social interaction: Messaging within a massive online network, in: Steinfield, C., Pentland, B., Ackerman, M., Contractor, N. (Eds.), Proceedings of Third International Conference on Communities and Technologies. Springer, London, U.K., pp. 41–66.
  • González et al. [2007] González, M.C., Herrmann, H.J., Kertész, J., Vicsek, T., 2007. Community structure and ethnic preferences in school friendship networks. Physica A 379, 307–316.
  • Good et al. [2010] Good, B.H., de Montjoye, Y.A., Clauset, A., 2010. Performance of modularity maximization in practical contexts. Physical Review E 81, 046106.
  • Guimerà and Amaral [2005] Guimerà, R., Amaral, L.A.N., 2005. Functional cartography of complex metabolic networks. Nature 433, 895–900.
  • Handcock et al. [2008] Handcock, M.S., Hunter, D.R., Butts, C.T., Goodreau, S.M., Morris, M., 2008. ERGM: A package to fit, simulate and diagnose exponential-family models for networks. Journal of Statistical Software 24, 1–29.
  • Hjorth and Kim [2005] Hjorth, L., Kim, H., 2005. Being there and being here: Gendered customising of mobile 3G practices through a case study in Seoul. Convergence 11, 49–55.
  • Hogan [2009] Hogan, B., 2009. A comparison of on and offline networks through the Facebook API. Working paper, available at http://papers.ssrn.com/sol3/papers.cfm?abstract_id=1331029.
  • Hogg et al. [2008] Hogg, T., Wilkinson, D., Szabo, G., Brzozowski, M., 2008. Multiple relationship types in online communities and social networks, in: Proceedings of the AAAI Spring Symposium on Social Information Processing. AAAI Press.
  • Hubert [1977] Hubert, L., 1977. Nominal scale response agreement as a generalized correlation. British Journal of Mathematical and Statistical Psychology 30, 98–103.
  • Kamada and Kawai [1989] Kamada, T., Kawai, S., 1989. An algorithm for drawing general undirected graphs. Information Processing Letters 31, 7–15.
  • Kernighan and Lin [1970] Kernighan, B.W., Lin, S., 1970. An efficient heuristic procedure for partitioning graphs. The Bell System Technical Journal 49, 291–307.
  • Krebs [2008] Krebs, V., 2008. Orgnet.com: Social network analysis software & services for organizations, communities, and their consultants. http://www.orgnet.com.
  • Kulisnkaya [1994] Kulisnkaya, E., 1994. Large sample results for permutation tests of association. Communications in Statistics – Theory and Methods 23, 2939–2963.
  • Kumar et al. [2006] Kumar, R., Novak, J., Tomkins, A., 2006. Structure and evolution of online social networks, in: KDD ’06: Proceedings of the 12th ACM SIGKDD international conference on Knowledge discovery and data mining, ACM, New York, NY, USA. pp. 611–617.
  • Kurant et al. [2011] Kurant, M., Gjoka, M., Butts, C.T., Markopoulou, A., 2011. Walking on a graph with a magnifying glass. arXiv:1101.5463 .
  • Lampe et al. [2007] Lampe, C., Ellison, N.B., Steinfeld, C., 2007. A familiar Face(book): Profile elements as signals in an online social network, in: Proceedings of Conference on Human Factors in Computing Systems. ACM Press, New York, NY, pp. 435–444.
  • Lewis et al. [2008a] Lewis, K., Kaufman, J., Christakis, N.A., 2008a. The taste for privacy: An analysis of college student privacy settings in an online social network. Journal of Computer-Mediated Communication 14, 79–100.
  • Lewis et al. [2008b] Lewis, K., Kaufman, J., Gonzalez, M., Wimmer, M., Christakis, N.A., 2008b. Tastes, ties, and time: A new (cultural, multiplex, and longitudinal) social network dataset using Facebook.com. Social Networks 30, 330–342.
  • Liben-Nowell et al. [2005] Liben-Nowell, D., Novak, J., Kumar, R., Raghavan, P., Tomkins, A., 2005. Geographic routing in social networks. Proceedings of the National Academy of Sciences 102, 11623–11628.
  • Lievrouw and Livingstone [2005] Lievrouw, L.A., Livingstone, S. (Eds.), 2005. The Handbook of New Media. Sage Publications Ltd., London, UK. updated student edition.
  • Looijen and Porter [2007] Looijen, A.H., Porter, M.A., 2007. Legends of Caltech III: Techer in the Dark. Caltech Alumni Association, Pasadena, CA.
  • Lubbers and Snijders [2007] Lubbers, M.J., Snijders, T.A.B., 2007. A comparison of various approaches to the exponential random graph model: A reanalysis of 102 student networks in school classes. Social Networks 29, 489–507.
  • Mayer and Puller [2008] Mayer, A., Puller, S.L., 2008. The old boy (and girl) network: Social network formation on university campuses. Journal of Public Economics 92, 329–347.
  • McPherson et al. [2001] McPherson, M., Smith-Lovin, L., Cook, J.M., 2001. Birds of a feather: Homophily in social networks. Annual Review of Sociology 27, 415–444.
  • Mucha et al. [2010] Mucha, P.J., Richardson, T., Macon, K., Porter, M.A., Onnela, J.P., 2010. Community structure in time-dependent, multiscale, and multiplex networks. Science 328, 876–878.
  • Newman [2003] Newman, M.E.J., 2003. Mixing patterns in networks. Physical Review E 67, 026126.
  • Newman [2006a] Newman, M.E.J., 2006a. Finding community structure in networks using the eigenvectors of matrices. Physical Review E 74, 036104.
  • Newman [2006b] Newman, M.E.J., 2006b. Modularity and community structure in networks. Proceedings of the National Academy of Sciences 103, 8577–8582.
  • Newman [2010] Newman, M.E.J., 2010. Networks: An Introduction. Oxford University Press, Oxford, U.K.
  • Nyland and Near [2007] Nyland, R., Near, C., 2007. Jesus is my friend: Religiosity as a mediating factor in Internet social networking use, in: Paper presented at AEJMC Midwinter Conference. Reno, NV.
  • Onnela et al. [2007] Onnela, J., Saramäki, J., Hyvönen, J., Szabó, G., Lazer, D., Kaski, K., Kertész, J., Barabási, A.L., 2007. Structure and tie strengths in mobile communication networks. Proceedings of the National Academy of Sciences 104, 7332–7336.
  • Porter et al. [2005] Porter, M.A., Mucha, P.J., Newman, M., Warmbrand, C.M., 2005. A network analysis of committees in the United States House of Representatives. Proceedings of the National Academy of Sciences 102, 7057–7062.
  • Porter et al. [2009] Porter, M.A., Onnela, J., Mucha, P.J., 2009. Communities in networks. Notices of the American Mathematical Society 56, 1082–1097, 1164–1166.
  • Rand [1971] Rand, W.M., 1971. Objective criteria for the evaluation of clustering methods. Journal of the American Statistical Association 66, 846–850.
  • Reichardt and Bornholdt [2006] Reichardt, J., Bornholdt, S., 2006. Statistical mechanics of community detection. Physical Review E 74.
  • Richardson et al. [2009] Richardson, T., Mucha, P.J., Porter, M.A., 2009. Spectral tripartitioning of networks. Physical Review E 80, 036111.
  • Robins et al. [2007] Robins, G., Pattison, P., Kalish, Y., Lusher, D., 2007. An Introduction to Exponential Random Graph (psuperscript𝑝p^{*}) Models for Social Networks. Social Networks 29, 173–191.
  • Rosenbloom [2007] Rosenbloom, S., 2007. On Facebook, scholars link up with data. New York Times (17 December).
  • Sodera [2008] Sodera, V., 2008. Rapleaf study reveals gender and age data of social network users Press release, available at http://business.rapleaf.com/company_press_2008_07_29.html.
  • Spertus et al. [2005] Spertus, E., Sahami, M., Büyükkökten, O., 2005. Evaluating similarity measures: A large-scale study in the orkut social network, in: Proceedings of 11th International Conference on Knowledge Discovery in Data Mining. ACM Press, New York, NY, pp. 678–684.
  • Traud et al. [2009] Traud, A.L., Frost, C., Mucha, P.J., Porter, M.A., 2009. Visualization of communities in networks. Chaos 19, 041104.
  • Traud et al. [2010] Traud, A.L., Mucha, P.J., Porter, M.A., Kelsic, E.D., 2010. Comparing community structure to characteristics in online collegiate social networks. ArXiv:0809.0690 (to appear in SIAM Review).
  • Wasserman and Faust [1994] Wasserman, S., Faust, K., 1994. Social Network Analysis: Methods and Applications. Structural Analysis in the Social Sciences, Cambridge University Press, Cambridge, UK.
  • Wasserman and Pattison [1996] Wasserman, S., Pattison, P., 1996. Logit models and logistic regressions for social networks. i: An introduction to markov graphs and psuperscript𝑝p^{*}. Psychometrika 61, 401–425.
  • Waugh et al. [2009] Waugh, A.S., Pei, L., Fowler, J.H., Mucha, P.J., Porter, M.A., 2009. Party polarization in Congress: A network science approach. ArXiv:0907.3509.
  • Weisstein [2011] Weisstein, E.W., 2011. “Barycentric coordinates”, in Wolfram Mathworld. Available at http://mathworld.wolfram.com/BarycentricCoordinates.html .
  • Zhang et al. [2008] Zhang, Y., Friend, A.J., Traud, A., L., Porter, M.A., Fowler, J.H., Mucha, P.J., 2008. Community structure in Congressional cosponsorship networks. Physica A 387, 1705–1712.
  • Zheng et al. [2007] Zheng, R., Provost, F., Ghose, A., 2007. Social network collaborative filtering. Preprint (CeDED working paper).