Quasiparticle interference in antiferromagnetic parent compounds of Fe-based superconductors.
Abstract
Recently reported quasiparticle interference imaging in underdoped Ca(Fe1-xCox)2As2 shows pronounced C2 asymmetry that is interpreted as an indication of an electronic nematic phase with a unidirectional electron band, dispersive predominantly along the -axis of this orthorhombic material. On the other hand, even more recent transport measurements on untwinned samples show near isotropy of the resistivity in the plane, with slightly larger conductivity along (and not ). We show that in fact both sets of data are consistent with the calculated ab initio Fermi surfaces, which has a decisevly broken C4, and yet similar Fermi velocity in both directions. This reconciles completely the apparent contradiction between the conclusions of the STM and the transport experiments.
pacs:
74.20.Pq,74.25.Jb,74.70.XaThe Fe-based superconductors present a new paradigm for high- superconductivity as here Cooper-pairs appear to emerge upon chemical doping from a metallic ground state as opposed from a Mott insulator as found in the celebrated High- cupratesLee . Despite this difference of parent ground state of the Fe- and Cu-based superconductors, similarities lie in that in both cases superconductivity emerges after the suppression of static ordered magnetismI . Although band theory has correctly predicted the unusual antiferromagnetic (AFM) order in the parent compounds of the Fe-based superconductors, it consistently overestimates the tendency to magnetism and underestimates the electronic mass, so there is no doubt that electronic interactions can not be ignored in quantitative descriptions, and that they play a different role compared to cuprates. The exact role of correlations, especially once the parent phase of the Fe-superconductors is doped, has been the focus of much debate and controversy.
An almost universal feature of the Fe-superconductors is that in the parent phases, there is a tetragonal to orthorhombic structural phase transition that is closely associated with the onset of antiferromagnetic orderReview . Upon chemical doping , the onset of the structural and magnetic transitions ( and respectively) decrease with and superconductivity emerges. The physical nature of the cross over from antiferromagnetic order to superconductivity varies between specific materials. In some cases both and coincide while in others is a few degrees higher than Review .
Band structure calculations have suggested that the AFM ordering is accompanied by a strong restructuring of the Fermi surface, with the Fermi surface area being reduced by roughly an order of magnitude. This has been confirmed by optical and Hall measurements that register a drastic reduction of the carrier concentration in the AFM stateOpt_Hall . The calculated AFM Fermi surface consists of several small pockets, which are arranged in the Brillouin zone in a way that strongly breaks the tetragonal symmetry, but each of them is rather isotropic8 . This led to a prediction of small transport anisotropy. An alternative point of view, that associates the orthorhombic transition with orbital (charge) degrees of freedom, suggests a double exchange (metallic) ferromagnetic interaction along one crystallographic direction and a superexchange along the other direction. This picture is also consistent with the observed AFM order and naturally suggests a metallic conductivity along the ferromagnetic chains and a substantially reduced conductivity in the other direction.
Recent experiments on detwinned single crystals support the former point of view: they demonstrate a small anisotropy with the AFM direction being not metallic. However, transport measurments are integrated probes, and also involve possibly anisotropic scattering rate, therefore experiments directly probing the topology of the Fermi surface in the AFM state are highly desirable.
One such experiment has been recently performed by Chuang et al.1 . They have reported quasiparticle interference (QPI) imaging of a lightly cobalt doped sample of CaFe2As2 compound. They interpreted their result in terms of a quasi-1D (“unidirectional”) electronic structure, metallic only along the FM, consistent with above-mentioned orbital picture. On the the other hand, their argumentation was rather indirect, based largly on the fact that directly measured dispersion of the QPI maxima (which was indeed 1D) coincded with the ARPES-measured band dispersion along the the same direction.
In this paper we show that in reality the data of Ref. 1, are consistent with the calculated ab initio Fermi surfaces, and not with the implied in that work 1D bands. This reconciles completely the apparent contradiction between the conclusions of Ref. 1, and the transport measurements on untwinned samples.
The reported STM examination shows a QPI pattern in the momentum space that breaks completely the symmetry, the main features being two bright spots along the (crystallographic direction, with no counterparts along (note that is the direction, and in the antiferromagnetic one). Ref. 1, insists “that the scattering interference modulations are strongly unidirectional, which should occur if the k-space band supporting them is nematic”. However it should be kept in mind that this occurs in that part of the phase diagram where the long-range antiferromagnetic order is fully established, as reflected by the fact that the lattice symmetry is orthorhombic, and the symmetry is already completely broken. Indeed the size of the orthorhombic distortion is not “minute”, as Ref. 1, posits, with %, and is instead comparable with distortions seen in various iron oxides systems. For instance, in the Verwey transition the Fe-O bond dilation is 0.6% with Fe atoms in the same tetrahedral symmetry as in the ferropnictide superconductors6 , and this is usually considered to be a strong distortion. Similarly, in the antiferromagnetic phase of FeO, where the cubic symmetry is completely broken, the structural effect is also on the same order7 .
Since the sample under study is orthorhombic it is misleading to call its electronic structure nematic, as the lattice orthorhombic distortion here is substantial. Nematic phases are frequently found in organic matter. The defining characteristic of these phases is orientational order in the absence of long range positional order, resulting in distinctive uniaxial physical properties. It has also been proposed that nematic order exists in some electronic systems, and may even play a role in mediating high temperature superconductivity4 . Borzi et al5 demonstrated the presence of another interesting phase in Sr3Ru2O7 at millikelvin temperatures and high magnetic fields, which has also been called nematic. In this case, the crystallographic planes were shown to remain strictly tetragonal (withing 0.01%) with structural symmetry, while a pronounced asymmetry in electronic properties was measured. This breaking of the electronic symmetry compared to that of the underlying lattice is now conventionally referred to as electronic nematicity (in fact, even in those cases one has to be careful to distinguish between nematic physics and simply an unusually weak electron-lattice coupling, but this goes beyond the scope of this paper, and in any event is not a concern for Fe pnictides where this coupling is strong).
Since the tetragonal symmetry is decisively broken at the onset of the magnetic order in this ferropnictide, it is clear that the symmetry of the electronic structure defining the structural distortion is also completely broken. What is more important is that while the observed QPI pattern does violate the symmetry, it is clearly not one-dimensional, in the sense that it varies equally strongly along and directions. Thus, interpretation of the data in terms of a 1D electron band does not appear to be possible. To understand this experiment one needs to start with a realistic model for the electronic structure and actually calculate the QPI pattern.
Such calculation has recently been presented by Knolle 11 . They used a weak-coupling theory that interprets tha antiferromagnetic state as resulting from a spin-Peierls transition, with a correspondingly small magnetic moment. Knolle have been able to describe qualitatively the experimental data obtained by Chuang in the sense that their calculated QPI pattern strongly breaks the symmetry, while the band dispersion, on average, remains fairly isotropic in plane. Note that one should not be looking for a quantitative interpretation, since the STM experiment in question did not detect any Ca atoms on the surface, so the sample surface is likely charged with up to 0.5 hole per Fe, and thus any bulk calculation can only be applied to this experiment in a qualitative way. Besides, it was recently shownSS that Fe pnictide systems feature surface states quite different from the bulk that should undoubtedly affect the STM spectra.
However, this result, as mentioned, has been obtained in a weak coupling limit, corresponding to small magnetization, while in this system the ordered magnetic moments are on the order of 1 and local moments even larger2 ; local ; 12 . Not surprisingly, their Fermi surface is rather far from that measure recently on untwinned samples by Wang et alDessau , while the LDA Fermi surface reproduces it quite wellnote . Indeed, this is a known problem in the weak coupling approach: while being physically justified for the paramagnetic parts of the phase diagram, the Fe magnetism in the ordered phases is driven by the strong local Hund rule coupling, and not by the Fermi surface nesting, as assumed in the weak copling models.
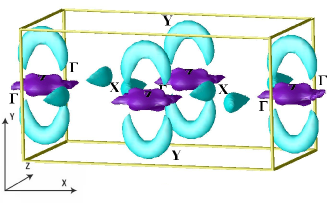
Therefore we have calculated the QPI images for antiferromagnetic CaFe2As2 entirely from first principlesnote2, using the Local Density Approximation (LDA) magnetic moment (somewhat larger that the experimental moment at zero doping). We used the standard linear augmmented plane wave method as implemented in the WIEN2k codeW2k . The corresponding Fermi surface is shown in Fig. 1. We see that the magnetism has a drastic effect on the Fermiology, and the resulting Fermi sirfaces are completely breaking the symmetry. Apart from small quasi-2D tubular pockets, originating from Dirac cones, there is one hole pocket around Z (0,0, or 2,0,0) and two electron pockets between Z and 0,,. It is immediately obvious that the QP scattering between these pockets must exhibit strong interference for scattering along but not
Indeed, we have calculated the QPI function using the known expression (Ref. 9, , Eq. S9)
| (1) |
where we assumed a constant inpurity scattering rate and a constant tunneling matrix elements. This approximation is sufficient for a qualitative or semiquantitative comparison. As explained above, given that the surface in the experiment in question was charged compared to the bulk, a quantitative comparison is meaningless.
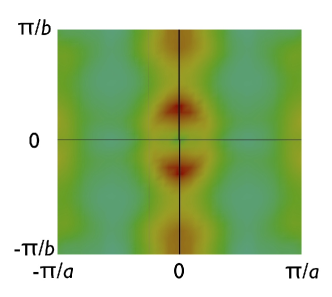
A calculated pattern (there is some dependence on and on but we are interested in the qualitative features only) are shown in Fig.2. One can see iimediately that, very similarly to the patterns obtained in Ref. 1, , two sharp maxima appear at where . The origin of these QPI features is obvious from the Fermi surface (Fig. 1). Note that these LDA calculations have no adjustable parameters, and yet are in excellent qualitative agreement with the QPI images.
It is also worth noting that while the calculated Fermi surfaces completely break the tetragonal symmetry, which is fully reflected in the QPI images, the individual pockets are very three-dimensional, so that the calculated conductivity is comparable for all three directions8 . While experimentally there is up to a 20% charge transport anisotropy8 close to tetragonal to orthorhombic phase boundary in CaFe2As2, it is much less than what would be predicted for a quasi 1D electronic band, and of the opposite sign10 .
It may be worth at this point to explain at some length while a quantitative comparison between a Fourier transform of a tunneling current map, and theoretical calculations, whether ours or any other, is impossible at this stage. Quasiparticle interference, as discussed in many papers, manifests itself in tunneling in a very indirect way. In a sense, it is a multistage process. First, a defect existing near the metal surface, is sdreened by the conducting electrons. This creates Friedel oscillations in the real space. This oscillations are formed by all electrons (mostly those near the Fermi surface, but not only). In a multiband system, it includes electrons originated from different atomic orbitals, such as and As is well known in the theory of tunelling, the rate at which electrons tunnel through vacuum depends drastically on their orbital symmetry, especially on their parity (see, e.g., Ref. EPL ). Indeed tunelling through a wide barrier mainly proceeds through electrons with zero momentum projection onto the interface plane (such electrons have to travel the shortest lengths in the subbarrier regime). If such electrons belong to an odd 2D representation (for d-electrons, all but if is the normal direction), the tunneling rate is suppressed. This effect is well known in spintronics, where it can drastically change the current spin polarization. On the other hand, for a thin barrier the tunneling conductance depends on the number of the conductivity channels, which is given by the density of states (DOS) times normal velocity. In both cases, it is not just the density of quasiparticles, as assumed in Eq. 1 (and in Ref. 11 ), but the DOS weighed by a strongly k-dependent, unknown function.
Nothing is known about the nature of the scattering centers, producing the above mentioned Friedel oscillations. In this particular experiment they may be magnetic or nonmagnetic defects, twin domain boundaries, antiphase domain boundaries, remaining surface Ca ions, and more. Some of these scatterers are strongly anisotropic by nature, others are strongly dependent on the orbital character. We have dropped the scattering matrix elements completely form our consideration. Knolle 11 instead have chosen a specific model for the scattering centers. We believe that without any knowledge about the actual scattering centers in the system any QPI using a particular model is more obscuring the actual physics, compared to the simplest constant matrix elements approximation, rather than clarifying it.
Finally, there are several issues specific for this particular experiment: (1) unknown, but strongly different from the bulk, charge state. As opposed to Ba122, and Sr122, where 1/2 of the alkaline earth atoms stay on the surface, providing charge neutrality, in Ca122 STM does not detect any Ca on the surface, suggesting a strongly charged surface. A corollary of that is appearence of a surface reconstruction (as indeed observed), of a surface relaxation, and, importantly (since tunneling proceeds largely through the surface states), of surface bands (as demonstrated, for instance, in Ref. sb .
While the above considerations preclude a quantitative comparison and extracting quantitative analysis of the experiment in question, we see, particularly when comparing our calculations with those of Knolle 11 , that the QPI structure observed in Ref. 1, is a very universal consequence of the long-range stripe-type antiferromagnetic ordering. Indeed, Knolle calculations were built upon a besically incorrect band structure and fermi surfaces, an used a weak coupling nesting scenario for the antiferromagnetism, while in reality the magnetism in pnictides is a strong coupling phenomenos; yet, their calculations produced a “unidirectional” QPI pattern just as well. Together with the strong-coupling LDA calculations, this span a large range of possible models, indicating that the symmetry is strongly broken in QPI images with simply by virtue of the long range AFM order, whatever the the origin of this order.
Last but not least, we can also predict, from our calculations, that this symmetry will be also broken, although the peaks are likely to be substantially broaden, in the truly phase (see review 2 for a discussion), that is to say, the phase between the long-range magnetic transition and the structural orthorhombic transition.
References
- (1) T.-M. Chuang, M. P. Allan, J. Lee, Y. Xie, N. Ni,S. L. Bud’ko, G. S. Boebinger, P. C. Canfield, J. C. Davis, Science, 327, 181 (2010).
- (2) M.A. Tanatar, E. C. Blomberg, A. Kreyssig, M. G. Kim, N. Ni, A. Thaler, S. L. Bud’ko, P. C. Canfield, A. I. Goldman, I. I. Mazin, and R. Prozorov, Phys. Rev. B 81, 184508 (2010).
- (3) P.A. Lee, N. Nagaosa, X.-G. Wen, Rev. Mod. Phys. 78, 17 (2006)
- (4) I. I. Mazin, Nature, 464, 183 (2010).
- (5) D.C. Johnston, Adv. in Phys., 59, 803 (2010)
- (6) W. Z. Hu, J. Dong, G. Li, Z. Li, P. Zheng, G. F. Chen, J. L. Luo, and N. L. Wang, Phys. Rev. Lett. 101, 257005 (2008); L. Fang, H. Luo, P. Cheng, Z. Wang, Y. Jia, G. Mu, B. Shen, I. I. Mazin, L. Shan, C. Ren, and H.-H. Wen, Phys. Rev. B 80, 140508 (R) (2009); F. Rullier-Albenque, D. Colson, A. Forget, and H. Alloul, Phys. Rev. Lett. 103, 057001 2009
- (7) J. P. Wright, J. P. Attfield, and P. G. Radaelli, Phys. Rev. Lett. 87, 266401 (2001).
- (8) D.G. Isaak, R. E. Cohen, M. J. Mehl, and D. J. Singh Phys. Rev. B 47, 7720 (1993).
- (9) S.A. Kivelson, E. Fradkin, and V.J. Emery, Nature 393, 550 (1998).
- (10) R. A. Borzi, R. A. Borzi, S. A. Grigera, J. Farrell, R. S. Perry, S. J. S. Lister, S. L. Lee, D. A. Tennant, Y. Maeno, A. P. Mackenzie, Science, 315, 214 (2006)
- (11) J. Knolle, I. Eremin, A. Akbari, R. Moessner, Phys. Rev. Lett. 104, 257001 (2010)
- (12) E. van Heumen, J. Vuorinen, K. Koepernik, F. Massee, Y. Huang, M. Shi, J. Klei, J. Goedkoop, M. Lindroos, J. van den Brink, M. S. Golden, arXiv:1009.3493 (unpublished).
- (13) I.I. Mazin and J. Schmalian, Physica C, 469, 614-627 (2009).
- (14) M.D. Johannes, I.I. Mazin, D.S. Parker, Phys. Rev. B 82, 024527 (2010)
- (15) M.D. Johannes and I.I. Mazin, Phys. Rev. B 79, 220510(R) (2009)
- (16) Q. Wang, Z. Sun, E. Rotenberg, F. Ronning, E.D. Bauer, H. Lin, R.S. Markiewicz, M. Lindroos, B. Barbiellini, A. Bansil, D.S. Dessau, arXiv:1009.0271 (unpublished).
- (17) Compared to Ref. Dessau , both 1 and 2 bands are present, their nontrivial crescent shape is reproduced, their size and location (around the Z point) are consistent with the calculation. Not that these pockets are mainly responsible for the QPI peak in our Fig. 2. The flattish pocket is also in excellent agreement with the calculation, although in the experiment it is split into 3 and 4 (probably an effect of the surface reconstruction). The claimed experimental bands (1, 2, 1 and 2) along Z-X are quite messy. The calculations predict small pockets there located roughly where ARPES sees some bands. These are formed by the famous “Dirac cones”. The only feature that does not find any correspondence in the calculation is the long segment “2” stretched along . This may be a surface state similar to those discovered in Ref. SS, (note that this band is drawn rather speculatively, the corresponding signal is really weak). This agreement is even more impressive given that the Fermi surface reproduced here was published 7 months ago (Ref. 8, ), well before any untwinned ARPES data became known. from 1D bands.
- (18) P. Blaha et al., computer code WIEN2K, Technische Universität Wien, Austria, 2001;
- (19) T. Hanaguri, T. Hanaguri, Y. Kohsaka, M. Ono, M. Maltseva, P. Coleman, I. Yamada, M. Azuma, M. Takano, K. Ohishi, and H. Takagi, Science 323, 923 (2009).
- (20) Measurement of charge transport in Co-doped BaFe2As2 reported by J-H. Chu, J. G. Analytis, K. De Greve, P. L. McMahon, Z. Islam, Y. Yamamoto, and I. R. Fisher, Science 329, 824 (2010), show a larger a/b anisotropy close to the orthorhombic transition, which we believe not to be representative of the CaFe2As2 upon which the STM measurements of Ref. 1, were taken. Regardless, the values of a factor of 2 anisotropy for doped samples in that study still remain too low to be associated with the large anisotropies expected from a unidirections band structure suggested in Ref. 1, , and are of the opposite sign.
- (21) I. I. Mazin, Europhys. Lett., 55, 404, 2001
- (22) E. van Heumen, J. Vuorinen, K. Koepernik, F. Massee, Y. Huang, M. Shi, J. Klei, J. Goedkoop, M.i Lindroos, J. van den Brink, M. S. Golden, http://arxiv.org/abs/1009.3493 (unpublished)