Iron vacancy superstructure and possible room temperature antiferromagnetic order in superconducting
Abstract
Neutron and x-ray powder and single crystal synchrotron diffraction of show the presence of superstructure reflections with propagation vector k= with respect to the average crystal structure (Å). The propagation vector star corresponds to the 5 times bigger unit cell given by transformation A=2a+b, B= -a+2b, C= c. A solution for the atomic structure is found in the space groups and with an ordered pattern of iron vacancies corresponding to the iron deficiency and Cs stoichiometry . The superstructure satellites are more pronounced in the neutron diffraction patterns suggesting that they can have some magnetic contribution. We have sorted out possible symmetry adapted magnetic configurations and found that the presence of AFM ordering with the ordered magnetic moment of Fe with does not contradict to the experimental data. However, the solutions space is highly degenerate and we cannot choose a specific solution. Instead we propose possible magnetic configurations with the Fe magnetic moments in -plane or along -axis. The superstructure is destroyed above K by a first-order-like transition.
pacs:
75.50.Ee, 75.25.-j, 61.05.C-, 74.90.+nI Introduction
The recent discovery of the Fe-based superconductors has triggered a remarkable renewed interest for possible new routes leading to high-temperature superconductivity. As observed in the cuprates, the iron-based superconductors exhibit interplay between magnetism and superconductivity suggesting the possible occurrence of unconventional superconducting states. Other common properties are the layered structure and the low carrier density. Among the iron-based superconductors has the simplest structure with layers in which Fe cations are tetrahedrally coordinated by Se Hsu et al. (2008). Recently superconductivity at about 30K was found in for X=K, Cs, Rb Guo et al. (2010); Krzton-Maziopa et al. (2011); Wang et al. (2010). Muon-spin rotation/relaxation (SR) experiments evidence that the superconducting state observed in below 28.5(2) K is microscopically coexisting with a magnetic phase with a transition temperature at K Shermadini et al. (2011). The magnetic phase appears characterized by rather large static iron-moments as the SR signal is wiped out below . Very recently the AFM order was reportedBao et al. (2011) in superconducting with K with the iron magnetic moment 3.31 .
The average crystal structure of is the same as in the layered (122-type) iron pnictides with the space group Rotter et al. (2008). Different types of iron vacancy ordering in were observed long time ago Sabrowsky et al. (1986); Haggstrom et al. (1991), including the one with 5 times bigger unit cell. Due to renewed interest to the superconducting chalcogenides many new experimental studies on the vacancy ordering in (X=K,Tl) have appeared very recently Fang et al. (2010); Wang et al. (2011); Zavalij et al. (2011); Wang et al. (2011); Bacsa et al. (2011); Bao et al. (2011).
In the present paper we report on the observation of superstructure in superconducting ( K) below K and analyze the diffraction data assuming iron vacancy ordering and possible antiferromagnetic ordering of Fe at room temperature. The single crystals used in the present study are the same as in the Refs. Krzton-Maziopa et al. (2011); Shermadini et al. (2011)
II Samples. Experimental
Single crystals of cesium intercalated iron selenides of nominal compositions were grown from the melt using the Bridgman method as described in Ref. Krzton-Maziopa et al. (2011). Powder x-ray diffraction was performed using a D8 Advance Bruker AXS diffractometer with CuKα radiation. For these measurements a fraction of the crystal was cleaved, powdered, and loaded into the low background airtight specimen holder in a He-glove box to protect the powder from oxidation. Differential scanning calorimetry (DSC) experiments were performed with a Netzsch DSC 204F1 system. Measurements were performed on heating and cooling with a rate of 10 K/min using 20 mg samples encapsulated in standard Al crucibles. An argon stream was used during the whole experiment as protecting gas. Neutron powder diffraction experiments were carried out at the SINQ spallation source of Paul Scherrer Institute (Switzerland) using the high-resolution diffractometer for thermal neutrons HRPT Fischer et al. (2000) ( Å, high intensity mode ). Refinement of crystal and magnetic structures of powder neutron diffraction data were carried out with FULLPROF Rodriguez-Carvajal (1993) program, with the use of its internal tables for scattering lengths and magnetic form factors. Single crystal diffraction data were collected at the SNBL beamline BM1A at the ESRF synchrotron in Grenoble (France) with a MAR345 image-plate area detector using Å. Intensities were indexed and integrated with CrysAliscry (2006), empirical absorption correction was made with SADABS Sheldrick (University of Goettingen, Germany, 2002), structure refinement with SHELXL97Sheldrick (University of Goettingen, Germany, 1997).
III Results and discussion
| x-ray | NPD | NPD, | s.c. x-ray | |
| 300 K | 300 K | 300 K | 536 K | |
| a | 3.9608(2) | 3.9614(2) | 8.8582(3) | 4.0177(5) |
| c | 15.285(1) | 15.2873(9) | 15.2873(9) | 15.333(4) |
| z-Se | 0.3456(4) | 0.3436(3) | -0.343(3) | 0.3443(3) |
| o-Cs | 0.636(13) | 0.622(24) | 0.73(1) | 0.754(9) |
| o-Fe1 | 1.48(3) | 1.49(3) | 1.50(2) | 1.66(8) |
| o-Fe2 | 0.024(8) | |||
| B-Fe | 1.4(3) | 1.7(1) | 2.1(1) | 1.3(2) |
| B-Se | 4.3(2) | 3.6(1) | 3.2(1) | 1.2(2) |
| B-Cs | 2.6(3) | 4.8(5) | 5.9(5) | 3.2(2) |
| ,% | 5.95 | 7.47 | 7.12 | 21 |
| 3.6 | 3.3 | 2.86 | 1.4 |
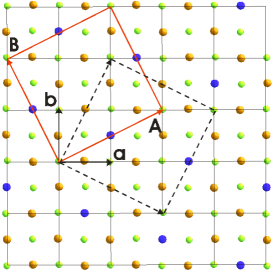
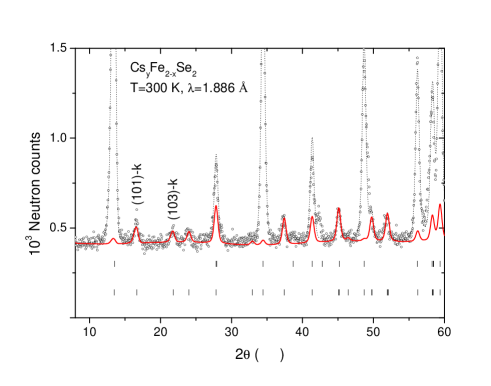
The average crystal structure can be refined in the standard structure model Krzton-Maziopa et al. (2011). The iron site occupancy is refined to smaller than unity for both x-ray and neutron diffraction data indicating the presence of the vacancies on the iron sites. The structure parameters refined in this model are presented in Table 1 for both laboratory x-ray and NPD data. The neutron diffraction pattern has a set of extra diffraction peaks that can be indexed with the propagation k-vector k=, as shown in Fig. 1. However the x-ray powder diffraction pattern contains only one clearly visible satellite at Å-1, that allows one to suggest that the satellites seen by neutron might have magnetic contribution. The propagation vector star corresponds to the new unit cell given by the transformation A=2a+b, B= -a+2b, C= c (the illustration of the lattice cell transformation is shown in Fig. 2). A good refinement of NPD pattern explaining the satellite peaks can be done with the supercell indicated above in the space groups and . Using the fixed new atomic positions generated from the average crystal structure () by applying the above basis transformation and releasing only the site occupancies and -Se, similar as for the average structure, one immediately gets a reasonably good description of the superstructure peaks. Table 1 shows the atomic positions and details of the refinements. The Fe site splits in two sites in (no. 87) and in three sites in [no. 86, note to work in the second setting with origin at post-matrix translation should be applied]. Both groups give similar quality of the refinements of the single crystal data as we explain below, so we present the results only for space group, which is more symmetric with respect to the iron sites. The atomic positions for space group generated by the above transformation from average space group are listed in Table 1. All “symmetric” positional parameters which were generated from the special coordinates of were fixed in the refinement. The fully occupied Fe1 (16i) site contributes 1.6 of iron stoichiometry in . If both site occupancies are refined, Fe1 gets almost maximal value, whereas Fe2 (4d) site occupancy is close to zero, as shown in the Table 1. The iron vacancy pattern looks like as shown in Fig. 2.
| x y z | occ | ||
|---|---|---|---|
| Cs1 | 0.0000 0.0000 0.0000 | 78(2) | 0.911(14) |
| Cs2 | 0.4041(2) 0.8057(2) 0.000 | 75(2) | 0.81(1) |
| Se1 | 0.3924(2) 0.7987(2) 0.6551(2) | 55(2) | 1 |
| Se2 | 0.5000 0.5000 0.1488(2) | 54(2) | 1 |
| Fe1 | 0.3014(1) 0.5938(1) 0.25165(6) | 59(2) | 1 |
| Fe2 | 0.5000 0.0000 0.2500 | 56(9) | 0.27(2) |
| Cs1 | 92(2) | 92(2) | 49(4) | 0 | 0 | 0 |
| Cs2 | 84(2) | 93(2) | 49(3) | 0 | 0 | 3.9(7) |
| Se1 | 61(2) | 59(2) | 45(2) | 2.1(5) | 1.1(5) | 1.6(5) |
| Se2 | 58(2) | 58(2) | 44(3) | 0 | 0 | 0 |
| Fe1 | 63(3) | 62(2) | 51(4) | 0.8(7) | -1.1(6) | -0.1(7) |
| Fe2 | 62(10) | 62(10) | 45(16) | 0 | 0 | 0 |
| , | ||||||||
|---|---|---|---|---|---|---|---|---|
| 1 | 1 | 1 | 1 | -1 | -1 | -1 | -1 | |
| 1 | i | -1 | -i | 1 | i | -1 | -i | |
| 1 | -1 | 1 | -1 | 1 | -1 | 1 | -1 | |
| 1 | -i | -1 | i | 1 | -i | -1 | i | |
| 1,0 | 0,-i | 1,0 | 0,-i | -1,0 | -1,0 | 0,i | 0,i | |
| 0,1 | i,0 | 0,1 | i,0 | 0,-1 | 0,-1 | -i,0 | -i,0 | |
| 1 | i | -1 | -i | 1 | i | -1 | -i |
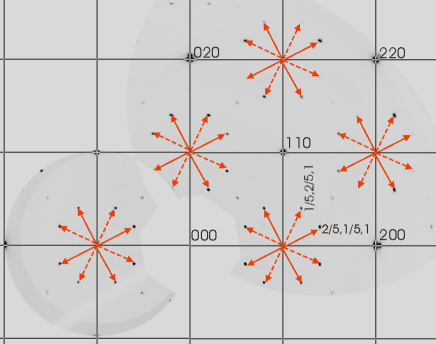
Since both vacancy superstructure and possible magnetic structure with contribute to the same neutron Bragg peaks one needs the reliable crystal structure data to disentangle possible magnetic contribution. For this purpose several data sets were collected in the single crystal x-ray synchrotron experiment at room temperature and at 536K above and . In addition, a limited slice of reciprocal space around satellite was collected at heating to identify the transition. Figure 3 shows a slice of the reciprocal space near plane. The superstructure reflections belonging to two domains as shown in the figure can be easily identified. The angle between the domains amounted to 53.2o in accordance with the drawing of Fig. 2. Note that the extra peaks are centered around forbidden nodes, because they are satellites of the Bragg peaks from the adjacent and planes. The refined structure parameters together with the reliability factors are given in the Table 2. Due to the strong absorption correction effects the atomic displacement parameters ADP can have an overall systematic shift. The refinement of the single crystal data in space group gives slightly worse, but still acceptable reliability factors that we list here for completeness R1 = 0.0860, wR2 = 0.2131 [] and R1 = 0.1283, wR2 = 0.2885 (all data). One can notice additional diffraction spots at in Fig. 3. These spots are actually a projection of satellite rods at . The in-plane propagation vector is equal to in both average cell and supercell. We do not have any model to account for this additional superstructure, but it must correspond to a 2D-ordering within the -plane, e.g. an ordering of vacancies in Cs layers without correlations between the layers along -axis.
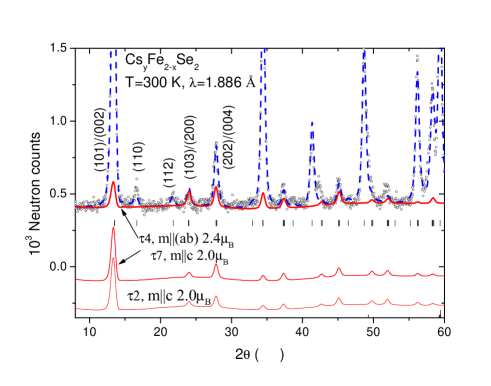
Using the structure data for from the single crystal x-ray experiment we made an attempt to evaluate the magnetic contribution in the NPD data. We assume that only fully occupied Fe1 site has a magnetic moment. All the structure parameters from Table 2 where fixed in the subsequent NPD refinements. Only overall ADP was introduced to account for the absorption effects in the x-ray experiment. The space group has eight one dimensional irreducible representations (irreps) for , and all eight irreps enter three times in the magnetic representation for the iron in general (16i) position. The irreps in Kovalev notation Kovalev (1993) are listed in Table 3. There are four complex irreps with Herring coefficient 0 and four real irreps that correspond to the respective Shubnikov groups of . We sorted out all the irreps and found that there are different magnetic configurations with the moment size about 2 per iron site that do not contradict to the NPD data. The magnetic R-factors amounted to 17.5-24.5% for different irreps. For the illustration of the magnetic contribution we show in Table 3 and in Fig. 4 two “orthogonal” magnetic models. For we choose the basis functions with the moments in the (ab) plane, whereas for the moments are parallel to -axis. Both models have practically the same magnetic Bragg R-factors 18.5 and 17.5%, respectively. We note that the magnetic moment sizes on the Fe1 sites are not restricted to be the same by symmetry for complex irreps even if we consider the basis function only along one axis. For instance can be multiplied by an arbitrary phase factor that would result in two different moment values. By choosing the phase all the moments are constrained to be the same.
The model proposed in Ref. Bao et al. (2011) corresponds to with the Shubnikov symbol . Unfortunately, we do not observe an explicit magnetic contributions in (101) Bragg peak as observed in Ref. Bao et al. (2011) in K-intercalated . This might be partially due to the fact that for the lattice constants of the (101) and (002) appear at the same scattering angle. In addition, in our case of the magnetic contribution is not so large. For comparison we show also the contribution of this model () to the diffraction pattern (Fig. 4). One can see that the contributions of both and models are very similar (there are small differences hardly visible on the figure scale), but the magnetic configurations are different, namely for the constant moment configuration corresponding to the operators listed in the table are 1,-1,-1,1,1,-1,-1,1, whereas for 1,1,1,1,-1,-1,-1,-1. Probably the model would also fit the data of Ref. Bao et al. (2011). We would like to stress that the possible solutions are highly degenerate by the values of the R-factors and we cannot choose a specific model on the basis of our experimental data.
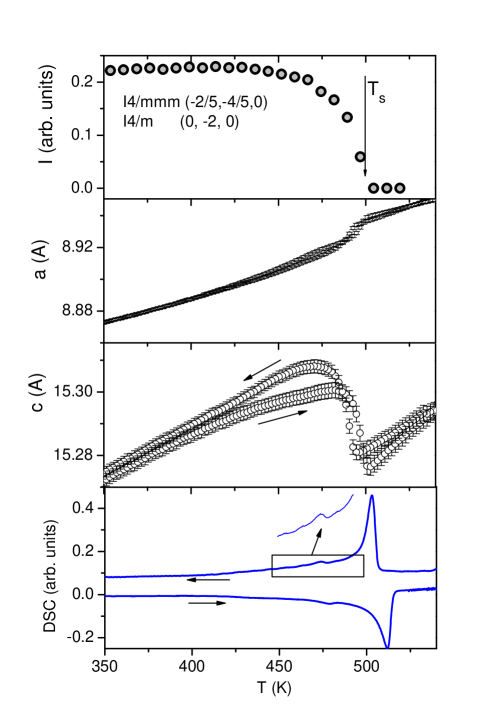
Figure 5 shows the integrated intensity of the superstructure satellite and the lattice constants as a function of temperature obtained in the single crystal and powder synchrotron diffraction experiments. The intensity gradually disappears with transition temperature K, whereas the lattice constants exhibit a pronounced hysteresis indicating a first order phase transition. The unit cell volume is linear and does not have a visible peculiarity in the temperature region shown in Fig. 5. Interestingly, the -lattice constant shows a decrease by 0.1% at the transition to the disordered phase. The crystal structure above is well refined in the model (Table 1). The DSC signal has two peaks, one large at higher temperature and the second small one at lower temperature, which had been associated with the onset of the magnetic order from -experiment Shermadini et al. (2011). The large DSC peak seems to be originated from the vacancy order-disorder transition at K.
Acknowledgements
The authors acknowledge the allocation of the beam time at Swiss-Norwegian beam line (BM1A) of the European Synchrotron Radiation Facility (ESRF, Grenoble, France). Fruitful discussions with A. Bosak are gratefully acknowledged. The authors thank the NCCR MaNEP project and Sciex-NMSch (Project Code 10.048) for the support of this study. The work was partially performed at the neutron spallation source SINQ.
References
- Hsu et al. (2008) F.-C. Hsu, J.-Y. Luo, K.-W. Yeh, T.-K. Chen, T.-W. Huang, P. M. Wu, Y.-C. Lee, Y.-L. Huang, Y.-Y. Chu, D.-C. Yan, et al., Proc. Natl. Acad. Sci. U.S.A. 105, 14262 (2008).
- Guo et al. (2010) J. Guo, S. Jin, G. Wang, S. Wang, K. Zhu, T. Zhou, M. He, and X. Chen, Phys. Rev. B 82, 180520 (2010).
- Krzton-Maziopa et al. (2011) A. Krzton-Maziopa, Z. Shermadini, E. Pomjakushina, V. Pomjakushin, M. Bendele, A. Amato, R. Khasanov, H. Luetkens, and K. Conder, Journal of Physics: Condensed Matter 23, 052203 (2011), URL http://stacks.iop.org/0953-8984/23/i=5/a=052203.
- Wang et al. (2010) A. F. Wang, J. J. Ying, Y. J. Yan, R. H. Liu, X. G. Luo, Z. Y. Li, X. F. Wang, M. Zhang, G. J. Ye, P. Cheng, et al., ArXiv e-prints (2010), eprint arxiv:1012.5525.
- Shermadini et al. (2011) Z. Shermadini, A. Krzton-Maziopa, M. Bendele, R. Khasanov, H. Luetkens, K. Conder, E. Pomjakushina, S. Weyeneth, V. Pomjakushin, O. Bossen, et al., ArXiv e-prints (2011), eprint arxiv:1101.1873.
- Bao et al. (2011) W. Bao, Q. Huang, G. F. Chen, M. A. Green, D. M. Wang, J. B. He, X. Q. Wang, and Y. Qiu, ArXiv e-prints (2011), eprint arxiv:1102.0830.
- Rotter et al. (2008) M. Rotter, M. Tegel, and D. Johrendt, Phys. Rev. Lett. 101, 107006 (2008).
- Sabrowsky et al. (1986) H. Sabrowsky, M. Rosenberg, D. Welz, P. Deppe, and W. Schafer, J. Magn. Magn. Mater. 54-7, 1497 (1986), ISSN 0304-8853.
- Haggstrom et al. (1991) L. Haggstrom, A. Seidel, and R. Berger, J. Magn. Magn. Mater. 98, 37 (1991), ISSN 0304-8853.
- Fang et al. (2010) M. Fang, H. Wang, C. Dong, Z. Li, C. Feng, J. Chen, and H. Q. Yuan, ArXiv e-prints (2010), eprint arxiv:1012.5236.
- Wang et al. (2011) Z. Wang, Y. J. Song, H. L. Shi, Z. W. Wang, Z. Chen, H. F. Tian, G. F. Chen, J. G. Guo, H. X. Yang, and J. Q. Li, ArXiv e-prints (2011), eprint arxiv:1101.2059.
- Zavalij et al. (2011) P. Zavalij, W. Bao, X. F. Wang, J. J. Ying, X. H. Chen, D. M. Wang, J. B. He, X. Q. Wang, G. F. Chen, P. Hsieh, et al., ArXiv e-prints (2011), eprint arxiv:1101.4882.
- Bacsa et al. (2011) J. Bacsa, A. Y. Ganin, Y. Takabayashi, K. E. Christensen, K. Prassides, M. J. Rosseinsky, and J. B. Claridge, ArXiv e-prints (2011), eprint arxiv:1102.0488.
- Fischer et al. (2000) P. Fischer, G. Frey, M. Koch, M. Koennecke, V. Pomjakushin, J. Schefer, R. Thut, N. Schlumpf, R. Buerge, U. Greuter, et al., Physica B 276-278, 146 (2000).
- Rodriguez-Carvajal (1993) J. Rodriguez-Carvajal, Physica B 192, 55 (1993).
- cry (2006) CRYSALIS Software System, Ver. 1.171.31.4, Oxford-diffraction Ltd., Oxford (England) (2006).
- Sheldrick (University of Goettingen, Germany, 2002) G. M. Sheldrick, SADABS, Version 2.06 (University of Goettingen, Germany, 2002).
- Sheldrick (University of Goettingen, Germany, 1997) G. M. Sheldrick, SHELXL97 (University of Goettingen, Germany, 1997).
- Kovalev (1993) O. V. Kovalev, Representations of the Crystallographic Space Groups: irreducible representations, induced representations, and corepresentations (Gordon and Breach Science Publishers, 1993), 2nd ed.