Contemporaneous Chandra HETG and Suzaku X-ray Observations of NGC 4051
Abstract
We present the results of a deep 300 ks Chandra HETG observation of the highly variable narrow-line Seyfert Type 1 galaxy NGC 4051. The HETG spectrum reveals 28 significant soft X-ray ionised lines in either emission or absorption; primarily originating from H-like and He-like K-shell transitions of O, Ne, Mg and Si (including higher order lines and strong forbidden emission lines from O vii and Ne ix) plus high ionisation L-shell transitions from Fe xvii to Fe xxii and lower ionisation inner-shell lines (e.g. O vi). Modelling the data with xstar requires four distinct ionisation zones for the gas, all outflowing with velocities <1 000 km s-1. A selection of the strongest emission/absorption lines appear to be resolved with FWHM of 600 km s-1. We also present the results from a quasi-simultaneous 350 ks Suzaku observation of NGC 4051 where the XIS spectrum reveals strong evidence for blueshifted absorption lines at 6.8 and 7.1 keV, consistent with previous findings. Modelling with xstar suggests that this is the signature of a highly ionised, high velocity outflow (log ; ) which potentially may have a significant effect on the host galaxy environment via feedback. Finally, we also simultaneously model the broad-band 2008 XIS+HXD Suzaku data with archival Suzaku data from 2005 when the source was observed to have entered an extended period of low flux in an attempt to analyse the cause of the long-term spectral variability. We find that we can account for this by allowing for large variations in the normalisation of the intrinsic power-law component which may be interpreted as being due to significant changes in the covering fraction of a Compton-thick partial-coverer obscuring the central continuum emission.
keywords:
accretion, accretion discs – atomic processes – X-rays: galaxies1 Introduction
Recent systematic X-ray studies of AGN (Active Galactic Nuclei) with ASCA, Chandra, XMM-Newton and Suzaku have established that at least half of all active galaxies host photo-ionised “warm” absorbers (e.g. Reynolds & Fabian 1995; Blustin et al. 2005) and that they may in fact be ubiquitous in AGN, becoming observable only in certain lines of sight (Krongold et al. 2008; although one other interpretation is that 50 per cent of AGN do not have warm absorbers). When observed at high spectral resolution (such as with the transmission gratings on-board Chandra), these absorbers are known to produce numerous narrow absorption features ranging from various elements such as oxygen, silicon, neon, carbon, nitrogen, sulphur, magnesium and iron (e.g. Kaspi et al. 2002; Crenshaw, Kraemer & George 2003; McKernan, Yaqoob & Reynolds 2007). The associated lines are often blueshifted, thus implying outflowing winds (ranging in velocity from several hundred to several thousand km s-1; Blustin et al. 2005) and arise from a wide range of column densities and levels of ionisation. Through the study of blueshifted absorption lines of K-shell Fe, recent observations of higher luminosity AGN have also suggested the presence of highly ionised (“hot”) absorbers originating in high-velocity disc winds () with around a dozen cases to date (e.g. PG 1211+143, Pounds et al. 2003; PDS 456, Reeves, O’Brien & Ward 2003) although there are a set of lower luminosity sources that still exhibit deep absorption lines at Fe K but require high column densities and have outflow velocities on the order of a few thousand km s-1 (e.g. Mrk 776, Miller et al. 2007; NGC 3516, Turner et al. 2005; NGC 1365, Risaliti et al. 2005; NGC 3783, Reeves et al. 2004). Recently, Tombesi et al. (2010) found evidence for blueshifted features in 17 objects within their sample of 42 radio-quiet AGN observed with XMM-Newton, detecting 22 absorption lines at rest-frame energies >7.1 keV. This implies that high velocity outflows may be a common feature in radio-quiet AGN. Such ultra-fast outflows indicate that the gas must be located very close to the nucleus of the AGN and so deep studies of these objects are vital to establish a greater understanding of the outflow kinematics and locations relative to the central continuum source which in turn can help to ultimately unravel the inner structure of AGN.
One possible interpretation regarding accretion disc outflows is that they are perhaps produced as a result of radiation pressure a few from the event horizon (Proga, Stone & Kallman 2000). The high luminosities of these systems are the result of radiatively efficient accretion onto a supermassive black hole (SMBH) and such outflows could be a consequence of near-Eddington accretion (King & Pounds 2003). An alternative interpretation of many outflows is that they could be magnetohydrodynamically (MHD) driven as has been suggested for such objects as GRO J1655-40 (Miller et al. 2008) and NGC 4151 (Kraemer et al. 2005; Crenshaw & Kraemer 2007). The derived outflow rates can in some cases be comparable to the mass accretion rate (several Solar masses per year) of the AGN and so in terms of kinetic power, the outflow can be responsible for a significant proportion of the bolometric luminosity. As a result, outflows are considered to be an important phenomenon in AGN and are believed to play a key role in feedback processes between the black hole and the host galaxy (King 2003, 2010), ultimately leading to the observed – relation for galaxies (Ferrarese & Merritt 2000; Gebhardt et al. 2000).
NGC 4051 is a nearby (; Verheijen & Sancisi 2001) narrow-line Type 1 Seyfert Galaxy at a distance of 15.2 Mpc (Russel 2004) obtained from the Tully-Fisher relation for nearby galaxies (Tully & Fisher 1977). It has a black hole mass of M⊙ determined via optical reverberation mapping (Denney et al. 2009) and is well known for its extreme X-ray variability both on short and long time-scales with the X-ray spectrum hardening as the source flux becomes lower (Lamer et al. 2003), as seen in many other Type 1 Seyfert Galaxies (e.g. NGC 5506, Lamer, Uttley & McHardy 2000; MCG-6-30-15, Vaughan & Edelson 2001).
The warm absorber in NGC 4051 was studied by Collinge et al. (2001) with a simultaneous Chandra HETG (High Energy Transmission Grating) and Hubble Space Telescope (HST) Imaging Spectrograph observation where they discovered two separate X-ray absorption systems corresponding to outflow velocities of and km s-1. Nine separate absorption systems were detected in the HST UV spectrum with one of the zones possibly corresponding to the lower velocity zone detected in the X-ray band. A further RGS (Reflection Grating Spectrometer) observation with XMM-Newton was analysed by Ogle et al. (2004) who claimed the presence of a relativistically broadened O viii Ly emission line (EW eV) at 655 eV and suggested that this emission along with its associated radiative recombination continuum (RRC) could be responsible for the weak soft excess. However, they found no evidence of the high velocity outflow detected by Collinge et al. (2001). The RGS data from 2001 and 2002 were also analysed by Pounds et al. (2004a) and Nucita et al. (2010). They note that the 2002 observation caught the source during an extended period of low flux ( erg cm-2 s-1). Pounds et al. (2004a) concluded that the hard X-ray spectral shape observed during this period of low flux was due to an increase in opacity of a substantial column of gas in the line-of-sight causing the spectrum to become dominated by a quasi-constant cold reflection component.
A more recent study by Krongold et al. (2007) showed the presence of two distinct ionisation components for the absorber through a 100 ks XMM-Newton exposure. By measuring the electron densities through the absorber variability, they inferred that the absorbing components must be compact with the high and low ionisation zones existing at distances of 0.5–1 l-d (light-days) and <3.5 l-d from the central engine respectively, well within the dusty torus and strongly suggestive of an accretion disc origin for the warm absorber wind. They calculated that the implied mass outflow rate of the warm absorber wind corresponds to approximately 2–5 per cent of the mass accretion rate of the source. They also detected several narrow emission lines in the RGS spectrum from C vi, N vi, O vii, O viii, Ne ix and Fe xvii.
A further study of the warm absorber was also undertaken by Steenbrugge et al. (2009) through high-resolution X-ray spectroscopy using the Chandra LETG (Low Energy Transmission Grating). They discovered that this object contains an outflowing wind consisting of four separate absorbing components ranging in ionisation parameter, log , from 0.07 to 3.19. They found that the absorbing zone with log requires a high outflow velocity of km s-1 and from a study of the variability of the warm absorber, they inferred that three of the four absorbing zones appear to be located in the range of 0.02–1 pc from the black hole.
NGC 4051 was observed in 2005 with Suzaku when it was found to have fallen into an extended period of historically low flux (Terashima et al. 2009). A strong excess of emission was seen at energies >10 keV suggesting that the primary power-law continuum had largely disappeared and that the bulk of the observed emission was reflection-dominated (e.g. Guainazzi et al. 1998; Pounds et al. 2004a). However, Terashima et al. (2009) were able to describe the data using a partial covering model whereby the reflection-dominated emission and the intrinsic power-law emission are independently absorbed by gas covering some significant fraction of sr. In this scenario, changes in the covering fraction of the partially-covered power-law component can account for the changes in the spectral shape at low energies whereas changes in the normalisation of the power-law component overlaid on a nearly constant hard component can account for the variability at energies >3.5 keV. This interpretation of the long-term spectral variability being caused by the primary X-ray continuum disappearing from view leaving behind a constant, hard, reflection-dominated component was supported by the results of Miller et al. (2010) through principal components analysis (PCA) of the 2005 and 2008 Suzaku data. Miller et al. (2010) also suggested that the low-flux states are caused by variable partial covering obscuring the central engine which also explains the constancy of the narrow Fe K emission line flux.
Finally, the presence of an additional absorption feature at 7.1 keV was reported by Pounds et al. (2004a) indicating that a highly ionised, high velocity outflow could be apparent in this source. Further observations with Suzaku and XMM-Newton have confirmed the presence of this feature along with an additional absorption line at 6.8 keV (Terashima et al. 2009; Pounds & Vaughan 2010, submitted). If the two absorption lines are associated with K-shell transitions from Fe xxv and Fe xxvi then their blueshift would imply that the material is outflowing with a velocity of .
Here we report on a 300 ks Chandra HETG (High Energy Transmission Grating) observation of NGC 4051 where we aim to study the soft X-ray warm absorber in detail (Sections 4 and 5). We also report on a contemporaneous 350 ks Suzaku observation where we study the Fe K band including the blueshifted Fe K absorption lines as the signature of the highest ionisation component of the outflowing wind. We then proceed to analyse the entire broad-band Suzaku spectrum from 0.5–50.0 keV. Finally, with a combined analysis of the 2005 archival Suzaku data (exposure time 120 ks) when the source was found to be in an extended period of low flux, we also aim to study the origin of the long-term X-ray variability of this AGN (Section 6).
2 Observations and Data Reduction
2.1 Chandra Analysis
NGC 4051 was observed with the Chandra X-ray Observatory (Weisskopf et al. 2000) on twelve different occasions dating from 2008 Nov 6 to 2008 Nov 30 with a total exposure time of 300 ks. A log of the separate observations and their corresponding exposures is shown in Table 1. The Chandra observations were performed with the High Energy Transmission Grating Spectrometer (HETGS; Markert et al. 1994; Canizares et al. 2005) in the focal plane of the Advanced CCD Imaging Spectrometer (ACIS; Garmire et al. 2003) which consists of two separate gratings: the Medium Energy Grating (MEG; 0.4–8.0 keV) and the High Energy Grating (HEG; 0.7–10.0 keV). The Chandra HETG data were reduced using version 4.1 of both the Chandra Interactive Analysis of Observations software package (ciao111http://cxc.harvard.edu/ciao; Fruscione et al. 2006) and corresponding Calibration Database (CALDB).
2.1.1 HETG Reduction
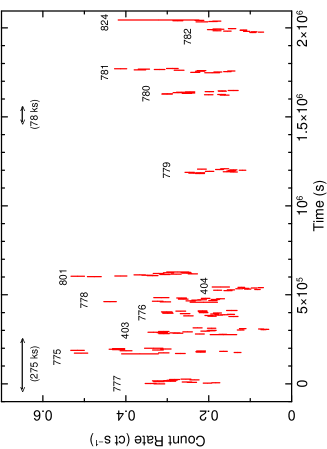
First order MEG and HEG spectra were extracted for the source and background for each individual observation. Spectral redistribution matrix (RMF) files were created using the mkgrmf script for each first order grating arm (-1 and +1) for the MEG and HEG. Telescope effective area files were also created using the fullgarf script incorporating the ciao tool mkgarf. Events files were extracted from the negative and positive first order grating arms of the MEG and HEG allowing light curves and spectra to be extracted. The first order spectra were then combined for each individual exposure using combined response files (with appropriate weighting) for the MEG and HEG. The background was not subtracted however as it has a negligible effect in the energy ranges of interest here. The total count rates in the first-order energy spectra (0.5–10.0 keV) are and ct s-1 for the MEG and HEG respectively (or and ct s-1 for the respective 0.5–5.0 and 1.0–8.0 keV energy bands for the MEG and HEG which we adopt here). These count rates correspond to fluxes of and erg cm-2 s-1 (see Table 2) and luminosities of and erg s-1 for the respective 0.5–5.0 and 1.0–8.0 keV energy bands for the MEG and HEG. A lightcurve showing the twelve individual observations with 2 ks binning over the 1.0–6.0 keV range (including both the MEG and HEG) is shown in Figure 1.
2.2 Suzaku Analysis
NGC 4051 was observed with Suzaku in November 2005 and again in November 2008 with net exposures of 120 and 350 ks respectively222Note that the 2008 Suzaku observation was split into two separate observations due to scheduling constraints with respective exposure times of 275 and 78 ks. (see Table 1 for an observation log). The 2005 data have been described previously by Terashima et al. (2009). Here we discuss data taken with the Suzaku XIS (X-ray Imaging Spectrometer; Koyama et al. 2007), consisting of four X-ray telescopes (Mitsuda et al. 2007) each with a CCD in the focal plane, and the PIN diodes of the non-imaging HXD (Hard X-ray Detector; Takahashi et al. 2007). Note that NGC 4051 is too faint to be detected with the HXD GSO instrument. Events files from versions 1.2 and 2.2.11.22 of the Suzaku pipeline processing were used for the 2005 and 2008 observations respectively. All data were reduced using HEAsoft version 6.4.1.
2.2.1 XIS Reduction
A full description of the Suzaku XIS data reduction procedure can be found in Turner et al. (2010) since the same base files are used here. The count rates corresponding to the 2005 Nov 10, 2008 Nov 6 and 2008 Nov 23 observations respectively over the 0.5–10.0 keV energy range were found to be 0.45, 2.07 and 1.42 ct s-1 per front-illuminated XIS with the background rates corresponding to 2.4 per cent, 0.9 per cent and 0.9 per cent of the respective source count rates. These count rates correspond to fluxes of , and erg cm-2 s-1 and luminosites of , and erg s-1 for the three respective observations. The three front-illuminated XIS chips (XIS 0, 2, 3; hereafter XIS–FI) were used in the spectral analysis of the 2005 data due to their greater sensitivity at Fe K. However, as the use of XIS 2 was discontinued after a charge leak was discovered in 2006, the spectral analysis from the 2008 data refers only to XIS 0 and 3. The XIS 1 (back-illuminated) data were checked for consistency but not used during the spectral fitting due to the detector’s reduced sensitivity compared to XIS–FI at Fe K. As the chips were found to produce consistent spectra within the statistical errors in all observations, the XIS–FI spectra and responses were combined to maximise signal to noise. The XIS source spectra were binned at the half-width at half-maximum (HWHM) resolution of the detector due to the high photon statistics. This enabled the use of minimisation in all Suzaku fits as there were >50 counts per resolution bin.
2.2.2 HXD Reduction
Likewise, the Suzaku HXD data reduction procedure can also be found in Turner et al. (2010). As NGC 4051 is too faint to be detected by the HXD GSO instrument, we use data taken with the HXD PIN only which provides useful data over the 15.0–70.0 keV energy range. Our net exposure times of the PIN source spectra were found to be 112, 204 and 59 ks for the 2005 Nov 10, 2008 Nov 6 and 2008 Nov 23 observations respectively. Note that the HXD PIN response file dated 2008/01/29 (epoch 1) for the HXD nominal pointing position was used for the 2005 observation whereas the response file dated 2008/07/16 (epoch 5) for the XIS nominal pointing position was used for the the 2008 observations. For the three respective observations, the net PIN source count rates are , and ct s-1 over the 15–50 keV range. These count rates in turn correspond to fluxes of , and erg cm-2 s-1 for the three respective observations. The mean net count rates and fluxes are summarised in Table 2.
| Mission | Sequence Number | Observation Date | Exposure (ks) |
|---|---|---|---|
| (Start Date) | |||
| Suzaku | 700004010 | 2005-11-10 | 120 |
| Suzaku | 703023010 | 2008-11-06 | 275 |
| Chandra | 10777 | 2008-11-06 | 27.8 |
| Chandra | 10775 | 2008-11-08 | 30.9 |
| Chandra | 10403 | 2008-11-09 | 38.2 |
| Chandra | 10778 | 2008-11-11 | 34.1 |
| Chandra | 10776 | 2008-11-11 | 25.2 |
| Chandra | 10404 | 2008-11-12 | 20.1 |
| Chandra | 10801 | 2008-11-13 | 26.1 |
| Chandra | 10779 | 2008-11-20 | 27.8 |
| Suzaku | 703023020 | 2008-11-23 | 78 |
| Chandra | 10780 | 2008-11-25 | 26.4 |
| Chandra | 10781 | 2008-11-26 | 24.1 |
| Chandra | 10782 | 2008-11-29 | 23.7 |
| Chandra | 10824 | 2008-11-30 | 9.2 |
| Mission | Instrument | Observation Date | Count Rate | Flux |
|---|---|---|---|---|
| (ct s-1) | ( erg cm-2 s-1) | |||
| Suzaku | XIS | 2005-11-10 | 0.45 | 1.32 |
| HXD | 0.04 | 1.73 | ||
| Suzaku | XIS | 2008-11-06 | 2.07 | 5.03 |
| HXD | 0.07 | 3.06 | ||
| Chandra | MEG | 2008-11-06 | 0.58 | 3.99 |
| HEG | 0.23 | 3.29 | ||
| Suzaku | XIS | 2008-11-23 | 1.42 | 3.53 |
| HXD | 0.05 | 2.66 |
3 Spectral Analysis
For all spectral analysis we used the xspec v11.3 software package (Arnaud 1996). All our fits include Galactic absorption with a column density cm-2, obtained using the ftool nh with the compilations of Dickey & Lockman (1990). We also used the cross-sections for X-ray absorption by the interstellar medium obtained by Morrison & McCammon (1983) by using wabs in xspec. Abundances are those of Anders & Grevesse (1989) unless otherwise stated. Due to the low number of counts per channel (i.e. <50 counts per resolution bin) in the HETG data, we could not use minimisation; instead, we checked our fit statistics in the Chandra spectra using the -statistic (Cash 1979). However, due to the higher photon statistics in the Suzaku spectra, all goodness-of-fit values were checked using minimisation. Note that all errors quoted correspond to 90 per cent confidence for one interesting parameter () unless stated otherwise. Where or values are quoted in tables, these values have been determined by removing the component from the final model and re-fitting. All fit parameters are given in the rest frame of the host galaxy having been corrected for the cosmological redshift () and assuming a distance of 15.2 Mpc to NGC 4051 (Russell 2004) obtained from the Tully-Fisher relation for nearby galaxies (Tully & Fisher 1977).
4 The Chandra HETG Spectrum At Low Energies
We initially considered the twelve separate HETG observations (see Table 1) and found that the flux appears to vary by a factor of 2 over the course of this 24-day period. The short-term variability appears to be consistent with bright narrow-line Type 1 Seyfert Galaxies in that the X-ray continuum softens as the flux increases (e.g. Lamer et al. 2003; Taylor, Uttley & McHardy 2003). However, we find that the low signal-to-noise ratio due to these short individual exposures is insufficient to significantly determine the parameters of the warm absorber and detect individual absorption lines so we begin by considering the entire 300 ks time-averaged HETG spectrum. We initially binned the MEG and HEG data to a constant resolution of Å and Å respectively and in all subsequent fits we consider the MEG and HEG over the respective 0.5–5.0 keV and 1.0–8.0 keV energy bands.
4.1 Continuum
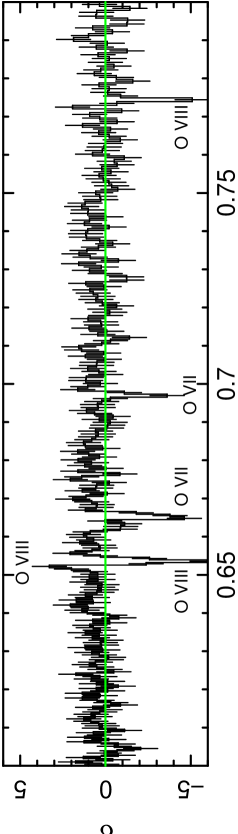
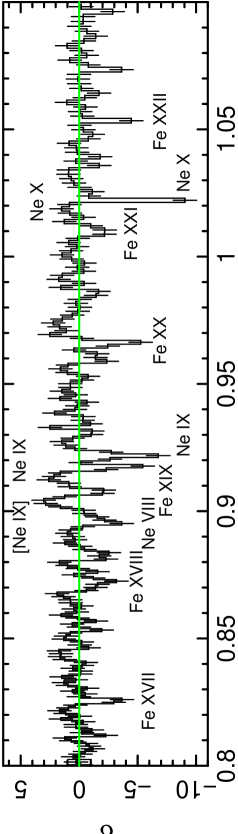
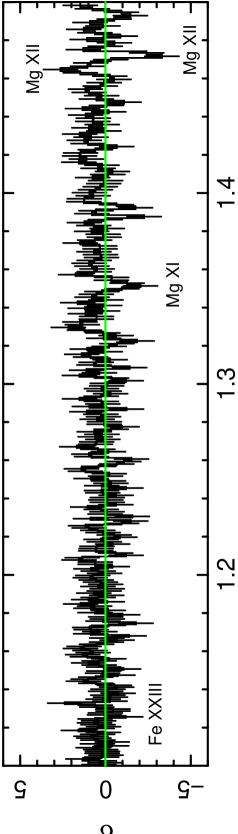
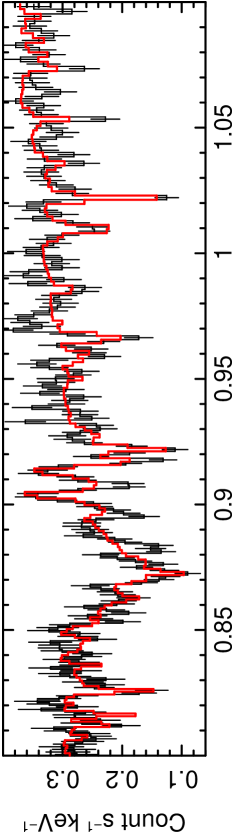
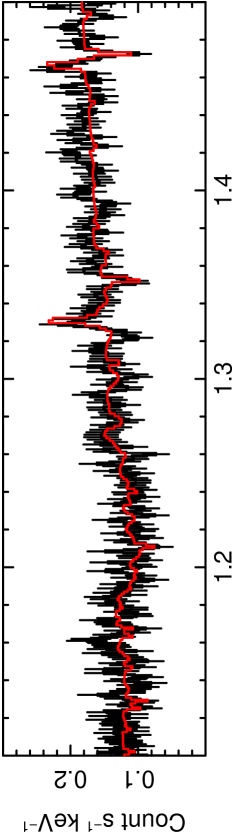
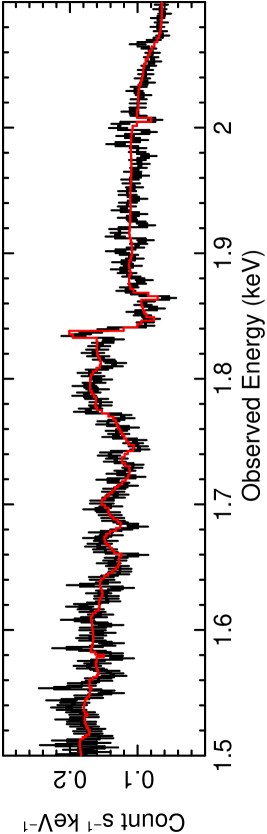
We initially fitted a simple parameterisation of the continuum using the MEG and HEG in order to allow the warm absorber to be studied in detail. The continuum emission was fitted over the 0.5–8.0 keV range with an absorbed power-law with a Galactic column density cm-2 (Dickey & Lockman 1990) and a photon index . This gave a poor fit to the data with . The fluxed HETG spectrum unfolded against a power-law with is shown in Figure 2 where significant emission can be observed >6 keV due to the Fe K emission complex and positive spectral curvature can also be seen below 1 keV indicating that an additional steepening of the spectrum is required in this source. We parameterised this with the addition of a simple featureless black body ( keV) which improved the fit by . The purpose of the black body component was not to model the data in a physical sense but to simply parameterise the soft excess with a smooth continuum, therefore allowing the individual lines from the warm absorber to be studied in detail. This yields a decent fit to the low-energy continuum and as we see no evidence for any emission / absorption features >2 keV (apart from at Fe K), we excluded the MEG and HEG data >2 keV and proceeded to analyse and identify the soft ionised absorption lines in the 0.5–2.0 keV band. A plot of the residuals <2 keV is shown in Figure 3 revealing a number of absorption and emission lines.


4.2 Absorption Lines
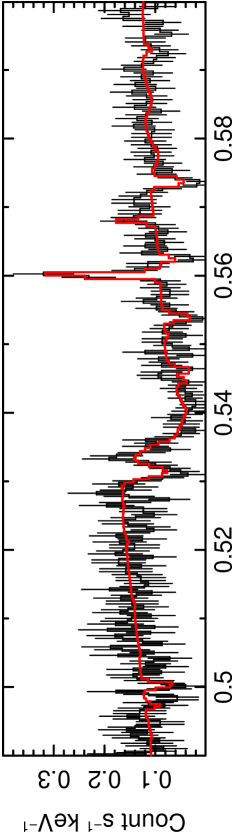
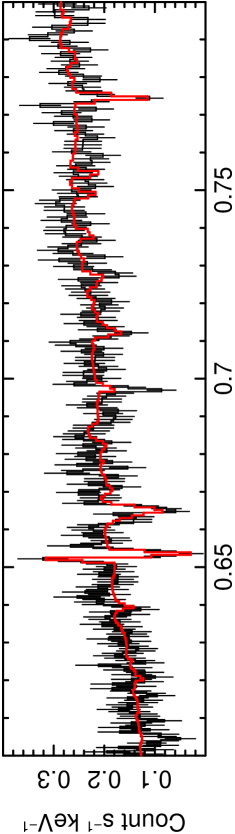
The time-averaged 300 ks spectrum reveals 21 significant (>99.9 per cent) soft X-ray absorption lines below 2.0 keV originating from material with a range of ionisation states and column densities. Several of the lines appear to be somewhat resolved in the HETG spectrum (e.g. O vii –, O viii –, Fe xviii –) with FWHM on the order of a few hundred to 1 000 km s-1. Indeed we find a mean value for the FWHM of km s-1 with a dispersion of km s-1 for the 13 absorption lines which appear to be resolved in the spectrum. The spectrum reveals absorption primarily from H-like and He-like ions of oxygen, neon, magnesium and silicon along with lines from less-ionised ions such as O vi. We also detect several L-shell transitions of Fe xvii-Fe xxii. After taking into account the systemic redshift of NGC 4051, we note that the observed centroid energies of the absorption lines are all blueshifted on the order of a couple of eV. This blueshift implies that the absorbing material in our line-of-sight is outflowing with calculated velocity shifts on the order of a few hundred to 1 000 km s-1 (e.g. the O vii, O viii – lines) relative to the host galaxy. A mean value for the outflow velocity of km s-1 with a dispersion of km s-1 is calculated for the 20 absorption lines that we are able to identify. We determined the parameters of the lines by modelling them with simple Gaussian profiles. These parameters and their likely identifications are summarised in Table A1. All lines were detected at the >99.9 per cent significance level for two interesting parameters (i.e. ).
4.3 Emission Lines
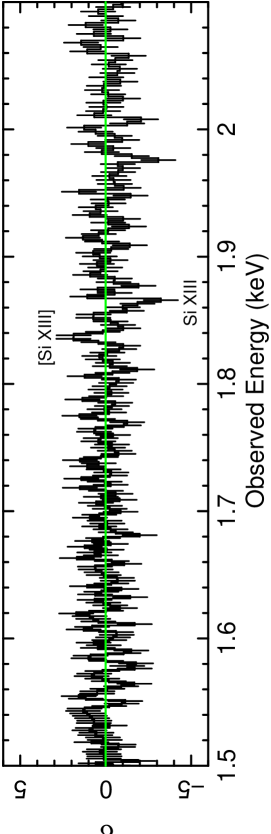
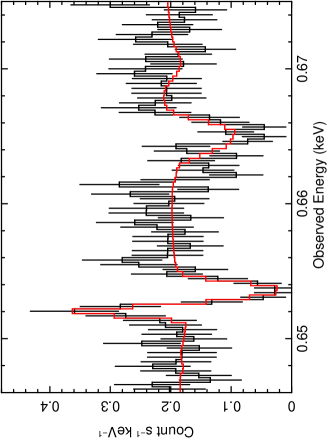
In addition to a wealth of absorption features, the HETG spectrum also reveals 7 narrow emission lines which were again initially modelled with simple symmetric Gaussians. Their identifications appear to be largely consistent with the narrow emission lines found in the XMM-Newton RGS spectrum of NGC 4051 by Pounds et al. (2004a) and also with those detected by Terashima et al. (2009). These lines appear to primarily originate from He-like ions of oxygen, neon and silicon due to their associated forbidden transitions. The Ne ix intercombination lines are also identified at 915 eV333Interestingly, the forbidden and intercombination lines from Ne ix appear to have similar strengths; this could be due to the presence of the Ne viii – absorption line at 895 eV reducing the observed flux of the Ne ix forbidden transition, thus making it appear to be weaker than it really is.. Furthermore, Ly transitions from H-like species of oxygen and magnesium are also observed at 653 eV and 1 472 eV respectively. We note that the O viii Ly emission that we observe here appears to be narrow (FWHM <400 km s-1; see Figure 4) and that we do not require an additional relativistically broadened Ly feature such as the one claimed by Ogle et al. (2004). The emission lines that we detect here have a mean velocity shift, , within km s-1 of the systemic shift and appear to be unresolved except for the forbidden emission lines from Ne ix (FWHM km s-1) and Si xiii (FWHM km s-1). We do note that the Ly transitions of O viii and Mg xii appear to be redshifted on the order of a few 100 km s-1 relative to their rest frame centroid energies. This is most likely due to the P-Cygni-like profiles in which the lines appear with their corresponding absorption lines (see Figure 4). The best-fitting parameters of the emission lines are listed in Table A1. Like the absorption features, all of the emission lines were also detected at the >99.9 per cent significance level for two interesting parameters (i.e. ).
5 The Broad-band HETG Spectrum
In order to model the broad-band HETG spectrum we included the data above 2 keV in our spectral fits so that we were considering the full 0.5–8.0 keV energy range. We carried forward the model from Section 3 consisting of a simple baseline continuum, a featureless blackbody to parameterise the soft spectral steepening and symmetric Gaussians to model the soft absorption and emission features. Figure 2 shows that a significant excess can be observed in the Fe K band at energies >6 keV (see Section 5.2). However, we begin by considering a more physical parameterisation of the warm absorber.
5.1 The Warm Absorber
We removed the simple Gaussian profiles parameterising the absorption lines from our model and instead attempted to model the warm absorber using the xstar 2.1ln11 code of Kallman & Bautista (2001; also see Kallman et al. 2004), incorporating the abundances of Grevesse, Noels & Sauval (1996). The xstar code assumes thin shells of absorbing gas and self-consistently models zones of absorption parameterised by their column density, , and ionisation parameter, , which is defined as:
| (1) |
and has units erg cm s-1, where is the ionising luminosity from 1 to 1 000 Rydbergs in units erg s-1, is the gas density in cm-3 and is the radial distance in cm of the absorbing gas from the central source of X-rays. For the spectral energy distribution (SED) of the xstar models we assume a simple illuminating power law with , although this is difficult to compare with the observed SED of NGC 4051 since the UV data from the HST were acquired a year later and so are not simultaneous. We initially attempted to model the absorption lines using Solar abundances and a turbulent velocity width of km s-1, a value largely comparable to the observed velocity widths from the Gaussian line fits (see Table A1).
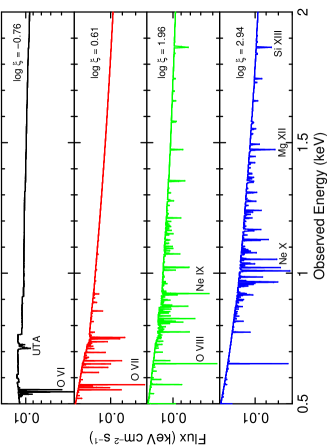
We find that we statistically require four individual zones of absorbing gas to model the data covering four distinct levels of ionisation. Each zone is significant at the >99.9 per cent confidence level. The column densities are found to be on the order of – cm-2 and the zones appear to cover a range in ionisation parameter of log to log . All the zones appear to be blueshifted implying that the material is outflowing with velocities on the order of a few 100 km s-1 with the general trend being that increases with increasing . We find that one of the zones requires two significantly different outflow velocities and so an additional zone with comparable values for the ionisation parameter and column density is included in the fit to account for this (see zones 3a and 3b in Table 3). We note that replacing zones 3a and 3b with one zone of higher turbulence velocity significantly worsens the fit. Therefore, the inclusion of the two separate zones with km s-1 and differing outflow velocities appears to be preferred by the data. Note that we subsequently refer to zones 3a and 3b as one single zone. A summary of the best-fitting values and the corresponding fit statistic () for each zone is given in Table 3.
Regarding the transitions modelled by each xstar zone, we find that the first zone (ultra-low ionisation) is mainly responsible for the absorption of O vi and lower ionisation O ions. The second zone, with a slightly higher ionisation parameter, appears to model absorption primarily from O vii. An inspection of the residuals reveals that this zone under-predicts the amount of absorption at 666 eV which is likely due to the turbulence velocity of km s-1 being too low. This has the effect of saturating the O vii – line and hence underpredicting its EW. Increasing the turbulence velocity of this zone to km s-1 significantly improves the fit and better models the residuals at 666 eV (see Figure 4). However, we find that increasing the turbulence velocity of the remaining warm absorber zones to km s-1 significantly worsens the fit and that these zones are better modelled with km s-1. Zones 3a and 3b appear to adequately model the absorption from ions such as Ne ix, O viii and the various L-shell transitions from Fe xvii - xxii and finally, the highest ionisation zone appears to correspond to absorption from ions such as Ne x, Mg xi - xii and Si xiii. A plot of the warm absorber model superimposed on the data is shown in Figure 5 and a further plot showing the individual contribution of each of the four zones is shown in Figure 6. A subsequent paper (Crenshaw et al. 2010 in preparation) will discuss the results of a UV observation of NGC 4051 taken with the Cosmic Origins Spectrograph (COS) on-board the HST. The preliminary results suggest that the X-ray zones 1 and 2 detected here with Chandra may also coincide with absorption in the UV data.
We note there are no detected absorption lines associated with a fifth warm absorber zone. However, we did allow for the presence of a partially-covering zone of absorption by including an additional power-law component absorbed by a further shell of gas. We tied the photon index of the two power-law components together leaving just one of the components absorbed by an xstar zone. We note that zones 1–4 of the warm absorber and a column of Galactic hydrogen remained in the model absorbing the entire continuum. We find that this additional partial-coverer improves the fit significantly with and appears to be important in modelling additional curvature in the continuum at energies below about 5 keV. The best-fit parameters of the partial-coverer indicate that the material is partially-ionised with and has a substantial line-of-sight column density, cm-2. The addition of this component also allows the temperature of the black body component to re-adjust slightly to keV (a value consistent with Terashima et al. 2009) and the best-fitting photon index of the power-law continuum to steepen to . Indeed, without the partial-coverer, we note that the photon index of appears to be slightly too flat for this source in the high-flux state (e.g. Lamer et al. 2003; Miller et al. 2010). The normalisation ratio of the absorbed to total power-law components at 1 keV is which suggests that the partial-coverer may correspond to a line-of-sight covering fraction of 30 per cent of the nuclear X-ray source. The best-fitting parameters of the partial-coverer are also noted in Table 3.
Furthermore, replacing the black body with the reflionx reflection model of Ross & Fabian (2005) provides an equally good parameterisation of the soft excess. We find that no relativistic blurring is required and that the addition of this component allows the photon index of the power-law to steepen further with , a value consistent with that found from a quasi-simultaneous broad-band Suzaku observation in 2008 (see Section 6 where this is discussed in more detail). The reflionx component has a best-fitting value for the ionisation parameter of log and corresponds to a ratio of reflected flux to incident flux of 0.8 over the 0.5–8.0 keV energy range. However, the ionised reflector is unable to account for some of the soft X-ray emission lines, particularly the forbidden transitions from O vii, Ne ix and Si xiii which indicates that these lines could have an alternative origin. There have been previous claims in the literature of detections of RRC associated with H-like and He-like ions of C, N, O and Ne (e.g. Ogle et al. 2004; Pounds et al. 2004a) using the RGS on-board XMM-Newton which suggests that the soft X-ray emission lines could instead be the signature of a photo-ionised plasma. Indeed it has been somewhat well established that such soft X-ray lines are commonly formed either in the narrow-line region (NLR) or as part of the photo-ionised outflow (e.g. Bianchi, Guainazzi & Chiaberge 2006).
| Absorption | Model | Value | |
| Component | Parameter | ||
| Zone 1a | (cm-2) | 149 | |
| log | |||
| (km s-1) | |||
| Zone 2a | (cm-2) | 56 | |
| log | |||
| (km s-1) | |||
| Zone 3aa | (cm-2) | 106 | |
| log | |||
| (km s-1) | |||
| Zone 3ba | (cm-2) | 143 | |
| log | |||
| (km s-1) | |||
| Zone 4a | (cm-2) | 127 | |
| log | |||
| (km s-1) | |||
| Partial-Covererb | (cm-2) | 286 | |
| log | |||
| 30% |
5.1.1 Comparison with Recent RGS Data
The warm absorber in NGC 4051 was also recently studied by Pounds & Vaughan (2010) through XMM-Newton RGS observations in May–June 2009. The data revealed significant absorption features primarily from H-like and He-like ions of C, N, O, Ne, Mg, Si, Ar and Fe. When modelled with xstar, the RGS data appear to require five separate line-of-sight outflow velocity components ranging in velocity from km s-1 to km s-1. With our HETG data, we are able to confirm here the presence of the lowest velocity zone (on the order of a few hundred km s-1) and also the third zone ( km s-1) which can clearly be seen at Fe K with the Suzaku XIS (see Section 6.3 for more details). However, we find no requirement for the highest velocity zone at Fe K ( km s-1; Section 6.3); nor do we find any evidence for the second and fourth intermediate zones claimed by Pounds & Vaughan (2010) which have velocities on the order of km s-1 and km s-1 respectively.
Pounds & Vaughan (2010) report that the O vii – resonance transition appears to be detected with three separate velocity components ( km s-1; km s-1; km s-1). However, we are only able to confirm the lowest velocity component with the HETG for this transition (see Figure 7; top panel). Pounds & Vaughan (2010) also report four separate velocity components for the O viii Ly absorption line. However, we are again only able to confidently confirm the lowest velocity component in the HETG data (see Figure 7; lower panel). Interestingly, we do observe additional residuals at 666 eV in the HETG spectrum which could potentially be the signature of a higher velocity component of the O viii Ly transition with km s-1 (Figure 7; lower panel), consistent with the value of km s-1 found in the RGS spectrum (we note that we can confirm this velocity component at Fe K with the Suzaku XIS; see Section 6.3). However, as this residual feature coincides with the expected energy of the – transition from O vii, we may also be able to account for this with a slightly higher turbulence velocity ( km s-1) in our xstar model (as mentioned in Section 5.1) so its interpretation remains open. We also note that we find no requirement at all here for the further two velocity components associated with the O viii transition at km s-1 and km s-1 in the RGS data.


Furthermore, Pounds & Vaughan (2010) also report that the Ne x and Mg xii Ly absorption lines are blueshifted on the order of km s-1 in the RGS data whereas we only find evidence for these components with km s-1 with the Chandra HETG. Therefore, we are only able to confirm two of the five velocity components associated with the XMM-Newton data, although we cannot rule out the possibility that the absorber may have significantly varied between observations.
5.2 The Fe K Complex
A ratio plot of the residuals to the absorbed baseline HETG continuum from 5.5–7.5 keV is shown in Figure 8. Line emission is clearly present suggestive of a significant Fe K complex. The most prominent line appears to be the Fe K fluorescence line from near-neutral material at keV. Modelling this with a Gaussian reveals that this line has an intrinsic width of keV (FWHM km s-1) and an associated equivalent width of eV. The addition of this line significantly improved the fit by . However, the fit was improved further by incorporating an additional unresolved narrow component ( eV) centered at 6.40 keV to model any Fe K emission from distant material. This component has an equivalent width of eV and resulted in an improvement to the fit statistic of . Upon the addition of this component, the parameters of the underlying broader K component adjusted slightly to compensate but were still consistent within the errors (see Table 4 for the final best-fitting values). We did also test for the presence of a Compton shoulder by including an additional Gaussian centred around 6.3 keV. This feature is statistically unrequired by the data and an upper limit on the equivalent width is found to be eV. Including this component did not result in any changes to the parameters of the broad and narrow Fe K components at 6.4 keV. So although the near-neutral Fe K emission appeared to then be well modelled, further residuals were still present indicating additional K-shell emission from ionised Fe.
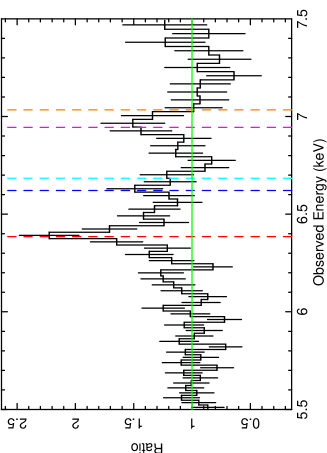
We adopted additional Gaussians to model the remaining emission. A line at keV is required by the data with an intrinsic width of eV (FWHM km s-1) and an associated equivalent width of eV. This line is most likely due to the – doublet from hydrogen-like iron (Fe xxvi) and corresponds to an improvement in the fit statistic of . A third component with a centroid energy of keV is also required by the data. This line has an intrinsic width of eV (FWHM km s-1) and corresponds to an equivalent width of eV. This line improves the fit statistic by (i.e. only 95 per cent significant) and is most likely associated with being the forbidden transition of the helium-like iron (Fe xxv) triplet at 6.636 keV, suggesting that this emission line may be consistent with an origin in photo-ionised gas (Bautista & Kallman 2000; Porquet & Dubau 2000). No further emission or absorption features were observed around the Fe K complex in the HETG data and the best-fitting values of the emission lines are shown in Table 4. The overall fit statistic corresponds to .
| Line ID | FWHM | EW | ||||
|---|---|---|---|---|---|---|
| (keV) | (eV) | (km s-1) | ( photon cm-2 s-1) | (eV) | ||
| Fe K | 36 | |||||
| Fe K | 0fixed | 1 000 | 25 | |||
| Fe xxv – | 6 | |||||
| Fe xxvi – | 15 |
With the parameterisation of the baseline continuum, the warm absorber and the Fe K components complete, we consider this to be our final best-fitting model to the time-averaged Chandra HETG data. We then proceed to apply this model to the 2008 contemporaneous Suzaku data.
6 Suzaku Spectral Analysis
We begin by considering the time-averaged 2008 Suzaku spectrum. In all subsequent fits, we use data taken in the 0.6–10.0 and 15.0–50.0 keV energy bands for the XIS and HXD respectively. The cross-normalisation between the HXD PIN and the XIS detectors was accounted for by the addition of a fixed constant component at a value of 1.18 for the HXD nominal pointing position (2005 observation) and 1.16 for the XIS nominal pointing position (2008 observations); values derived using Suzaku observations of the Crab (Ishida, Suzuki & Someya 2007444ftp://legacy.gsfc.nasa.gov/suzaku/doc/xrt/suzakumemo-2007-11.pdf). We also ignored all data from 1.7–2.0 keV so as to avoid any contamination from the absorption edge due to silicon in the detectors. Since the XIS data were binned up at the HWHM of the resolution of the detector, we included a 2 per cent systematic error in all fits to account for the high statistical weight of the bins at low energies.
6.1 The Broad-Band Suzaku Model
We firstly applied the best-fitting HETG continuum model (from Section 5) consisting of a power-law continuum, a partial-coverer, the fully-covering warm absorber (zones 1–4), Fe K emission lines and a black body to parameterise the soft excess to the time-averaged 2008 broad-band Suzaku data from 0.6–50.0 keV when the source was observed to be in a period of high flux ( erg cm-2 s-1). A historical lightcurve of NGC 4051 in the X-ray band is shown in Figure 9 where it can be seen that the 2008 observations were made during a period of relatively high flux for this source. Since the 2008 data were obtained in two separate observations due to scheduling constraints, we initially only considered the much longer 275 ks exposure. We included all of the soft X-ray, fully covering absorption zones required by the HETG data (including the soft emission lines) and fixed the parameters at the best-fitting values listed in Table 3 since the 2008 Chandra and Suzaku data were quasi-simultaneous. This resulted in a very poor fit with . Allowing the model to renormalise slightly improved the fit but still returned a poor fit statistic of with the main contribution to the residuals arising from the significant hard excess seen at energies >10 keV. This hard excess can be seen in Figure 13 (see Section 6.5) where broad-band Suzaku spectrum is shown (in red) unfolded against a power-law with .
6.2 The Suzaku Fe K Profile
In order to accurately analyse the Suzaku Fe K profile, it was therefore important to firstly parameterise the broad-band continuum emission using both the XIS and HXD data. To do this, we modelled the hard excess by including the pexrav model (Magdziarz & Zdziarski 1995); an additive component incorporating the reflected continuum from a neutral slab. We tied the photon index and the normalisation of the unabsorbed power-law continuum to that of the power-law component incident upon the reflector and fixed the elemental abundances to Solar (Anders & Grevesse 1989). We fixed the cosine of the inclination angle of the source to 0.87 (corresponding to 30∘) and tied the folding energy to the cutoff energy of the power-law at 300 keV, consistent with no cut-off in the HXD PIN band. We found that the combination of the pexrav and blackbody models (to account for the hard and soft excess respectively) with the partial-coverer from the HETG model (to account for the additional spectral curvature) was able to smoothly paramaterise the broad-band continuum well.
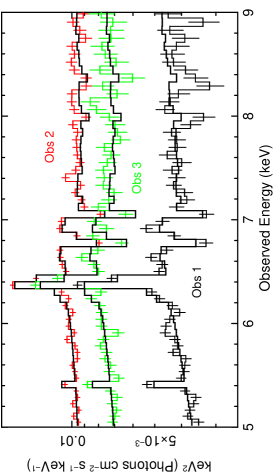
We then began to parameterise the Fe K profile by modelling the most prominent emission line corresponding to K emission from near-neutral iron with a Gaussian. This emission line is found to have a centroid energy of keV in the Suzaku data and an intrinsic width of eV (FWHM <5 700 km s-1). It also has an associated equivalent width of eV against the observed continuum. The inclusion of this component improves the fit statistic by . The fit was further improved () by including a second line to model the forbidden transition from Fe xxv found in Section 5.2 which appears to be manifested in the slight blue wing of the Fe K line shown in Figure 10. The line width was fixed at eV (intrinsically narrow) and although the centroid energy was difficult to constrain, it was found to have a best-fitting value of keV. The best-fitting values of the line flux and associated equivalent width ( photons cm-2 s-1 and eV respectively) are also largely consistent with the corresponding values found in the Chandra HETG data.
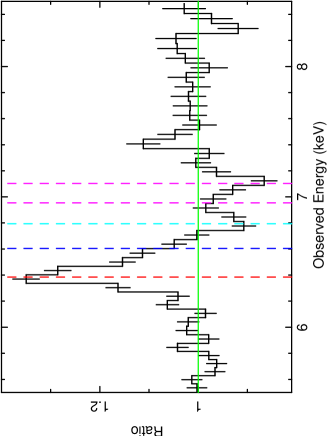
We also included a third line to model the emission from the Fe xxvi – Ly transition. Including an additional line fixed at the best-fitting value found in the HETG data of keV with an intrinsically narrow width of eV (see Section 5.2 and Table 4) is marginally required by the data () and corresponds to an equivalent width of eV against the observed continuum. This line appears to be less significant in the Suzaku XIS data than in the Chandra HETG data possibly due to the strength of two significant absorption lines with blueshifted centroid energies of 6.8 keV and 7.1 keV (in the observed frame) possibly masking some of the emission from the – transition of H-like Fe in the XIS data (see Section 6.3). We also note that a slight positive residual can be observed at 7.5 keV (see Figure 10) which is likely due to K fluorescence from near-neutral Ni which has rest-frame centroid energy of 7.47 keV. However, modelling this feature with a Gaussian is statistically unrequired by the data.
Finally, although no neutral Fe K emission was statistically required by the data (), we modelled it for consistency with the addition of a further Gaussian. We fixed the line energy at 7.06 keV, tied the intrinsic width to that of the corresponding Fe K line and fixed the line flux at 13 per cent of the K flux, consistent with the theoretical flux ratio for near-neutral iron (Kaastra & Mewe 1993). This line is unrequired by the data but for consistency we keep the line modelled in all subsequent fits.
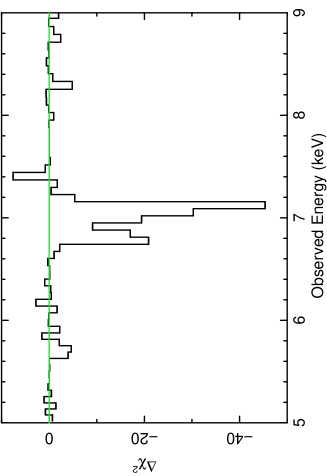
6.3 Highly Ionised Absorption
Upon modelling the Fe K emission it can be observed that significant negative residuals are apparent in the data at energies 7 keV suggestive of the presence of highly ionised absorption lines. At a first glance, the inferred blueshift of these lines could suggest that these lines are the absorption signature of a high velocity outflow, such as that detected by Pounds et al. (2004a). A plot of the ratio of the data-to-model residuals in the 2008 Suzaku XIS data is shown in Figure 10. We initially parameterised these absorption lines with Gaussians with negative fluxes. The first line is found to have a centroid energy of keV, improving the fit by (also see Figure 11). Its intrinsic width was fixed at a value of eV. This absorption line has an associated equivalent width of eV and is most likely due to absorption from the Fe xxv resonance line at 6.70 keV. If so, the blueshift of the line would suggest that the absorbing material is outflowing with a velocity of km s-1 relative to the host galaxy, consistent with the value found by Terashima et al. (2009) and Pounds & Vaughan (2010). The second line appears to correspond to a centroid energy of keV with a corresponding equivalent width of eV. The addition of this line greatly improves the fit statistic by (also see Figure 11). Again the intrinsic width of the line was fixed at eV. If this line is associated with the – Ly doublet from Fe xxvi at 6.97 keV then it would correspond to an outflow velocity of km s-1 again consistent with the findings of Pounds et al. (2004a) and Terashima et al. (2009).
After parameterising the absorption lines with simple Gaussians, we attempted to self-consistently model the lines with the addition of a photo-ionised grid of absorbing gas using the xstar code of Kallman & Bautista (2001). We adopted a turbulence velocity of km s-1 so as not to saturate the absorption lines and to explain their high observed equivalent widths. We find that the addition of this zone of gas improves the fit by and requires a best-fitting column density of cm-2 and a best-fitting value for the ionisation parameter of log . The blueshift of the zone corresponds to an outflow velocity of km s-1 (), consistent with the values found by Pounds et al. (2004a) and Terashima et al. (2009) for the highly ionised outflow. We note that no further zones of absorption are statistically required by the data to model the absorption at Fe K and that we do not see any evidence of the higher velocity ( km s-1) component reported by Pounds & Vaughan (2010) (see Figure 12). Indeed, by fixing two additional Gaussians centred on energies of 7.5 and 7.7 keV (corresponding to the observed energies reported by Pounds & Vaughan 2010), we note that these are unrequired by the data and have upper limits on their equivalent widths of eV and eV respectively.
Upon modelling the Fe K emission and the highly ionised absorption, the reflection scaling factor of the pexrav component was found to have a best-fitting value of .
We note that a sub-Solar Fe abundance appears to be preferred by the data with the value dropping to times Solar. However, this could simply be due to the limitations of fitting the spectrum with a simple neutral slab. We also note that the ratio of the normalisations of the absorbed to total power-law components at 1 keV (0.3) appears to be consistent with the best-fitting values obtained from the HETG spectrum (i.e. still suggestive of a 30 per cent covering fraction for the partial-covering zone; also see Section 5.1). The final best-fitting parameters of the broad-band model to the Suzaku XIS/HXD data are shown in Table 5. The overall fit statistic corresponds to .
Finally, as a consistency check, we returned to the HETG data to test for the presence of the two highly ionised absorption lines which we detect with Suzaku. Taking the best-fitting HETG model from Section 5, we added two Gaussian profiles with negative fluxes fixing the centroid energies at keV and keV respectively and the intrinsic width of the two lines at eV, consistent with the Suzaku data. Neither of the two lines were statistically required by the HETG data but we find upper limits on the magnitudes of the equivalent widths of eV and eV for the two respective lines, indicating that they are consistent with the values that we find with Suzaku.
| Component | Parameter | Value | |
|---|---|---|---|
| Power-lawa | |||
| Norm. (ph cm-2 s-1) | |||
| Power-law | |||
| Norm. (ph cm-2 s-1) | |||
| pexravc | |||
| Blackbodyd | (keV) | ||
| Norm. () | |||
| Fe K | (keV) | 228 | |
| (eV) | |||
| (ph cm-2 s-1) | |||
| EW (eV) | |||
| Fe xxve | (keV) | 12 | |
| (eV) | |||
| (ph cm-2 s-1) | |||
| EW (eV) | |||
| Fe xxvie | (keV) | 5 | |
| (eV) | |||
| (ph cm-2 s-1) | |||
| EW (eV) | |||
| Fe xxv | (keV) | 26 | |
| (eV) | |||
| (ph cm-2 s-1) | |||
| EW (eV) | |||
| Fe xxvi | (keV) | 56 | |
| (eV) | |||
| (ph cm-2 s-1) | |||
| EW (eV) | |||
| High abs.f | (cm-2) | 113 | |
| log | |||
| (km s-1) |
6.4 Absorbed Reflection Model
Since the pexrav and blackbody components served as simple parameterisations of the Compton-scattered reflection hump off neutral material at energies >10 keV and the soft excess at energies <2 keV respectively, we attempted to model these features using a more physical approach. We began by removing the pexrav component, the blackbody and the three Gaussians at 6.41, 6.62 and 6.97 keV (modelling emission from near-neutral Fe K, Fe xxv and Fe xxvi respectively). We then replaced these components with two absorbed reflection models (consistent with the full broad-band model described in Turner et al. (2010)) using the reflionx code of Ross & Fabian (2005); one low (near-neutral) component to model the near-neutral Fe K emission line and the hard excess and one highly ionised component to account for the spectral curvature in the soft band (i.e. the soft excess) plus the highly ionised Fe emission lines. The reflionx code models the emergent spectrum from a photo-ionised optically-thick slab of gas when irradiated by a power-law spectrum and consists of both the reflected continuum and line emission for the astrophysically abundant elements. It assumes a high-energy exponential cut-off of keV and uses the abundances of Anders & Ebihara (1982). All absorption was again modelled using the xstar 2.1ln11 code of Kallman & Bautista (2001) with the soft X-ray absorption fixed at the best-fitting values from the HETG data (Table 3) and the zone of highly ionised absorption detected with Suzaku consistent with the values obtained in Section 6.3. Any soft X-ray emission lines unable to be accounted for by the ionised reflector were modelled with Gaussians as required. This model can be expressed as:
| (2) | |||||
where wabs is the absorption due to Galactic hydrogen in our line-of-sight, xstarHETG corresponds to the four fully-covering soft X-ray absorption zones fixed at the best-fitting values from the HETG data (see Table 3), xstar is the zone of highly ionised absorption (see Section 6.3), PLint. is the intrinsic (“unabsorbed”) power-law continuum, PL xstarpc corresponds to the partial-coverer, the reflionx components are the near-neutral and highly ionised absorbed reflectors (each of which is absorbed by a layer of gas within xstar, without which the soft excess cannot be modelled; see below) and GA corresponds to the soft emission lines which the reflector is unable to account for (also see Section 4.3); primarily the forbidden transitions from O vii, Ne ix and Si xiii. These lines were fixed at the best-fitting values from the HETG data (listed in Table A1). This forms a highly complex model since were are attempting to account for a complex ionised scattering spectrum with components that cannot neccessarily account for all of the physical effects that we expect to be present. Therefore, its apparent complexity may simply be an artefact of the limitations of the current physical models available, e.g. compared to physically realistic disc wind models (see Sim et al. 2008, 2010).
We fixed the redshift values of the two reflectors to that of the host galaxy (i.e. ), tied the iron abundances together and tied the photon indexes to that of the incident power-law continuum. No additional velocity broadening was applied to the reflected spectrum. We find that the photon index steepens to . The ionisation parameter of the low reflector pegs at a value of erg cm s-1 (the lowest value allowed by the model) whereas the highly ionised reflector modelling the soft excess requires a best-fitting value of log . We note that the highly ionised reflector is able to account for the soft excess due to its enhanced reflectivity in the soft band at high levels of ionisation although we stress that the soft excess cannot be modelled by the reflionx component alone without introducing a zone of absorption (in addition to the four warm absorbers, the partial-coverer and the Galactic absorption). The absorber in front of the reflector is responsible for producing deep bound-free edges which reduce the observed reflected flux at higher energies, thus revealing positive spectral curvature in the soft band. Such a component may be representative of scattering off a disc wind. The highly ionised reflector also removes the residuals at Fe K and well models the ionised emission lines from Fe xxv and Fe xxvi. This model appeared to leave very few residuals in the data and gave a good fit with , a significant improvement over the phenomenological model described in Section 6.3 (). The best-fitting values of the reflection components and their associated zones of absorption are shown in Table 6.
| Component | Parameter | Value |
|---|---|---|
| Power-lawa | ||
| Norm. (ph cm-2 s-1) | ||
| Power-law | ||
| Norm. (ph cm-2 s-1) | ||
| (cm-2) | ||
| log | ||
| reflionx | ||
| (erg cm s-1) | ||
| Norm. (ph cm-2 s-1) | ||
| Absorberd | (cm-2) | |
| log | ||
| reflionx | ||
| log | ||
| Norm. (ph cm-2 s-1) | ||
| Absorberd | (cm-2) | |
| log |
6.5 Long-Term Spectral Variability
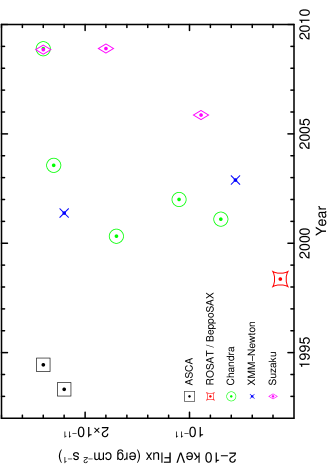
In order to assess the nature of the long-term X-ray spectral variability of NGC 4051, we attempted to simultaneously model the 2008 data with the 2005 Suzaku data over the broad-band 0.6–50.0 keV energy range. The 2005 data have previously been described in detail by Terashima et al. (2009) where NGC 4051 was found to be in the low-flux state with a 0.5–10.0 keV flux of erg cm-2 s-1 compared to the much higher flux of erg cm-2 s-1 in 2008. The spectrum was observed to be much harder in the low-flux state with a significant excess at energies >10 keV. Figure 13 shows the relative fluxes of the three observations. The large changes in spectral shape can be well described by a two-component model consisting of a soft variable component superimposed over a hard constant component (Miller et al. 2010).
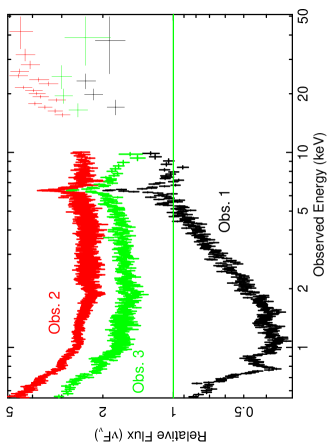
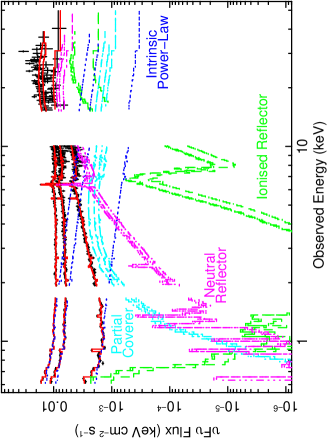
We simultaneously applied the best-fitting model described in Section 6.4 to the 2005 and 2008 XIS and HXD Suzaku data. We also included the second, shorter exposure (78 ks) observation from 2008 in our joint-analysis. We tested to see if the fully-covering warm absorber parameters varied between observations but the best-fitting values were consistent within the errors across the 2005 and 2008 data. We tied together all model parameters between the three observations except for the relative normalisations of the absorbed and intrinsic power-law components and the near-neutral and ionised reflection components (reflionx) which we allowed to vary to account for the long-term spectral variability. We find that the normalisations of the absorbed power-law and the near-neutral reflection component appear to be largely constant across the three observations (see Table A2), consistent with the findings of Miller et al. (2010). We note that slight changes in the flux of the highly ionised reflector can be observed between 2005 and 2008. However, we find that the spectral variability can ultimately be described by large changes in the normalisation of the intrinsic unabsorbed power-law component which increases by a factor of 7 from the low-flux state in 2005 to the high-flux state in 2008. This corresponds to a high covering fraction of the partial-coverer of 70 per cent in the 2005 low-flux data compared to a much lower covering fraction of 30 per cent when in the high-flux state and supports the notion of an empirical two-component model whereby the constant reflection component contributes to the majority of the hard X-ray flux whereas changes in the normalisation of the intrinsic power-law account for the variations in spectral shape at lower energies. The 0.5–100 keV fluxes corresponding to the relative normalisations of the power-law and reflection components are given in Table 7. A plot of the relative contributions of the individual model components to the joint-fit is shown in Figure 14.
We note that upon considering the joint-fit of all Suzaku observations, we also find that an additional emission line at keV is statistically required in the 2005 data, possibly attributed to Cr K. Modelling this with a Guassian profile with an intrinsically narrow fixed width of eV provides a measurement of the equivalent width of eV (consistent with Turner et al. 2010) and improves the fit statistic by . We also include this line in the 2008 data and find that the flux of the line appears to be consistent with the 2005 data with the equivalent width dropping to eV against the observed continuum as expected. This suggests that the emission line may have remained constant in flux over this three-year period. A detailed analysis of the nature of this line is given by Turner et al. (2010) with its possible origins discussed in a companion paper (Turner & Miller 2010).
This is then considered to be our final model which appears to describe the data well with all remaining free parameters across all three observations consistent with the values listed in Table 6 resulting in a final fit statistic of .
| Flux ( erg cm-2 s-1) | |||
| Component | Obs. 1 (2005) | Obs. 2 (2008) | Obs. 3 (2008) |
| Power-law | |||
| Power-lawabs. | |||
| reflionxneutral | |||
| reflionxionised | |||
| Fe K | |||
| 70% | 30% | 40% | |
| Ratio | |||
| Component | Obs. 1 (2005) | Obs. 2 (2008) | Obs. 3 (2008) |
| Power-law | 1 | ||
| Power-lawabs. | 1 | ||
| reflionxneutral | 1 | ||
| reflionxionised | 1 | ||
| Fe K | 1 | ||
7 Discussion
7.1 Highly Ionised Outflow
The Suzaku XIS spectrum of NGC 4051 reveals two absorption lines with centroid energies at 6.8 and 7.1 keV, as described in Section 6.3. This suggests that the absorption is significantly blueshifted and could be the signature of a highly ionised, high velocity outflow. Modelling with an xstar grid with a turbulence velocity of km s-1 requires one zone of absorption with a best-fitting column density of cm-2 and an ionisation parameter of log (as per Section 6.3). Assuming that the lines correspond to K-shell absorption of Fe xxv and Fe xxvi, the blueshift of the zone corresponds to an outflow velocity of km s-1, largely consistent with the findings of Pounds et al. (2004a) and Terashima et al. (2009). It is also conceivable that this is the highly ionised signature of the high velocity outflow detected by Steenbrugge et al. (2009) with the Chandra LETG which they deduce to have a comparable outflow velocity of km s-1 although with an ionisation parameter 10 times lower (i.e. log ).
7.1.1 The Kinematics of the Highly Ionised Absorption
For a homogeneous, radial, outflowing wind, the column density along the line of sight is given by , where and are the inner and outer radii along the line of sight through the wind respectively. Assuming we are looking down a spherically symmetric homogeneous wind towards the inner radius, then tends to . So, combining this with the definition of the ionisation parameter (equation 1) leads to . However, if the thickness of the wind is defined as then the inner radius may extend inwards if the wind is clumpy (i.e. if ). This yields:
| (3) |
A value for the ionising luminosity can be calculated by extrapolating the total power-law continuum of the broad-band Suzaku model from the 2008 data and integrating from 1 to 1 000 Rydbergs. This gives a value of erg s-1. Combining this with the best-fitting values of the column density and the ionisation parameter from the xstar model (Table 5) then yields a value for the radius of the absorbing material of cm which is of the order of 0.004 pc or 5 l-d from the central engine. Assuming that the material escapes to infinity then a lower limit on the radius can also be calculated by considering the outflowing material’s escape velocity where . Rearranging for gives a lower limit of cm placing the constraints on the radius of the highly ionised absorber to be l-d from the central source and infers a constraint on the electron density of cm-3 (equation 1). The constraints on the radius derived here appear to be consistent with the radius of 0.5–1 l-d found by Krongold et al. (2007) for their highly ionised zone of absorption found in the XMM-Newton RGS spectrum. This is well within the 10–15 l-d dust sublimation radius in NGC 4051 (see Krongold et al. 2004 fig.10) and so cannot have an origin in the molecular torus. Instead, as the location of the highly ionised absorber also appears to be contained within the location of the He ii broad emission line region (BELR; Krongold et al. 2007), an accretion disc wind is perhaps a more likely origin for this absorption signature.
By considering the case of a homogeneous, spherical flow under the assumption that the outflow velocity remains approximately constant on the compact scales observed here (although decelerating at some larger radius), an estimate on the mass outflow rate of the highly ionised zone can be calculated from the simple conservation of mass:
| (4) |
where . Here, is the mass outflow rate in units g s-1 subtending a solid angle, (where ), where is is the ionising luminosity from 1 to 1 000 Rydbergs in units erg s-1, is the ionisation parameter in units erg cm s-1, is the outflow velocity in units cm s-1 and is the rest mass of a proton. Initially assuming that the absorber is fully covering (i.e. ) and taking the best-fitting values of the ionisation parameter and outflow velocity given in Table 5 and the value for the ionising luminosity derived above yields an estimate on the mass outflow rate of M⊙ yr-1. This value then translates into an estimate of the kinetic output of the outflow via:
| (5) |
which corresponds to a value of erg s-1, which is approximately 3–4 per cent of the bolometric output of the AGN (Ogle et al. 2004). The momentum rate of the outflow is then g cm s-2.
For a momentum-driven outflow whereby (i.e. where the photons scatter once before escaping and so all momentum is transferred to the outflow) accreting at near-Eddington (i.e. ), the total wind momentum flux must be of the same order as the photon momentum flux (King 2010), i.e.:
| (6) |
Assuming a black hole mass of M⊙ (Denney et al. 2009) for NGC 4051, the Eddington luminosity is found to be erg s-1 which yields erg cm-1; a value comparable to the calculated outflow momentum rate of g cm s-2. So it can be seen that equation 6 is largely satisfied if we assume that the highly ionised outflow is momentum-driven by Thomson scattering such as in the similar case of the quasi-stellar object (QSO) PG1211+143 (King & Pounds 2003; Pounds et al. 2003).
Furthermore, the Eddington luminosity is also defined by:
| (7) |
where is the efficiency of mass-to-energy conversion and takes a value between 0 and 1. Combining this with equation 6 yields an expression for the wind velocity (King et al. 2010):
| (8) |
where is the accretion rate in Eddington units. Since here, a value of would be required to sustain the Eddington luminosity of this source if it were accreting at the Eddington rate (i.e. ). Note that the maximum value of is 0.06 for a non-rotating, Schwarzschild black hole.
The bolometric luminosity of NGC 4051 calculated by Ogle et al. (2004) and corrected for the distance of 15.2 Mpc assumed here is erg s-1. Comparing this to the Eddington luminosity suggests that this object has an accretion rate of only 30 per cent of which would correspond to an observed mass accretion rate of M⊙ yr-1 assuming an efficiency of . However, the observed luminosity of the system with respect to Eddington may be underestimated if some of the emission is obscured by a Compton-thick wind and scattered out of the line of sight (a notion perhaps supported by the apparent presence of high column densities towards this source). So it is perhaps conceivable that NGC 4051 is accreting at an appreciable fraction of the Eddington rate. Furthermore, Sim et al. (2010) show that radiatively-driven accretion disc winds can exist with similar properties to those that we observe here for sources with luminosities of a few tens of per cent of .
7.1.2 The Covering Fraction
From the consideration of mass conservation (equation 4), it can be seen that the mass outflow rate is dependent upon the covering factor, , which is likely to be some significant fraction of sr. The calculations in Section 7.1.1 were based on the assumption that the outflow is a radial flow in a spherical geometry with . However, if the outflow takes the form of a bi-conical geometry (Elvis 2000), as proposed by Krongold et al. (2007) for this source then the covering fraction may be lower.
The Chandra HETG and Suzaku XIS spectra reveal the presence of two highly ionised Fe K emission lines most likely originating from Fe xxv and Fe xxvi. If these lines are the signature of the same ions associated with the highly ionised, high velocity outflow, we can attempt to obtain an estimate on the covering fraction of the material. Bianchi & Matt (2002) calculate the predicted equivalent widths of the Fe xxv and Fe xxvi emission lines against the total (primary + reprocessed) continuum for a given photon index and column density. Figures 8 and 9 of Bianchi & Matt (2002) show that for a column density of cm-2 and a photon index of , the expected equivalent widths are 50 eV and 15 eV for the Fe xxv and Fe xxvi emission lines respectively. As the column density of the highly ionised absorption that we observe here with Suzaku is cm-2 (see Section 6.3) and the best-fitting photon index is (see Section 6.4) in the 2008 data, we can make a direct comparison. Within the errors, the equivalent widths of 25 eV and 10 eV obtained for the Fe xxv and Fe xxvi emission in the Suzaku data respectively (see Table 5) suggest that the values are on the order of 50 per cent lower than the predicted maximum values perhaps implying that the covering factor is on the order of .
Furthermore, Tombesi et al. (2010) analysed a sample of 42 radio-quiet AGN observed with XMM-Newton. They detected 22 absorption lines at rest-frame energies >7.1 keV, implying that high velocity outflows may be a common phenomenon in radio-quiet AGN. The fraction of AGN having at least one feature with a blue-shifted velocity in their sample is , corresponding to 40 per cent of the objects. They also find that the global covering fraction of the absorbers that they detect is estimated to be in the range 0.4–0.6, suggesting that the outflowing winds generally have large opening angles.
We can also obtain a rough estimate on by comparing the observed accretion rate of the source ( M⊙ yr-1; see Section 7.1.1) with the calculated spherical outflow rate from equation 4 ( M⊙ yr-1) under the assumption that the mass outflow rate either does either not exceed or is of the same order as the mass accretion rate (i.e. ). This suggests a covering fraction of although this could be higher if the observed luminosity with respect to Eddington is underestimated somewhat perhaps due to partially-covering Compton-thick clouds in our line of sight. So it seems that although the absorption component is unlikely to be fully covering, the observational evidence suggests that the outflow is not highly collimated with still likely to correspond to a significant fraction of 1 which appears to be consistent with the detailed reverberation analysis of Miller et al. (2010) who state that a global covering fraction of per cent is required to match the observations.
7.1.3 Implications for Feedback
Given the high accretion rates required for the growth of supermassive black holes, significant outflows may be a consequence of near-Eddington accretion (King 2010). If so, they could be an important factor in galaxy evolution and in establishing the observed – and – relations between the supermassive black hole and its host galaxy (Magorrian et al. 1998; Ferrarese & Merritt 2000; Gebhardt 2000).
Taking the bolometric luminosity of erg s-1 of NGC 4051, we can calculate an estimate for the mass accretion rate of M⊙ yr-1. Thus, for the black hole to accrete a mass of M⊙ (Denney et al. 2009), the Salpeter e-folding time would be yr. As calculated in Section 7.1.1, the energy output of the high velocity outflow is erg s-1 assuming that . Integrating this over the e-folding time of the AGN gives a total energy output of erg (even if we assume a conservative value of , this still provides a total output of erg). This value can then be compared with the binding energy of the bulge of the host galaxy. Marconi & Hunt (2003) and Häring & Rix (2004) provide an observable relationship between the mass of the central object and the mass of the galaxy bulge, i.e. . This can then be used to calculate the binding energy of NGC 4051 whereby . Nelson & Whittle (1995) provide a value for the velocity dispersion of NGC 4051 of km s-1 which then yields an estimate on the binding energy of erg, comparable with the likely total energy deposited by the wind (assuming that the wind persists for the lifetime of the AGN). Therefore, it can be seen that the total energy output of the high velocity outflow could have a considerable influence on its host galaxy environment. Indeed it may be conceivable that NGC 4051 is a low mass analague of the QSOs PG1211+143 (Pounds & Reeves 2009) and PDS 456 (Reeves et al. 2009) which may deposit as much as erg throughout the lifetime of the AGN.
7.2 The Soft X-ray Absorption / Emission
The HETG spectrum shows evidence for a wealth of absorption lines in the soft X-ray band. Modelling this warm absorber with xstar requires four distinct ionisation zones of gas with the ionisation parameter ranging from log to log and column densities on the order of – cm-2 (see Table 3). The zones appear to be outflowing with velocities on the order of a few 100 km s-1 with the general trend appearing to be that the larger outflow velocities appear to correspond to more highly ionised zones. This is perhaps suggestive of a geometry whereby all of the zones form part of the same extended outflowing wind with the higher velocity, more highly ionised components originating much closer to the central source. Indeed, as the mass outflow rate (equation 4) and the ionisation parameter (equation 1) combine to give:
| (9) |
(King et al. 2010), such a trend between ionisation parameter and outflow velocity would be expected to be observed if the mass outflow rate is to be conserved. Such a correlation has previously been noted in NGC 4051 by Pounds et al. (2004a) and, if confirmed, could provide strong evidence of a cooling shock (King et al. 2010).
Using equation 3, we are able to obtain upper limits for the radius of the absorbing zones of gas (see Table 8). However, these values are largely unconstrained and result in very conservative estimates on the order of kpc for the two most lowly ionised zones. The constraints on the medium and higher ionisation zones are a little tighter with the radius of the material falling within 70 and 2 pc from the central source respectively. We note that the absorbers could exist at smaller radii still if the material is somewhat clumpy or filamentary.
Calculations of the mass outflow rate of zones 1–4 using equation 4 prove to significantly exceed the Eddington accretion rate of the source by several orders of magnitude since they assume that the absorber forms part of a fully-covering, homogeneous, radial flow. However, if we assume that the mass outflow rate does not exceed the observed mass accretion rate since the energy required to accelerate the outflow must come from the infalling gas (i.e. M⊙ yr-1), we can scale the soft zones accordingly and place upper limits on the covering fraction. This results in values ranging from to for the lowest and highest ionisation zones in the HETG data respectively. The values for the lower ionisation zones are generally consistent with the opening angles of the warm absorber components detected by Steenbrugge et al. (2009) with the Chandra LETG. We also calculated upper limits for the kinetic output of the outflow using our assumption about the mass outflow rate stated above and equation 5. This resulted in values ranging from erg s-1 to erg s-1 for the five zones of absorption, i.e. very small fractions of the total bolometric output of the AGN in constrast to the high velocity outflow that we observe with Suzaku which has a kinetic output at least two orders of magnitude higher and could potentially be highly significant in terms of galactic feedback. These values are summarised in Table 8.
| Absorption | |||
|---|---|---|---|
| Component | (pc) | (erg s-1) | |
| Zone 1 | |||
| Zone 2 | |||
| Zone 3a | |||
| Zone 3b | |||
| Zone 4 | |||
| High | 0.5 |
We also detect several narrow emission features at energies <2 keV. The ionised reflector is unable to model all of the emission lines and, in particular, cannot account for the forbidden transitions from O vii, Ne ix and Si xiii. Previous studies with the RGS on-board XMM-Newton have claimed the presence of RRC (Ogle et al. 2004; Pounds et al. 2004a) associated with H-like and He-like ions of elements such as O and Ne, especially when the source is found to be in an extended period of low flux, suggesting that the soft X-ray emission lines may have a photo-ionised origin. Indeed an origin in photo-ionised gas (either formed in the NLR or in an extended photo-ionised outflow) has been claimed for soft X-ray lines in many other objects (e.g. Bianchi et al. 2006). If the emission lines detected here do indeed originate in a photo-ionised plasma, an estimate on the electron density of the O vii emission (the strongest soft X-ray emission line detected here) can be calculated using the ratio for He-like ions of Porquet & Dubau (2000), which is defined as where is the intensity of the forbidden line and and are the intensities of the intercombination lines. An upper limit on the flux of the O vii intercombination line(s) can be found by including an additional Gaussian in the HETG spectrum with the centroid energy fixed at 568.5 eV and the intrinsic width of the line tied to that of the associated forbidden transition. This component is unrequired by the data and provides an upper limit on the line flux of photons cm-2 s-1. Combining this with the flux of the O vii forbidden line of photons cm s-1 (see Table A1) provides a lower limit on the value of the ratio555One caveat to this is that densities obtained with the ratio are also dependant upon photoexcitation of the associated resonance line and optical depth effects. of . Then, by considering the relationship between the ratio and electron density for O vii shown in fig.8 of Porquet & Dubau (2000), an upper limit on the electron density for the O vii emission can be obtained which is on the order of cm-3. If the majority of O vii absorption is being modelled by zone 2 (see Table 3 and Figure 7), then by assuming that the emission has an ionisation parameter of log , equation 1 allows us to place a lower limit on the radius of this emission of cm, which is on the order of or 1.5 l-d. This radius is largely consistent with the value of l-d found by Steenbrugge et al. (2009) and the value of l-d for the lowly ionised component detected by Krongold et al. (2007).
7.3 The Nature of the Long-Term Spectral Variability
NGC 4051 is found to be highly variable on both short- (ks) and long-term (years) time-scales with the spectral trend being that the X-ray spectrum flattens above a few keV as the source flux drops. Occasionally NGC 4051 is found to fall into an extended period of low flux (e.g. Uttley et al. 1999) revealing a very hard X-ray spectrum. The general consensus is that the primary power-law disappears from view as the flux drops leaving the remaining emission dominated by a hard reflection component (e.g. Guainazzi et al. 1998; Pounds et al. 2004a). Such a low-flux state was observed in 2005 by Terashima et al. (2009) when a very strong hard excess was observed at energies >10 keV which, if modelled with neutral reflection (i.e. a pexrav component), returns a value of (where corresponds to reflection from a semi-infinite slab). This is also apparent in Table 7 where it can be seen that the 0.5–100 keV flux of the reflector is significantly higher than that of the intrinsic power-law in the 2005 data. However, the excess could not be accounted for by reflection alone due to the relatively weak Fe K emission component ( eV). Instead, Terashima et al. (2009) were able to model the broad-band spectra by introducing a partially-covered power-law component which gives rise to the hard spectral shape.
In Section 6.4, we successfully modelled the broad-band 2008 Suzaku data with a model consisting of an intrinsic power-law component, a partial-coverer, near-neutral and ionised reflection, ionised absorption from a variety of ionisation states and several soft X-ray photo-ionised emission lines. This model accounts for the spectral curvature well with the partial-coverer appearing to have a low covering fraction of 30 per cent. We then attempted to simultaneously fit all three broad-band Suzaku spectra from 2005 and 2008 using the same model (see Section 6.5). We find that the long-term spectral variability can be accounted for largely by changes in the normalisation of the intrinsic (unabsorbed) power-law. Since the absorbed power-law remains unchanged, the spectral variability cannot be accounted for by simple changes in the covering fraction of the partial-coverer alone. If this were the case, then the total flux (intrinsic + absorbed) would not vary. However, since direct changes in the covering fraction are observed between observations, the spectral variability cannot be accounted for by intrinsic changes in the luminosity of the source alone either. Therefore, either the covering fraction of the Compton-thin partial-coverer and the luminosity of the source are inversely correlated or the changes in are not intrinsic.
If the covering fraction and luminosity are inversely correlated, one possible cause of this could be that the hot corona above the disc may be varying in area. This could have the effect of concentrating the continuum emission from a smaller region, therefore increasing the proportion which is absorbed by the partial-coverer and lowering the luminosity, such as is observed in the 2005 data. Alternatively, the accretion disc itself may become truncated which could also have the effect of lowering the intrinsic luminosity and concentrating the continuum emission over a smaller area. Taking values of M⊙ yr-1, M⊙ and , from the Shakura & Sunyaev (1973) solution for a thin accretion disc, an estimate can be made on the viscous timescale at the radius of the innermost stable circular orbit for a Schwarzschild black hole (i.e. 6 ) for NGC 4051 of s (Frank, King & Raine 2002). This suggests that the disc could vary on timescales as short as a few months or years and so could be a possible cause of the long-term variations which we observe. A third possibility remains that if the intrinsic ionising luminosity increases, the absorbing clouds may become ionised and so more transparent to the continuum emission. This could result in an apparent change in the covering fraction of the absorber versus luminosity and therefore lead to the observed spectral changes between 2005 and 2008.
Alternatively, if the observed changes in are not intrinsic, then another possible reason for the observed changes in the flux of the intrinsic power law could be due to the intrinsic continuum emission disappearing from view as the covering fraction of a further Compton-thick, variable partial-coverer increases therefore resulting in an apparent drop in continuum flux. Thus, this leaves behind a constant, hard, reflection component which then dominates the spectrum at low fluxes leading to the spectral trend observed by Guainazzi et al. (1998) and Pounds et al. (2004a). If the proposed Compton-thick clouds form part of the same system as the more distant Compton-thin clouds, this could explain the correlation with the line-of-sight covering fraction of the Compton-thin partial-coverer (i.e. as of the Compton-thick clouds increases, of the Compton-thin clouds increases too). Such an interpretation of accounting for spectral variability by allowing for changes in the covering fraction of an absorbing layer of gas has also been used as a solution to several other well-studied AGN (e.g. 1H 0419-577, Pounds et al. 2004b; NGC 1365, Risaliti et al. 2007; MCG-6-30-15, Miller, Turner & Reeves 2008; NGC 3516, Turner et al. 2008). Then, if the origin of the distant, near-neutral reflector that we observe is located outside of the partial-coverer (for instance, the molecular torus), the apparent value of observed in the 2005 data could simply be due to a delay in the reflection component responding to a previous apparent brighter state since the continuum emission from the central engine may also be obscured by the Compton-thick clouds at the distance of the torus.
These results are consistent with the findings of Miller et al. (2010) who performed PCA on the three Suzaku observations of NGC 4051 from 2005 and 2008. They were able to decompose the spectra into the principle modes of variation and confirmed that a constant, hard component is present in the spectra at all times with a highly variable soft X-ray component superimposed. This was attributed to variations in the covering fraction of a layer of absorbing gas with a covering fraction of per cent obscuring the central source on long time-scales. They suggested that the strong variability on short (ks) time-scales however, is intrinsic to the source.
The flux of the narrow, unresolved Fe K component appears to remain constant between the 2005 and 2008 Suzaku observations (see Table 7) with the equivalent width of the line decreasing against the observed continuum as the flux level of the continuum increases (see Table A2). The constancy of the flux over long-term time-scales suggests that near-neutral Fe K emission does therefore not respond to apparent changes in the continuum level and is perhaps supportive of an origin in very distant material. The constant flux of the neutral Fe K emission line is also observed in the PCA of Miller et al. (2010; see figure 2) despite large apparent changes in the continuum flux.
In addition to the near-neutral Fe K emission from distant material, we also find evidence for a weak, broader component to the K emission in the HETG spectrum, as described in Section 5.2. Taking the FWHM of km s-1 (i.e. km s-1) of this broad Fe K component from the HETG data allows an estimate on the radius from the central engine of the emitting material to be calculated assuming simple Keplerian motion. This yields an estimate on the radius of where . Taking the value of M⊙ for the mass of the black hole calculated by Denney et al. (2009), this corresponds to a value of l-d from the central source. Again, this is largely consistent with the findings of Miller et al. (2010) who find evidence of a weak variable hard excess at energies >20 keV with an associated weak, moderately broadened Fe K component which appears to respond to changes in the continuum on a 20 ks time-scale. This may be related to the ionised reflector which is seen to vary somewhat in the Suzaku data (see Table 7) and may be associated with reflection occuring off the outer disc or off a disc wind similar to that calculated by Sim et al. (2010). Miller et al. (2010) also find evidence for time-lags between the hard and soft bands which are well described by reverberation from material a few light-hours away from the illuminating source. This confirms the idea that NGC 4051 has a substantial amount of optically-thick material within a few 100 from the central source and is again supportive of a partial-covering solution to account for the long-term spectral variability.
Finally, we also note that whether parameterising the broad-band Suzaku data with a pexrav or reflionx model, the data seem to prefer a sub-Solar abundance of iron with a best-fitting value of times Solar. Aside from an intrinsically sub-Solar abundance of iron in NGC 4051, one other possible interpretation could be that this is perhaps indicative of spallation (Skibo 1997); a phenomenon whereby Fe nuclei are fragmented into lighter nuclei by the impact of high energy cosmic rays, thus enhancing the abundances of lower atoms such as Cr and Mn. Indeed, in Section 6.5 we note that we detect an additional emission line at keV, whose centroid energy appears to coincide with the expected line energy of the neutral Cr K transition thus suggesting an enhanced abundance of Cr. The presence of this line is discussed in a companion paper (Turner et al. 2010) where they show that the observed line at 5.44 keV cannot be caused by a simple statistical fluctuation. Furthermore, the possible origin of this line is discussed further by Turner & Miller (2010) where they consider an origin in a transient hotspot but ultimately favour a spallation interpretation.
8 Conclusions
Through a detailed analysis of the X-ray spectrum of NGC 4051 with the Chandra HETG and the Suzaku XIS and HXD instruments, we are able to fully parameterise the warm absorber finding zones of absorption ranging in ionisation parameter from log to log and ranging in column density from cm-2 to cm-2.
The soft X-ray absorber zones appear to be outflowing with velocities on the order of a few 100 km s-1 with the general trend being that the outflow velocity increases with ionisation parameter. The kinetic output of the zones then appear to be on the order of – erg s-1; values which correspond to very small fractions of the total bolometric output of the AGN and are negligible with respect to the binding energy of the galactic bulge (although such kinetic luminosities could still significantly influence the ISM; Hopkins & Elvis 2010).
Regarding the 2008 Suzaku spectrum of NGC 4051, we detect the presence of two statistically significant absorption lines at 6.8 and 7.1 keV. If these lines are the signature of He-like and H-like Fe respectively then their blueshift suggests that they are the ionised signature of the high velocity outflowing wind previously detected by Pounds et al. (2004a) and Terashima et al. (2009). We are able to model the absorption lines with a single absorber with a turbulence velocity of km s-1 and best-fitting parameters of log and cm-2. The zone appears to correspond to an outflow velocity of km s-1 () and is perhaps the highly ionised signature of the high velocity outflowing zones of gas detected by Collinge et al. (2001) and Steenbrugge et al. (2009).
We constrain the location of the material to be on the order of a few l-d from the black hole, well within the dusty torus for this object and may originate in an accretion disc wind perhaps depositing up to – erg throughout the lifetime of the AGN. We note that we do not, however, find any requirement in these data for the higher velocity outflow ( km s-1) at Fe K reported by Pounds & Vaughan (2010) in their results of a recent XMM-Newton RGS observation.
Finally, the long-term spectral variability can be modelled simply by allowing for changes in the normalisation of the intrinsic, unabsorbed power-law component with respect to a quasi-constant hard reflection component. This can be interpreted as being due to changes in the covering fraction of a Compton-thick absorber obscuring the intrinsic continuum emission. This is consistent with the findings of Miller et al. (2010) who, through studying the effects of reverberation in the hard band, find that a global covering factor of per cent of reflecting material is required in this source. The constancy of the flux of the near-neutral Fe K component across epochs suggests that it does not respond to changes in the overall spectral shape and this is also perhaps supportive of a partial-covering scenario as opposed to intrinsic changes in the continuum flux.
9 Acknowledgements
This research has made use of data obtained from the Suzaku satellite, a collaborative mission between the space agencies of Japan (JAXA) and the USA (NASA). TJT would like to acknowledge the NASA/Chandra grant GO9-0123X and NASA grant NNX 09AO92G. This research has also made use of data obtained from the Chandra X-ray Observatory and software provided by the Chandra X-ray Center (CXC) in the application package CIAO. We would also like to acknowledge data obtained from the High Energy Astrophysics Science Archive Research Center (HEASARC), provided by NASA’s Goddard Space Flight Center.
References
- [1] Arnaud K.A., 1996, in ASP Conf. Ser. 101: Astronomical Data Analysis Software and Systems V, ed. G.H. Jacoby & J. Barnes, 17
- [2] Anders E., Ebihara M., 1982, Geochimica et Cosmochimica Acta, 46, 2363
- [3] Anders E., Grevesse N., 1989, Geochimica et Cosmochimica Acta, 53, 197
- [4] Bautista M.A., Kallman T.R., 2000, ApJ, 544, 581
- [5] Bianchi S., Matt G., 2002, A&A, 387, 76
- [6] Bianchi S., Guainazzi M., Chiaberge M., 2006, A&A, 448, 499
- [7] Blustin A.J., Page M.J., Fuerst S.V., Branduardi-Raymont G., Ashton C.E., 2005, A&A, 431, 111
- [8] Canizares C.R., et al., 2005, PASP, 117, 1144
- [9] Cash W., 1979, ApJ, 228, 939
- [10] Collinge M.J., et al., 2001, ApJ, 557, 2
- [11] Crenshaw M.D., Kraemer S.B., ApJ, 659, 250
- [12] Crenshaw M.D., Kraemer S.B., George I.M., 2003, ARA&A, 41, 117
- [13] Crenshaw M.D., Kraemer S.B., Braito V., Miller L., Lobban A.P., Reeves J.N., Turner T.J., 2010, MNRAS, in prep.
- [14] Denney K.D., et al., 2009, ApJ, 702, 1353
- [15] Dickey J.M., Lockman F.J., 1990, ARA&A, 28, 215
- [16] Elvis M., 2000, ApJ, 545, 63
- [17] Ferrarese L., Merritt D., 2000, ApJ, 539, 9
- [18] Frank J., King A., Raine D., 2002, Accretion Power in Astrophysics, Third Edition, Univ. Press, Cambridge, U.K.
- [19] Fruscione A., et al., 2006, Proc. SPIE, 6270, 60
- [20] Garmire G.P., Bautz M.W., Ford P.G., Nousek J.A., Ricker G.R., 2003, Proc. SPIE, 4851, 28
- [21] Gebhardt K., 2000, ApJ, 539, 13
- [22] Grevesse N., Noels A., Sauval A.J., 1996, ASPC, 99, 117
- [23] Guainazzi M., Mihara T., Otani C., Matsuoka M., 1996, PASJ, 48, 781
- [24] Guainazzi M., et al., 1998, MNRAS, 301, 1
- [25] Häring N., Rix H.-W., 2004, ApJ, 604, L89
- [26] Hopkins P.F., Elvis M., 2010, MNRAS, 401, 7
- [27] Ishida M., Suzuki K., Someya K., 2007, JX-ISAS-SUZAKU-MEMO-2007-11
- [28] Kaastra J.S., Mewe R., 1993, A&AS, 97, 443
- [29] Kallman T.R., Bautista M.A., 2001, ApJS, 133, 221
- [30] Kallman T.R., Palermi P., Bautista M.A., Mendoza C., Krolik J.H., 2004, ApJS, 155, 675
- [31] Kaspi S., et al., 2002, ApJ, 574, 643
- [32] King A.R., 2003, ApJ, 596, 27
- [33] King A.R., 2010, MNRAS, 402, 1516
- [34] King A.R., Pounds K.A., 2003, MNRAS, 345, 657
- [35] Koyama K., et al., 2007, PASJ, 59, 23
- [36] Kraemer S.B., et al., 2005, ApJ, 633, 693
- [37] Krongold Y., Nicastro F., Elvis M., Brickhouse N., Binette L., Mathur S., Jiménez-Bailón E., 2007, 659, 1022
- [38] Krongold Y., et al., 2008, ApJ, 690, 773
- [39] Lamer G., Uttley P., McHardy I.M., 2000, MNRAS, 319, 949
- [40] Lamer G., McHardy I.M., Uttley P., Jahoda K., 2003, MNRAS, 338, 323
- [41] Marconi A., Hunt L.K., 2003, ApJ, 589, L21
- [42] Magdziarz P., Zdziarski A.A., 1995, MNRAS, 273, 837
- [43] Magorrian J., et al., 1998, AJ, 115, 2285
- [44] Markert T.H., Canizares C.R., Claude R., Dewey D., McGuirk M., Pak C.S., Schattenburg M.L., 1994, Proc. SPIE, 2280, 168
- [45] McKernan B., Yaqoob T., Reynolds C.S., 2007, MNRAS, 379, 1359
- [46] Miller J.M., Raymond J., Reynolds C.S., Fabian A.C., Kallman T.R., Homan J., 2008, ApJ, 680, 1359
- [47] Miller L., Turner T.J., Reeves J.N., George I.M., Kraemer S.B., Wingert B., 2007, A&A, 463, 131
- [48] Miller L., Turner T.J., Reeves J.N., 2008, A&A, 483, 437
- [49] Miller L., Turner T.J., Reeves J.N., Lobban A., Kraemer S.B., Crenshaw D.M., 2010, MNRAS, 403, 196
- [50] Mitsuda K., et al., 2007, PASJ, 59, 1
- [51] Morrison R., McCammon D., 1983, ApJ, 270, 119
- [52] Nelson C., Whittle D.M., 1995, ApJS, 99, 67
- [53] Nucita A.A., Guainazzi M., Longinotti A.L., Santos-Lleo M., Marrucia Y., Bianchi S., 2010, A&A, 515, 47
- [54] Ogle P.M., Mason K.O., Page M.J., Salvi N.J., Cordova F.A., McHardy I.M., Priedhorsky W.C., 2004, ApJ, 606, 151
- [55] Porquet D., Dubau J., 2000, A&AS, 143, 495
- [56] Pounds K.A., Reeves J.N., 2009, MNRAS, 397, 249
- [57] Pounds K.A., Vaughan S., 2010, submitted, arXiv:1012.0998
- [58] Pounds K.A., Reeves J.N., King A.R., Page K.L., O’Brien P.T., Turner M.L.J., 2003, MNRAS, 345, 705
- [59] Pounds K.A., Reeves J.N., King A.R., Page K.L., 2004a, MNRAS, 350, 10
- [60] Pounds K.A., Reeves J.N., Page K.L., O’Brien P.T., 2004b, ApJ, 616, 696
- [61] Proga D., Stone J.M., Kallman T.R., 2000, ApJ, 543, 686
- [62] Reeves J.N., O’Brien P.T., Ward M.J., 2003, ApJ, 593, 65
- [63] Reeves J.N., Nandra K., George I.M., Pounds K.A., Turner T.J., Yaqoob T., 2004, ApJ, 602, 648
- [64] Reeves J.N., et al., 2009, ApJ, 701, 493
- [65] Risaliti G., Bianchi S., Matt G., Baldi A., Elvis M., Fabbiano G., Zezas A., 2005, ApJ, 630, 129
- [66] Reynolds C.S., Fabian A.C., 1995, MNRAS, 273, 1167
- [67] Risaliti G., Elvis M., Fabbiano G., Baldo A., Zezas A., Salvati M., 2007, ApJ, 659, 111
- [68] Ross R.R., Fabian A.C., 2005, MNRAS, 358, 211
- [69] Russell D.G., 2004, ApJ, 607, 241
- [70] Shakura N.I., Sunyaev R.A., 1973, A&A, 24, 337
- [71] Shu X.W., Yaqoob T., Wang J.X., 2010, ApJS, 187, 581
- [72] Sim S.A., Long K.S., Miller L., Turner T.J., 2008, MNRAS, 388, 611
- [73] Sim S.A., Miller L., Long K.S., Turner T.J., Reeves J.N., 2010, MNRAS, 404, 1369
- [74] Skibo J.G., 1997, ApJ, 478, 522
- [75] Steenbrugge K.C., Fenovčik M., Kaastra J.S., Constantini E., Verbunt F., 2009, A&A, 496, 107
- [76] Takahashi T., et al., 2007, PASJ, 59, 35
- [77] Taylor R.D., Uttley P., McHardy I.M., 2003, MNRAS, 342, 31
- [78] Terashima Y., et al., 2009, PASJ, 61, 299
- [79] Tombesi F., Cappi M., Reeves J.N., Palumbo G.G.C., Yaqoob T., Braito V., Dadina M., 2010, preprint (astro-ph/1006.2858T)
- [80] Tully R.B., Fisher J.R., 1977, A&A, 54, 661
- [81] Turner T.J., Miller L., 2010, ApJ, 709, 1230
- [82] Turner T.J., Kraemer S.B., George I.M., Reeves J.N., Bottorff M.C., 2005, ApJ, 618, 155
- [83] Turner T.J., Reeves J.N., Kraemer S.B., Miller L., 2008, A&A, 483, 161
- [84] Turner T.J., Miller L., Reeves J.N., Lobban A., Braito V., Kraemer S.B., Crenshaw D.M., 2010, ApJ, 712, 209
- [85] Uttley P., McHardy I.M., Papadakis I.E., Guainazzi M., Fruscione A., 1999, MNRAS, 307, 6
- [86] Uttley P., Fruscione A., McHardy I., Lamer G., 2003, ApJ, 595, 656
- [87] Vaughan S., Edelson R., 2001, ApJ, 548, 694
- [88] Verheijen M.A.W., Sancisi R., 2001, A&A, 370, 765
- [89] Weisskopf M.C., Tananbaum H.D., Van Speybroeck L.P., O’Dell S.L., 2000, Proc. SPIE, 4012, 2
Appendix A
| Line Energy | Line Width | FWHM | EW | Line Flux | Transition Rest-Frame Energy | Velocity Shift | |
|---|---|---|---|---|---|---|---|
| (eV) | (eV) | (km s-1) | (eV) | ( photons cm-2 s-1) | (eV) | (km s-1) | |
| 555.17 | (0.95) | (49.3) | O vi – (554.25) | (500) | 33.3 | ||
| 561.42 | 125.4 | [O vii] – (560.98) | 88.2 | ||||
| 563.87 | 0.17 | 310 | (0.71) | (34.5) | O vi – (563.05) | (440) | 17.2 |
| 575.00 | 0.50 | 610 | (1.26) | (65.6) | O vii – (573.95) | (550) | 43.4 |
| 652.09 | 0.97 | 33.2 | O viii – (653.49) | 30.1 | |||
| 653.62 | 0.54 | 570 | (1.41) | (50.2) | O viii – (653.49) | () | 69.1 |
| 666.84 | 0.68 | 700 | (1.30) | (43.8) | O vii – (665.62) | () | 48.7 |
| 698.63 | (0.57) | (16.6) | O vii – (697.80) | () | 19.0 | ||
| 776.26 | 0.37 | (0.88) | (19.7) | O viii – (774.58) | () | 38.5 | |
| 827.49 | (0.88) | (15.9) | Fe xvii – (825.73) | (640) | 36.0 | ||
| 874.45 | 1.13 | 890 | (1.37) | (22.0) | Fe xviii – (872.65) | (620) | 23.7 |
| 885.14 | 1.28 | 1000 | () | () | Unidentified | 20.5 | |
| 897.89 | (0.91) | (13.2) | Ne viii – (895.89) | (670) | 41.0 | ||
| 906.07 | 0.72 | 550 | 1.39 | 19.5 | [Ne ix] – (905.08) | () | 35.5 |
| 915.19 | 1.12 | 15.3 | Ne ix – (914.80) | (130) | 21.1 | ||
| 919.72 | 0.58 | 440 | (1.15) | (15.8) | Fe xix – (918.10) | () | 41.8 |
| 924.01 | 0.85 | 640 | (1.67) | (22.6) | Ne ix – (922.02) | () | 72.1 |
| 968.29 | 0.78 | 550 | (1.09) | (12.9) | Fe xx – (967.33) | (300) | 38.1 |
| 1011.91 | (0.81) | (8.7) | Fe xxi – (1009.23) | (790) | 46.7 | ||
| 1022.48 | 0.73 | 7.6 | Ne x – (1021.50) | () | 24.7 | ||
| 1024.56 | 0.53 | 350 | (1.48) | (15.6) | Ne x – (1021.50) | () | 129.3 |
| 1055.91 | (0.73) | (7.0) | Fe xxii – (1053.62) | () | 35.9 | ||
| 1129.91 | 1.17 | 720 | (0.59) | (4.9) | Fe xxiii – (1127.20) | () | 25.6 |
| 1354.80 | 0.87 | 450 | (0.74) | (4.0) | Mg xi – (1352.25) | () | 20.6 |
| 1468.07 | 0.65 | 3.0 | Mg xii – (1471.69) | 740 | 18.4 | ||
| 1475.94 | (0.81) | (3.7) | Mg xii – (1471.69) | () | 41.0 | ||
| 1841.75 | 2.66 | 1000 | 1.93 | 5.5 | [Si xiii] – (1839.42) | () | 40.7 |
| 1869.17 | (1.39) | () | Si xiii – (1864.98) | () | 40.8 |
| Value | ||||
| Component | Parameter | Obs. 1 (2005) | Obs. 2 (2008) | Obs. 3 (2008) |
| Power-lawa | ||||
| Norm. (ph cm-2 s-1) | ||||
| Power-law | ||||
| Norm. (ph cm-2 s-1) | ||||
| Partial-Covererc | (cm-2) | |||
| log | ||||
| 70% | 30% | 40% | ||
| reflionx | ||||
| (erg cm s-1) | ||||
| Norm. (ph cm-2 s-1) | ||||
| Absorbere | (cm-2) | |||
| log | ||||
| reflionx | ||||
| log | ||||
| Norm. (ph cm-2 s-1) | ||||
| Absorbere | (cm-2) | |||
| log | ||||
| High abs.g | (cm-2) | |||
| log | ||||
| (km s-1) | ||||
| Fe K | (keV) | |||
| (eV) | ||||
| (ph cm-2 s-1) | ||||
| EW (eV) | ||||