Study of neutrino interactions with
the electronic detectors of the OPERA experiment
OPERA COLLABORATION
Abstract
The OPERA experiment is based on a hybrid technology combining electronic detectors and nuclear emulsions. OPERA collected muon-neutrino interactions during the 2008 and 2009 physics runs of the CNGS neutrino beam, produced at CERN with an energy range of about 5-35 GeV. A total of protons on target equivalent luminosity has been analysed with the OPERA electronic detectors: scintillator strips target trackers and magnetic muon spectrometers equipped with resistive plate gas chambers and drift tubes, allowing a detailed reconstruction of muon-neutrino interactions. Charged Current (CC) and Neutral Current (NC) interactions are identified, using the measurements in the electronic detectors, and the NC/CC ratio is computed. The momentum distribution and the charge of the muon tracks produced in CC interactions are analysed. Calorimetric measurements of the visible energy are performed for both the CC and NC samples. For CC events the Bjorken- distribution and the hadronic shower profile are computed. The results are compared to a detailed Monte Carlo simulation of the electronic detectors’ response.
N. Agafonova1, A. Aleksandrov2, O. Altinok3, A. Anokhina4, S. Aoki5, A. Ariga6, T. Ariga6,
D. Autiero7, A. Badertscher8, A. Bagulya9, A. Bendhabi10, A. Bertolin11,∗, C. Bozza12, T. Brugière7,
R. Brugnera13,11, F. Brunet14, G. Brunetti15,16,7, S. Buontempo2,
A. Cazes7,
L. Chaussard7,
M. Chernyavskiy9,
V. Chiarella17, A. Chukanov18, N. D’Ambrosio19, F. Dal Corso11,
G. De Lellis20,2, P. del Amo Sanchez14,
Y. Déclais7,
M. De Serio21, F. Di Capua2,
A. Di Crescenzo20,2,
D. Di Ferdinando16,
N. Di Marco22,a, S. Dmitrievski18,
M. Dracos23, D. Duchesneau14,
S. Dusini11,
T. Dzhatdoev4,
J. Ebert24, O. Egorov25, R. Enikeev1,
A. Ereditato6,
L. S. Esposito8,
J. Favier14,
T. Ferber24,
R. A. Fini21,
D. Frekers26, T. Fukuda27, A. Garfagnini13,11,
G. Giacomelli15,16,
M. Giorgini15,16,b,
C. Göllnitz24,
J. Goldberg28, D. Golubkov25,
L. Goncharova9,
Y. Gornushkin18,
G. Grella12,
F. Grianti29,17, A. M. Guler3,
C. Gustavino19,c,
C. Hagner24,
K. Hamada27,
T. Hara5,
M. Hierholzer24,
A. Hollnagel24,
K. Hoshino27,
M. Ieva21,
H. Ishida30, K. Jakovcic31, C. Jollet23,∗,
F. Juget6,
M. Kamiscioglu3,
K. Kazuyama27,
S. H. Kim32,d, M. Kimura30,
N. Kitagawa27,
B. Klicek31,
J. Knuesel6,
K. Kodama33, M. Komatsu27,
U. Kose13,11,
I. Kreslo6,
H. Kubota27,
C. Lazzaro8,
J. Lenkeit24,
I. Lippi11,
A. Ljubicic31,
A. Longhin13,11,e,
P. Loverre34, G. Lutter6,
A. Malgin1,
G. Mandrioli16,
K. Mannai10,
J. Marteau7,
T. Matsuo30,
V. Matveev1,
N. Mauri15,16,e,
E. Medinaceli16,
F. Meisel6,
A. Meregaglia23,∗,
P. Migliozzi2,
S. Mikado30,
S. Miyamoto27,
P. Monacelli22,
K. Morishima27,
U. Moser6,
M. T. Muciaccia35,21, N. Naganawa27,
T. Naka27,
M. Nakamura27,
T. Nakano27,
D. Naumov18,
V. Nikitina4,
K. Niwa27,
Y. Nonoyama27,
S. Ogawa30,
N. Okateva9,
A. Olchevski18,
M. Paniccia17,
A. Paoloni17,
B. D. Park32,f,
I. G. Park32,
A. Pastore35,21,
L. Patrizii16,
E. Pennacchio7,
H. Pessard14,
K. Pretzl6,
V. Pilipenko26,
C. Pistillo6,
N. Polukhina9,
M. Pozzato15,16,
F. Pupilli22,
R. Rescigno12,
T. Roganova4,
H. Rokujo5,
G. Romano12,
G. Rosa34,
I. Rostovtseva25, A. Rubbia8,
A. Russo20,2,
V. Ryasny1,
O. Ryazhskaya1,
O. Sato27,
Y. Sato36, A. Schembri19,
W. Schmidt-Parzefall24,
H. Schroeder37, L. Scotto Lavina20,2,g,
A. Sheshukov18,
H. Shibuya30,
G. Shoziyeov4,
S. Simone35,21,
M. Sioli15.16,
C. Sirignano12,
G. Sirri16,
J. S. Song32,
M. Spinetti17,
L. Stanco11,
N. Starkov9,
M. Stipcevic31,
T. Strauss8,h,
P. Strolin20,2,
S. Takahashi27,
M. Tenti15,16,
F. Terranova17,
I. Tezuka36,
V. Tioukov2,
P. Tolun3,
A. Trabelsi10,
T. Tran7,
S. Tufanli3,h,
P. Vilain38, M. Vladimirov9,
L. Votano17,
J. L. Vuilleumier6,
G. Wilquet38,
B. Wonsak24
V. Yakushev1,
C. S. Yoon32,
T. Yoshioka27,
J. Yoshida27,
Y. Zaitsev25,
S. Zemskova18,
A. Zghiche14
and
R. Zimmermann24.
1. INR-Institute for Nuclear Research of the Russian Academy of Sciences, RUS-117312 Moscow, Russia
2. INFN Sezione di Napoli, I-80125 Napoli, Italy
3. METU-Middle East Technical University, TR-06531 Ankara, Turkey
4. SINP MSU-Skobeltsyn Institute of Nuclear Physics of Moscow State University, RUS-119992 Moscow, Russia
5. Kobe University, J-657-8501 Kobe, Japan
6. Albert Einstein Center for Fundamental Physics, Laboratory for High Energy Physics (LHEP),
University of Bern, CH-3012 Bern, Switzerland
7. IPNL, Université Claude Bernard Lyon 1, CNRS/IN2P3, F-69622 Villeurbanne, France
8. ETH Zurich, Institute for Particle Physics, CH-8093 Zurich, Switzerland
9. LPI-Lebedev Physical Institute of the Russian Academy of Sciences, RUS-117924 Moscow, Russia
10. Unité de Physique Nucléaire et des Hautes Energies (UPNHE), Tunis, Tunisia
11. INFN Sezione di Padova, I-35131 Padova, Italy
12. Dipartimento di Fisica dell’Università di Salerno and INFN, I-84084 Fisciano, Salerno, Italy
13. Dipartimento di Fisica dell’Università di Padova, I-35131 Padova, Italy
14. LAPP, Université de Savoie, CNRS/IN2P3, F-74941 Annecy-le-Vieux, France
15. Dipartimento di Fisica dell’Università di Bologna, I-40127 Bologna, Italy
16. INFN Sezione di Bologna, I-40127 Bologna, Italy
17. INFN - Laboratori Nazionali di Frascati dell’INFN, I-00044 Frascati (Roma), Italy
18. JINR-Joint Institute for Nuclear Research, RUS-141980 Dubna, Russia
19. INFN - Laboratori Nazionali del Gran Sasso, I-67010 Assergi (L’Aquila), Italy
20. Dipartimento di Scienze Fisiche dell’Università Federico II di Napoli, I-80125 Napoli, Italy
21. INFN Sezione di Bari, I-70126 Bari, Italy
22. Dipartimento di Fisica dell’Università dell’Aquila and INFN, I-67100 L’Aquila, Italy
23. IPHC, Université de Strasbourg, CNRS/IN2P3, F-67037 Strasbourg, France
24. Hamburg University, D-22761 Hamburg, Germany
25. ITEP-Institute for Theoretical and Experimental Physics, RUS-117259 Moscow, Russia
26. University of Münster, D-48149 Münster, Germany
27. Nagoya University, J-464-8602 Nagoya, Japan
28. Department of Physics, Technion, IL-32000 Haifa, Israel
29. Università degli Studi di Urbino ”Carlo Bo”, I-61029 Urbino, Italy
30. Toho University, J-274-8510 Funabashi, Japan
31. IRB-Rudjer Boskovic Institute, HR-10002 Zagreb, Croatia
32. Gyeongsang National University, ROK-900 Gazwa-dong, Jinju 660-300, Korea
33. Aichi University of Education, J-448-8542 Kariya (Aichi-Ken), Japan
34. Dipartimento di Fisica dell’Università di Roma “La Sapienza” and INFN, I-00185 Roma, Italy
35. Dipartimento di Fisica dell’Università di Bari, I-70126 Bari, Italy
36. Utsunomiya University, J-321-8505 Tochigi-Ken, Utsunomiya, Japan
37. Fachbereich Physik der Universität Rostock, D-18051 Rostock, Germany
38. IIHE, Université Libre de Bruxelles, B-1050 Brussels, Belgium
a. Now at INFN - Laboratori Nazionali del Gran Sasso, I-67010 Assergi (L’Aquila), Italy
b. Now at INAF/IASF, Sezione di Milano, I-20133 Milano, Italy
c. Now at Dipartimento di Fisica dell’Università di Roma “La Sapienza” and INFN, I-00185 Roma, Italy
d. Now at Pusan National University, Geumjeong-Gu Busan 609-735, Korea
e. Now at INFN - Laboratori Nazionali di Frascati dell’INFN, I-00044 Frascati (Roma), Italy
f. Now at Asan Medical Center, 388-1 Pungnap-2 Dong, Songpa-Gu, Seoul 138-736, Korea
g. Now at SUBATECH, CNRS/IN2P3, F-44307 Nantes, France
h. Now at Albert Einstein Center for Fundamental Physics, Laboratory for High Energy Physics (LHEP),
University of Bern, CH-3012 Bern, Switzerland
*Corresponding Authors:
Email addresses: bertolin@pd.infn.it (A. Bertolin),
cecile.jollet@cern.ch (C. Jollet),
anselmo.meregaglia@cern.ch (A. Meregaglia)
1 Introduction
OPERA [1] is a hybrid experiment based on Electronic Detectors (ED) and nuclear emulsions. It is exposed to the long-baseline CNGS beam [2] from CERN to the Gran Sasso underground laboratory (LNGS) 730 km away from the neutrino source. The main purpose of the experiment is the observation of to oscillations in the direct appearance mode. The are identified through the measurement of the leptons produced in their Charged Current (CC) interactions. The neutrino runs started in 2008 and a first candidate has recently been observed [3]. The beam is mainly composed of ; interactions due to the , and contamination amount to 2.1 %, 0.80 % and 0.07 % of the CC event rate. In the following sections the interactions collected in the 2008 and 2009 runs, corresponding to protons on target (p.o.t.) are analysed with fully operating ED, which have taken data for more than 98 % of the active beam time.
The ED are of many uses in the OPERA analysis flow besides their crucial role in the trigger, in the location of the interaction point in the target volume and in the muon identification process. Thus, in this paper we discuss the OPERA ED performances in event selection, muon identification, momentum and charge reconstruction and calorimetry measurements.
The main features of the OPERA ED are presented first, followed by a review of the MC simulation and of the event reconstruction procedure. CC and Neutral Current (NC) interactions measurements are then discussed. The NC to CC ratio, the muon momentum spectrum, the reconstructed energy and the hadronic shower profile are investigated and a detailed comparison with a MC simulation is presented. This analysis is also a benchmark to establish the quality of the MC simulation related to the ED.
2 OPERA electronic detectors
As shown in figure 1, the OPERA detector [4] is composed of two identical super-modules (SM). Each of them has a target section composed by target walls filled with lead/emulsion bricks alternated with walls of scintillator strips that constitute the Target Tracker (TT). Each target wall contains about 2920 bricks and only 53 walls out of 62 are filled. A brick is a mechanical unit which contains 57 emulsion films interleaved with 56 1 mm thick lead plates. The transverse size of the brick is 12.8 10.2 cm2. Each emulsion film has two 44 m thick emulsion layers deposited on a 205 m thick plastic base. Each TT wall is composed of a pair of orthogonal scintillator strip arrays with an effective granularity of 2.6 2.6 cm2 and has a surface of 6.7 6.7 m2 transverse to the beam direction. Strips are read out via Wave Length Shifting (WLS) fibres connected to multi-anode photomultiplier tubes. The total masses of the lead/emulsion bricks and scintillator strips are about 1.25 and 0.3 kton, respectively.
A muon spectrometer at the end of each SM is used to identify muons and to measure their momentum and the sign of their charge. Each spectrometer consists of a dipolar magnet with two arms made of 12 iron plates; the measured magnetic field strength is 1.52 T. The two arms are interleaved with 6 vertical drift-tube planes, the Precision Trackers (PT), for the precise measurement of the bending of the muon tracks. Planes of Resistive Plate Chambers (RPC) are inserted between the iron slabs of the magnets, 11 planes in each arm. Each RPC plane, 8.7 7.9 m2 transverse to the beam direction, is equipped with two orthogonal sets of copper readout strips. These planes provide a coarse tracking, a range measurement of the stopping particles and a calorimetric analysis of the hadrons escaping the target along the incoming neutrino direction. Two planes of resistive plate chambers (XPC), with the read out strips tilted by 42.6∘ with respect to the horizontal, are also placed after each target section to solve left/right ambiguities in the track pattern recognition. Together with the RPC, the XPC are used to provide an external trigger to the PT. A 10 9.12 m2 anti-coincidence glass RPC detector, the VETO, is placed in front of the first SM to exclude (or tag) interactions occurring in the material and in the rock upstream of the target. Although the ED are not conceived to perform calorimetric measurements, they can be used for this purpose with a coarse resolution.
An example of a CC event as seen by the OPERA ED is shown in the top part of figure 2, where the long tail of hits easily identifies a very high momentum muon track. The bottom part of figure 2 shows a NC event. The connection between the ED and the nuclear emulsion data is described in [3, 5, 6].
3 MC Simulations
3.1 Events Generation
CC interactions can occur in the Quasi-Elastic (QE), Resonant (RES) or Deep Inelastic Scattering (DIS) regimes. In the QE and RES processes the hadronic system observable in the detector is faint as most of the incoming neutrino energy is transferred to the final state lepton. Conversely in the DIS process a prominent hadronic system is observed in the detector. In order to get a prediction for the number of expected neutrino interactions in OPERA, the differential neutrino cross sections, , for the CC-DIS, CC-QE and CC-RES processes on an isoscalar target, known from other experiments [7], are convoluted with the CNGS neutrino flux. The mean energy of the incoming beam is 17.7 GeV [8] if the long tail extending above 100 GeV is not included. Only 0.6 % of the total flux has an energy exceeding 100 GeV, this corresponds to less than 4 % of the CC event rate on an isoscalar target [2]. Once the detector target mass and the number of recorded p.o.t. are defined, the absolute prediction for the expected number of interactions is computed together with the relative fractions of each process. The CC-DIS, CC-QE and CC-RES fractions are corrected for the non-isoscalarity of the materials used in the OPERA detector. The CC-DIS process is found to be dominant with a fraction exceeding 90 %. Using the procedure outlined in reference [7], the NC to CC ratio on an isoscalar target is predicted to be 0.31, while it is 0.29 once the non-isoscalarity corrections are taken into account. Hence the NC contribution is also fixed. Only NC interactions in the deep inelastic scattering regime are considered as final state particles have to be observed in the ED. The final states for the different processes, CC-DIS, CC-QE, CC-RES and NC-DIS, are generated using the NEG MC program [9], developed in the framework of the NOMAD experiment [10]. The NEG MC is supplied with the CNGS neutrino spectrum up to 400 GeV. The generated events can then be mixed according to the appropriate fractions.
3.2 Environment simulation of the OPERA detector
For the event simulation in the target, neutrino interaction primary vertexes are generated in the lead/emulsion volumes as well as in the volumes of the TT scintillator strips. The lead represents 93 % of the target mass, the rest being emulsion films. Neutrino interactions do not occur only in the target but also in the other OPERA detector structures, like the spectrometers, in any material present in the experimental hall, including the BOREXINO [11] detector and its related facilities, and in the surrounding rock. The ratio between the number of recorded interactions occurring inside and outside the target is about 1 to 6. As a consequence, primary vertexes have been generated in all of the above mentioned volumes since final state particles from any of these volumes may easily reach the OPERA target. Due to the asymmetric beam energy profile, with a tail at very high energy, a large enough volume of rock has to be considered. Upstream of the detector a cylinder of rock, 35 m of radius and 300 m of length, has been used in the simulation. The rock volume surrounding the detector has the shape of a cylinder with a radius of 35 m and an inner empty volume corresponding to the LNGS Hall C shape hosting the OPERA detector. MC studies show that 99 % of the external events with hits reaching the OPERA detector are contained in a volume which is 35 % smaller than the simulated one. Once primary vertexes are generated, the produced outgoing particles are propagated through the different simulated volumes and their interaction with matter, either with passive elements, like the rock, or with a sensitive detector volume, is performed using the GEANT3 [12] Virtual MC simulation package, version 1.10.
4 Event reconstruction
In order to provide a comparison with the data, the reconstruction of the simulated neutrino interactions is performed, using the same algorithms as for real data, and the efficiencies of the different analysis steps, such as the selection of neutrino interactions with the primary vertex contained in the target, NC vs CC event tagging or muon identification are evaluated.
4.1 Selection of neutrino interaction events inside the target
The OPERA DAQ system [4, 13] records with high efficiency all the interactions leaving a significant activity in the OPERA detector. To achieve this the ED data are actually acquired in triggerless mode since the read out of the front-end electronics is asynchronous with the data, time stamped with a 10 ns clock. A minimum bias filter is applied at the level of subdetectors in order to reduce the detector noise. The event building is then performed by collecting all the hits in a sliding time window of 3000 ns and requiring: hits in the and projections of at least two TT planes or a TT plane with the sum of the photomultiplier signals exceeding 1500 ADC counts, and the presence of at least 10 hits. If a muon track is present in the final state, the trigger efficiency of the DAQ system, estimated with MC methods, exceeds 99 %. Even in the worst configuration where a to oscillation occurs followed by a QE interaction and a to decay, the trigger efficiency, averaged over the energy spectrum, exceeds 95 %.
Cosmic ray induced events are also recorded [14] but they can be easily rejected as they are not on time with the CNGS beam. Therefore an almost pure sample of 31576 interactions on time with the beam, with the primary vertex contained inside or outside the OPERA target, was obtained for the 2008-2009 neutrino runs. As events occurring in the target represent a small fraction of the total number of recorded events an automatic algorithm, OpCarac [15], identifies such events, called hereafter “contained” events. The contained events are more precisely those located in the target volume actually filled with bricks, this volume is fully instrumented by the TT, the walls of which being larger than the target walls. Events not fulfilling this requirement are called hereafter “external” events. The OpCarac algorithm efficiency, estimated as the ratio between the number of MC events generated in the target volume and selected as contained to the total number of MC events generated, is high, as shown in table 1, in particular for CC events.
The external events are mostly due to CC interactions occurring in the rock
surrounding the detector. The final state muon is crossing the full
detector or entering from the sides. These events are easily
identified and rejected by OpCarac.
The presence of the VETO system is particularly helpful when the muon is
entering the detector from the front.
The number of recorded external events with this topology was compared to MC
expectations. Data and MC are in agreement within the
10 % error on the expected number of CC events due
to the uncertainty on the total beam flux and on the CC cross
section.
Further MC studies show that CC events occurring in the rock
surrounding the Hall C volume, in which the final state muon escapes detection,
can also generate secondary particles produced at large angle with respect
to the incoming neutrino direction and hence reaching the target volume.
In this case the observed activity is mainly concentrated at the edges
of the TT. These events appear as low activity NC events.
Dedicated MC studies show
that the spatial distribution of the low activity NC events measured in
data and MC agree within the quoted 10 % uncertainty.
Due to the low activity in the ED these events
are difficult to distinguish from genuine NC events occurring in the target.
The contribution of NC interactions outside the target volume
to the external event sample was checked through MC to be 20 % of
the overall external sample.
In order to keep the efficiency for NC events occurring in the target high, a
contamination of external events is unavoidable.
While the CC sample is basically free of external events, the
contamination of the NC sample is at the 10 % level and 3 % for the whole
NC+CC sample.
| Type | Contained fraction |
|---|---|
| CC | 97.6 1.4 % |
| NC | 83.0 1.6 % |
4.2 Muon Identification
The muon identification performed by the ED is of primary importance in the OPERA analysis flow because:
-
•
The muonic decay is a “golden channel” to tag the to oscillation since it is the only channel where the momentum and charge of the decay daughter can be measured.
-
•
The identification of a muon track originating from the primary vertex is of crucial importance to discard all the CC inclusive interactions which are a source of background for the search.
-
•
The muon charge measurement allows to discriminate muons coming from decay, with negative charge, from those produced by the decays of charmed particles, with positive charge. This background is unfavourably large as charm is produced in of CC interactions and the charm branching ratio into is [7].
According to the requirements defined in the OPERA detector proposal, a CC tagging efficiency or similarly a muon identification efficiency greater than 95 % has to be attained. Two algorithms have been developed [16]: the first one is based on global event topology and is therefore independent from the track reconstruction efficiency. It can be applied to all the events, it is used for an evaluation of the NC/CC ratio, and it provides also a general veto for NC events. The second algorithm relies on the muon track reconstruction and it can therefore be applied only to events where a track exists; it is mandatory for the connection of the muon track between ED and emulsions.
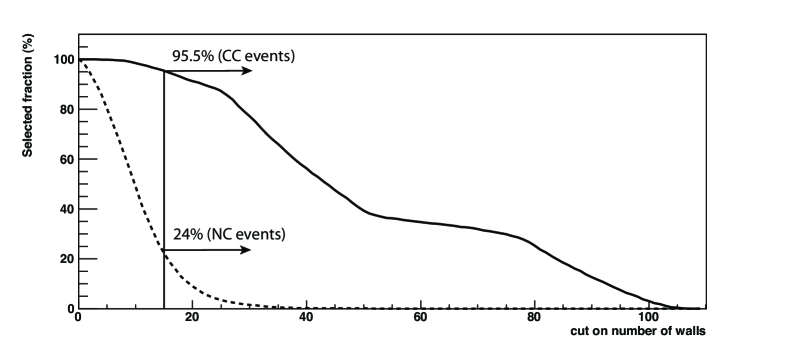
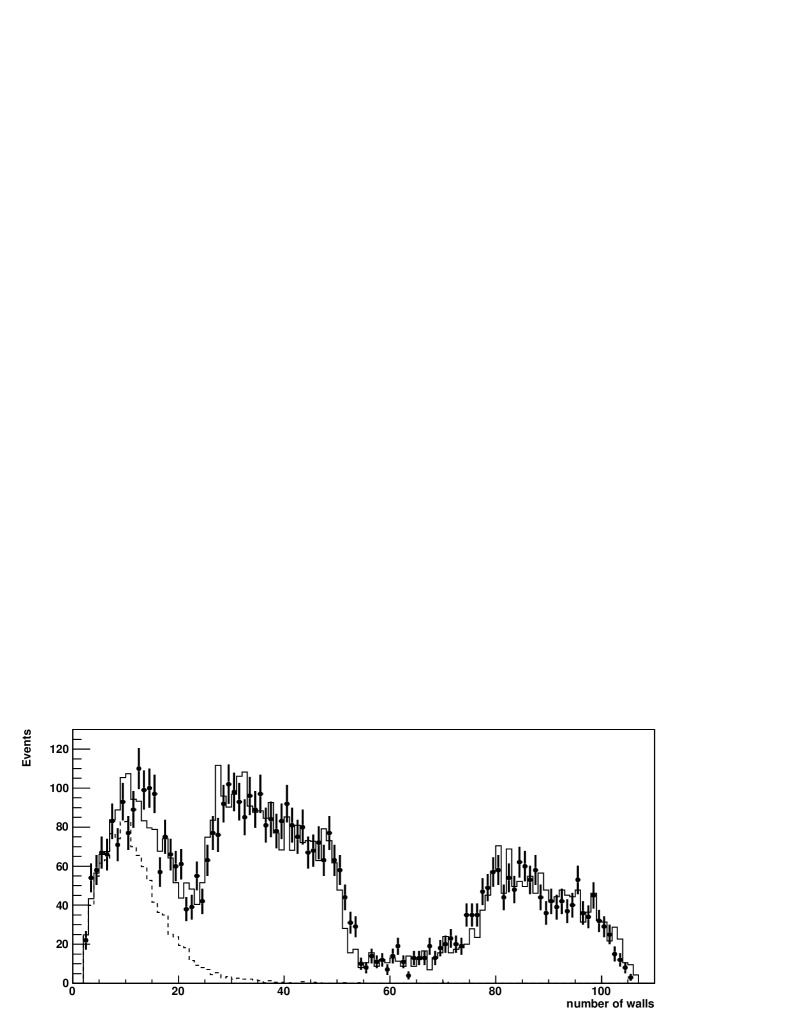
In the first algorithm the criterion to classify CC and NC events is based on the total number of ED planes containing hits (). For the TT subdetector, is obtained by counting the number of walls with signals in either of the two orthogonal planes; for the RPC subdetector the number of planes with signals in either of the two orthogonal sets of readout strips is considered. The TT walls and the RPC planes are equally treated in this calculation. The energy lost by a minimum ionising particle between two consecutive RPC planes is 57.1 MeV. Between two TT walls it is 71.4 MeV, 25 % larger. The corresponding numbers of interaction lengths are respectively 0.298 and 0.328, 10 % larger. The ratio between the and the interaction length of the two media is not so large to justify a different treatment in the algorithm applied. Furthermore this difference is present both in data and MC. In order to meet the requirement of the OPERA detector proposal of a CC tagging efficiency greater than 95 %, the lower cut on must be set to 14 planes, as can be seen in figure 3. Correspondingly a large contamination of true NC events wrongly tagged as CC can not be avoided. MC studies showed that starting from a pure sample of NC events, about 24 % are erroneously tagged as CC, 6% relative to the full sample. Events with 14 planes are instead tagged as NC. The tagging efficiencies are summarised in table 2. The distributions for data and MC events are shown in figure 4, the agreement is reasonable.
| Type | Correctly identified fraction |
|---|---|
| CC | 95.5 1.4 % |
| NC | 76.0 1.2 % |
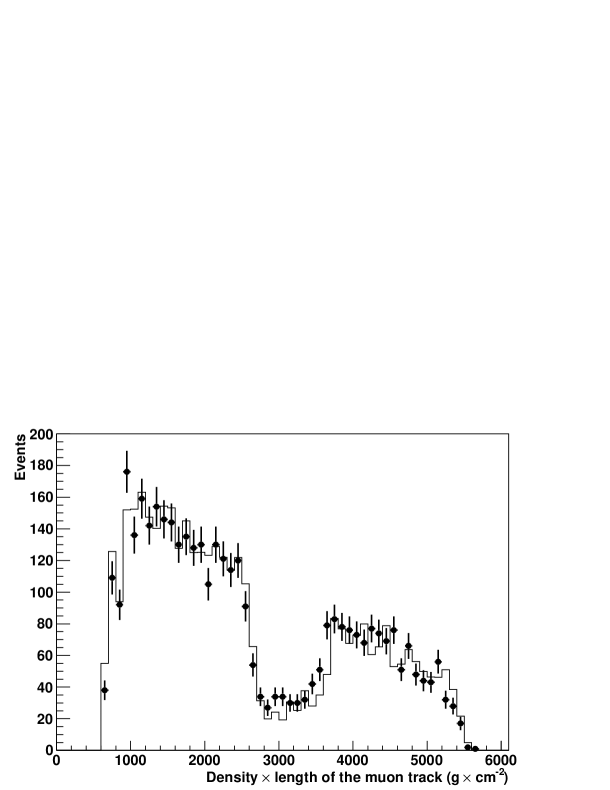
The second algorithm is based on a precise reconstruction and identification of the muon track. The track reconstruction relies on a sequence of algorithms. Primarily the ED hits are connected to form tracks in both longitudinal projections by a pattern recognition algorithm. Then the 3-dimensional tracks are reconstructed by associating tracks in the two projections. A Kalman filter [17] is also used to calculate the momentum and to reject hits wrongly assigned to tracks. The length times density is then computed and used to identify a generic track as a muon track. The length is defined by adding straight distances between consecutive TT and/or RPC hits (TT walls are spaced by about 13 cm and RPC planes by about 7 cm) along the whole track length. The actual detector structure along the track path fixes the value to be used for density. The muon identification criterion is based on a cut on the length times density of the longest reconstructed 3-dimensional track in the event. Requiring a muon identification at the level of 95 % implies a cut at 660 g cm-2. The length times density distributions for data and MC, above the selection cut, are shown in figure 5, where the MC distribution has been normalised to the data. The MC simulation reproduces well the data trend. For each track identified as a muon by the length times density criterion, the algorithm provides an estimate of the momentum. If the track stops in the target or leaves the target but does not fully cross at least one spectrometer arm, the energy is measured by range and the charge measurement is not available. MC studies show that the NC contamination of the sample of events with at least one muon track is 5.2 %. In the sample of events where a spectrometer is crossed, the NC contamination is as small as 0.8 %. In addition, if at least one muon with negative charge is required the contamination drops to 0.4 %.
4.3 NC to CC ratio
In this study, the algorithm based on the number of ED planes with hits is used for identifying muons and hence CC events. Applying first the contained event selection algorithm and then the muon selection criterium on to the data, 4332 events are classified as CC ( %) and 989 events as NC ( %). This gives a NC to CC ratio of .
The MC estimation of the NC to CC ratio has to take into account the efficiencies of both the contained events selection, see table 1, and the correct CC and NC event tagging, see table 2. Moreover, as already seen in section 4.1, detailed studies on the event selection show that in the data there is a non-negligible contamination of external events. Scaled to the number of true CC events occurring inside the target, this contamination was estimated to be 2.96 % for the NC and 0.78 % for the CC samples. The number of reconstructed CC and NC events can be estimated via the following equations:
| (1) | |||
where:
-
•
is the efficiency of the contained events selection algorithm for the CC MC sample.
-
•
is the efficiency of the contained events selection algorithm for the NC MC sample.
-
•
is the efficiency of the CC selection algorithm for the CC MC sample.
-
•
is the efficiency of the NC selection algorithm for the NC MC sample.
-
•
is the true number of CC MC events.
-
•
is the true NC/CC ratio.
Using the value of computed in section 3.1, 0.29, and those of
the efficiencies given in tables 1
and 2, the MC expectation for the NC to CC ratio comes to 0.257.
The efficiencies for the contained events selection and for the NC and CC tagging
are extracted from the MC simulation, each with a statistical uncertainty in
the range of 1 % to 2 %, as shown in tables 1
and 2. These errors are then numerically propagated in
equation 1 to obtain a statistical uncertainty of 0.018 on the MC NC to
CC ratio.
Systematic uncertainties due to CC and NC events tagging can be estimated
by changing the cut on .
Varying the cut from 10 to 25 planes, the maximal discrepancy between
data and MC on the NC to CC ratio is 0.019.
Another source of systematics comes from the uncertainties in the contained events
selection algorithm.
As it can be seen in table 1, 17 % of the NC MC events are not selected.
Out of these, 4.2 % are discarded since they would not fulfill the trigger condition
(see section 4.1).
The remaining 12.8 % of the events are in a transition region, with little activity
recorded in the detector. Conservatively a 50 % error is assumed for this particular
topology of NC events.
The same computation for the CC events gives about a 1 % error.
This propagates into an error of 0.015 on the final result.
In order to check for additional systematic uncertainties due to the contained
events selection algorithm, data and MC calculations for the NC to CC ratio are
repeated using events with the primary vertex in the first and the second SM
separately. No difference is found in either the simulation or the real data where
the values obtained for the ratio agree within 1 sigma. Therefore, a possible
contribution to the systematic error of the measurement is negligible.
The last source of uncertainties is on the number of
external events which affect mostly the NC sample.
This uncertainty is obtained by inspecting
the agreement between data and MC in variables that are particularly sensitive to
the external background component such as the visible energy and the three
dimensional position of the events. While genuine NC events
are uniformly distributed inside the target, external events tend to be
more concentrated towards the edges.
This analysis showed that the expected number of background
events in data and MC are in reasonable agreement, within an uncertainty safely
estimated to be in the range of % to %.
After numerical propagation in equation 1, this translates into an error
of 0.006 in the final result.
Adding the different contributions in quadrature, the overall systematic uncertainty
on the NC to CC ratio for the MC is 0.025.
The results are shown in table 3 where statistical and systematic errors
for MC have been added quadratically.
| NC/CC | |
|---|---|
| Data | 0.228 0.008 |
| MC | 0.257 0.031 |
5 OPERA ED performances on neutrino event reconstruction
In the following paragraphs, data MC comparisons are presented on several reconstructed quantities characterising neutrino interaction events.
5.1 Muon momentum reconstruction
A first step in establishing the quality of the muon momentum reconstruction can be done by comparing the momentum distribution measured in data and MC for the contained events. For this test it is desirable to use a sample with a reduced NC contamination in order to disentangle the true muon reconstruction from possible effects due to background hadron tracks. Therefore all events are required to have their muon momentum measured from the bending in the spectrometer. In addition, a negative measured charge is required. The measured muon momentum distribution is shown in figure 6 and compared to MC expectations. The MC has been normalised to the number of p.o.t. corresponding to the 2008-2009 data sample. The error on the MC prediction is obtained after taking into account the uncertainty in the value of the magnetic field, which translates into a 3 % shift of the MC spectrum, and the already quoted 10 % uncertainty on the expected number of CC events, the latter being the dominant source of uncertainty. The contribution obtained from the to MC events with subsequent decay into of the final state lepton is also shown in figure 6, with an arbitrary normalisation, to show the interesting momentum region. The spectrum of from decay is much softer than the spectrum measured for CC interactions: the mean values obtained from the MC simulation are -6.8 and -12.7 GeV/c, respectively. In order to perform a shape comparison both data and MC distributions have been normalised to 1. A value of 16.56 for 17 d.o.f. is obtained without considering the magnetic field and the incoming neutrino flux uncertainties. The overall normalisation was also checked: the number of events in data and MC agree within 6 %, well within uncertainties.
5.2 Muon charge reconstruction
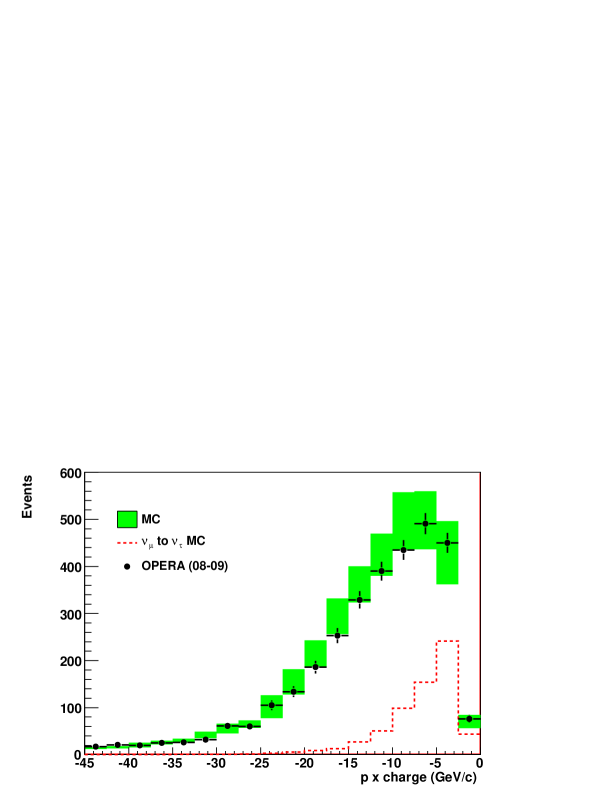
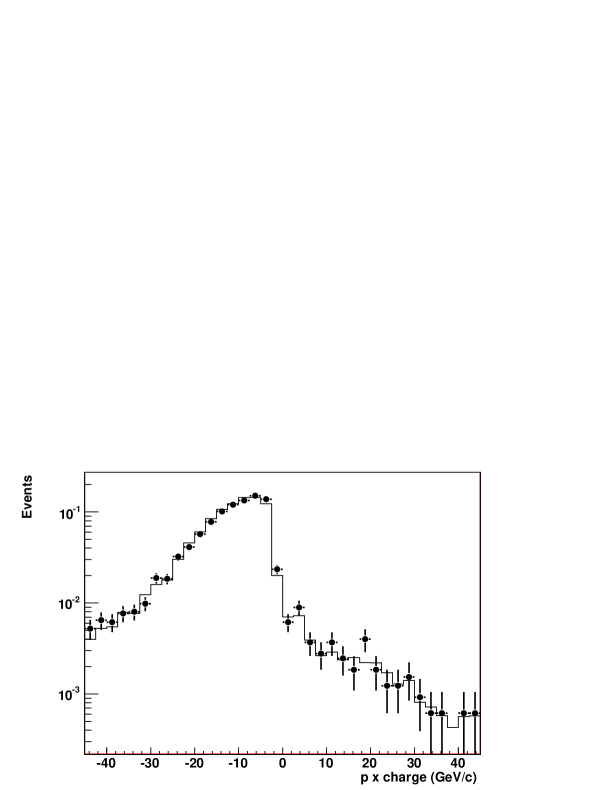
As mentioned in section 1, a component is present in the beam, leading via the CC process to positive muon tracks. These can be used to test the muon charge reconstruction algorithm by performing a measurement of the to events ratio. The efficiency of the algorithm has been studied on CC MC events. It is defined as the fraction of simulated muon tracks reconstructed with the true charge. As expected, the charge determination uncertainty increases with the muon momentum. If an upper limit on the absolute value of the momentum is set at 45 GeV/c the wrong determination of the muon charge is smaller than 2 %. The charge reconstruction efficiency is also reduced at low momentum. In this case the 3-dimensional track identified as a muon may be a charged hadron and hence the measured charge is not that of the muon. This was not observed in MC events with the final state including a muon and negligible hadronic activity, as a confirmation of this hypothesis. Once again, if a lower limit on the absolute value of the momentum is set at 2.5 GeV/c, the wrong determination of the muon charge is smaller than 2 %. For muon momenta between 2.5 GeV/c and 45 GeV/c, the fraction of events with wrong charge determination is 1.2 %. The to events ratio, within the selected momentum range, obtained from data can be directly compared with predictions based on the full MC sample: 3.92 0.37 (stat.) % for data, 3.63 0.13 (stat.) % for MC. Figure 7 shows the momentum times charge distribution for data and MC, both normalised to one: the value is 23.34 for 35 d.o.f.
5.3 Energy reconstruction
This section studies the energy reconstructed using the TT subdetector. A signal is measured at each end of the scintillator strips in terms of ADC counts (see [18] for details), and then converted into a number of photo-electrons (p.e.) according to the gain of the photomultiplier (PMT) channel. The sum of the number of p.e. measured on both sides is converted into energy deposit (in MeV), according to the position of the hit along the strip and to a calibration curve that accounts for the attenuation of the signal along the strip fibre. This calibration has been performed using radioactive sources before detector assembly and cosmic ray data. First the dependence of the number of p.e. of a minimum ionising particle (mip) on the crossing position along the strip has been validated (see section 5.3.1), and used to compute the visible energy. Then a calibration of the ED has been performed in order to convert the visible energy into total energy (see section 5.3.2). The reconstruction algorithms are used to study, in data and MC, the distributions of the Bjorken- variable (section 5.3.3).
5.3.1 Visible energy
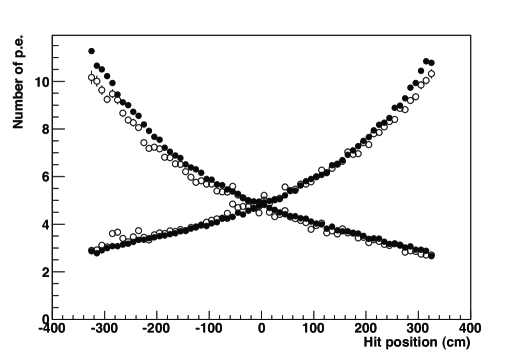
Events with long tracks left by a mip have been selected and hits associated only to those tracks have been considered. In figure 8, the number of p.e. recorded on each side of the fibre is plotted as a function of the distance to the hit. A double exponential decrease fits both the data and MC. The number of p.e. recorded at the centre of the fibre is typically 5. The maximal discrepancy between data and MC is within 10 %. The reverse relation is used for converting a number of p.e. into visible energy once the hit position is reconstructed. This has been done for events with at least one muon identified and events without muon identified separately, the comparison between data and MC is shown in figure 9.
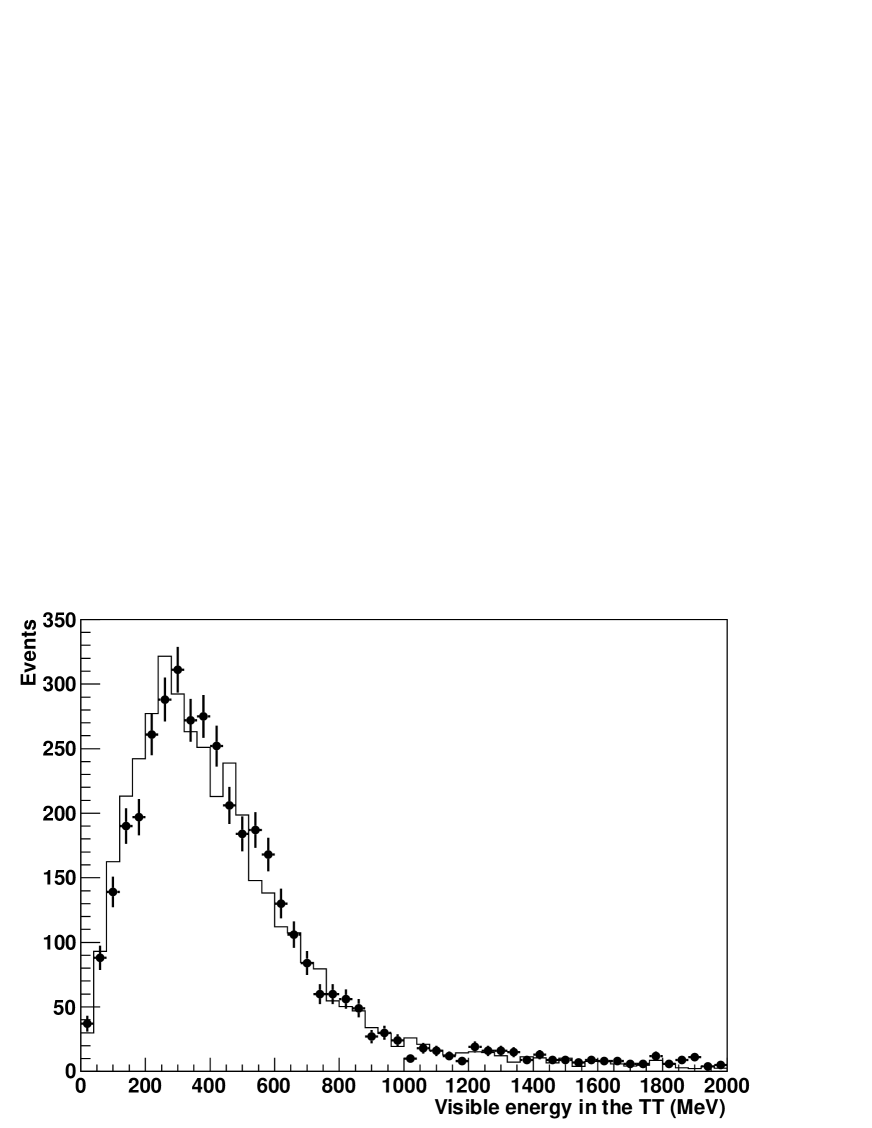
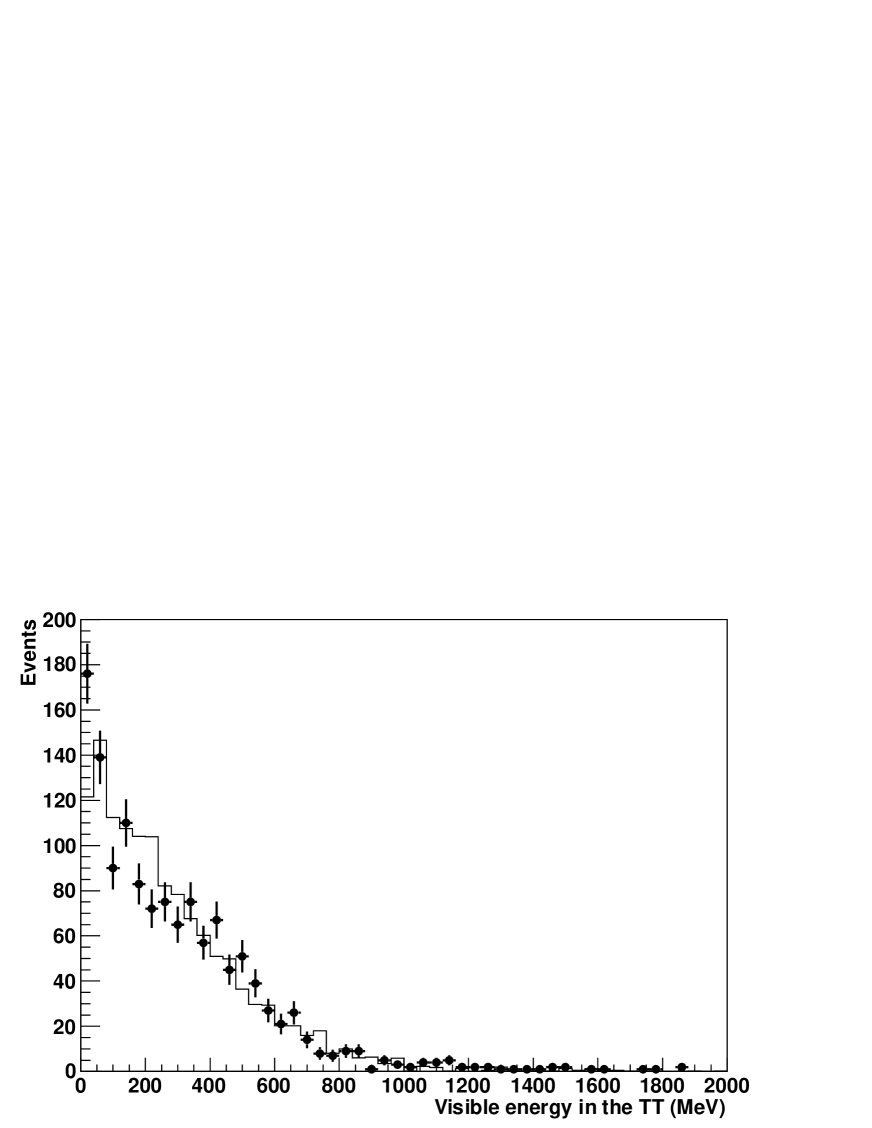
There is on average a reasonable agreement between data and MC simulation, however some discrepancies can be seen at very low energy for NC events. The energy deposit for NC events has been studied discarding soft NC-like events, i.e. requiring at least one 3-dimensional reconstructed track, and the low energy disagreement disappeared.
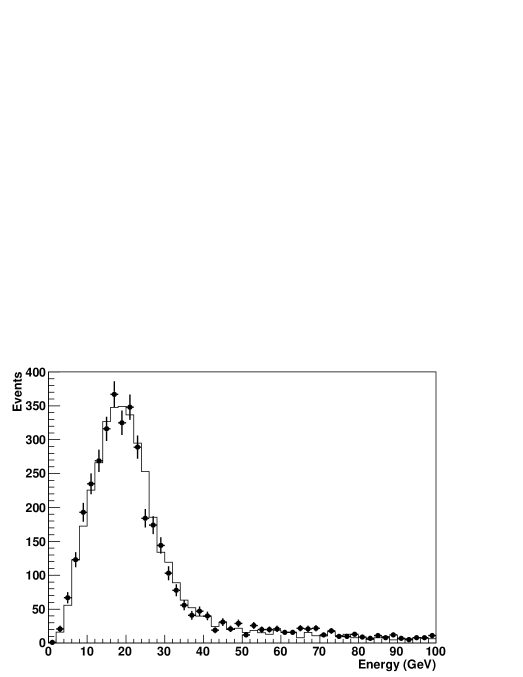
5.3.2 Reconstructed energy
In order to reconstruct the kinematical variables of an interaction, the knowledge of the total hadronic energy is required. Based on a MC simulation, the relation between the true hadronic energy and the visible energy deposited in the TT and the RPC strips has been parametrised. The reverse parametrisation is used to estimate the hadronic energy from the ED data. Details on the energy resolution can be found in section A.3. The results obtained by adding the hadronic and the muon energy are shown in figure 10 for events with at least one identified muon: data and MC are in reasonable agreement.
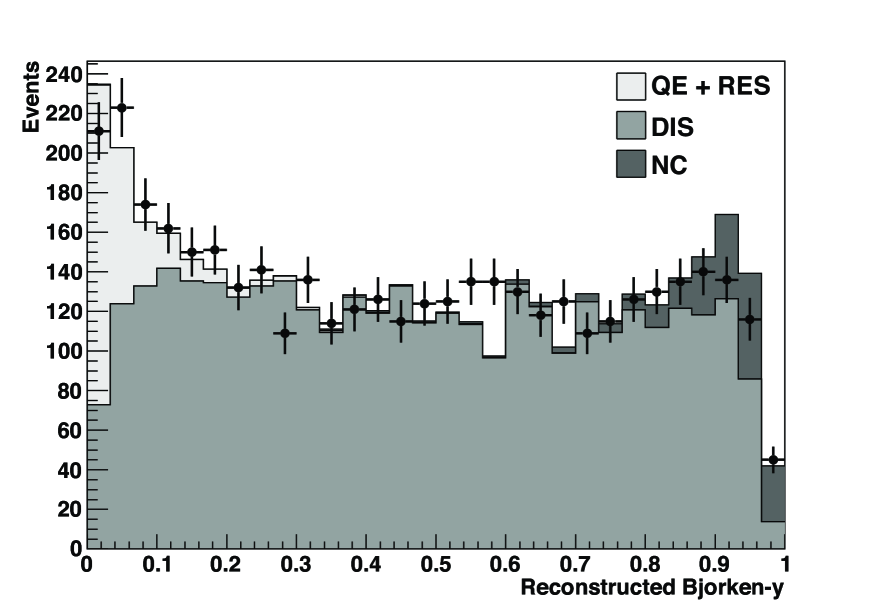
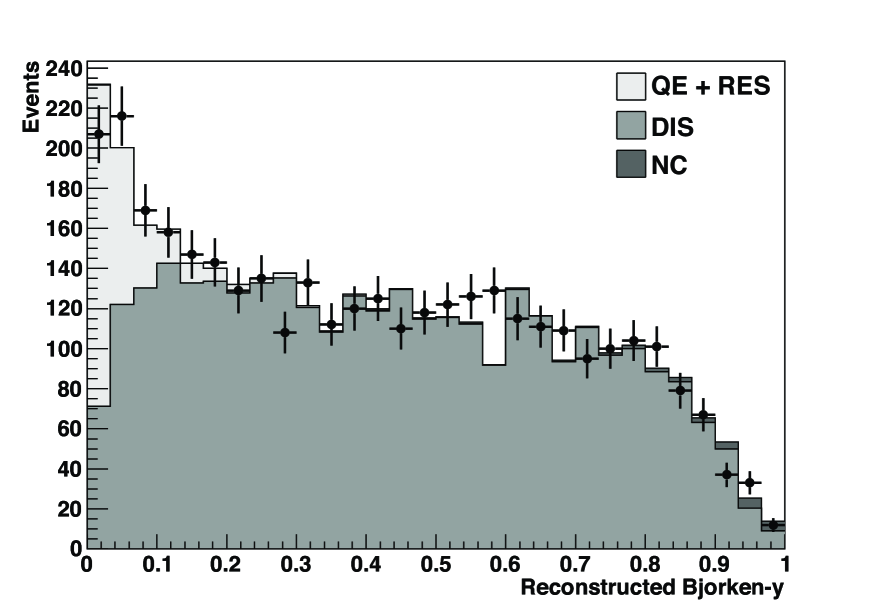
5.3.3 Bjorken-
The Bjorken- variable represents the fraction of the hadronic energy with respect to the incoming neutrino energy. For CC interactions:
| (2) |
where , and are the quadrimomenta of the particles involved, the Bjorken- variable is defined as:
| (3) |
In the laboratory frame the Bjorken- variable can be computed as:
| (4) |
where is the incoming neutrino energy, the energy of the outgoing muon and the hadronic energy. Bjorken- connects the muon momentum measurement, performed in the spectrometer or by range, with the calorimetric measurements of all the hadrons. The results for the events selected with at least a muon track and for the events with the muon momentum measured by the spectrometer are shown in figure 11 in the left and right plots, respectively. The agreement between data and MC simulation is reasonable: the values are 55.4 and 48.7 respectively, for 29 d.o.f. The sum of the QE and RES processes can be clearly seen as a peak at low values. The NC contribution shows up at values of Bjorken- close to one. Figure 11 shows that the NC contribution becomes negligible when a track with its momentum measured by the spectrometer is required. This analysis results in an overall cross check of the performances of the ED.
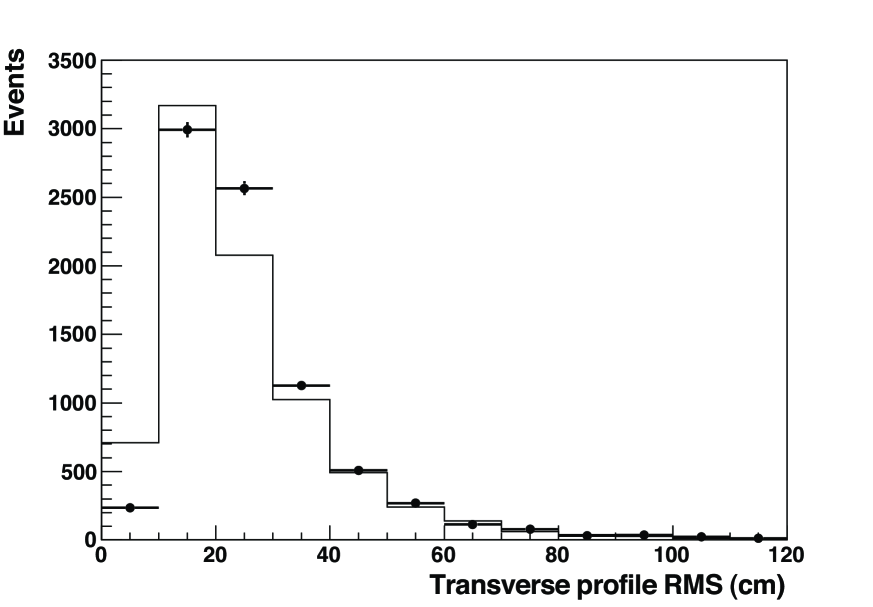
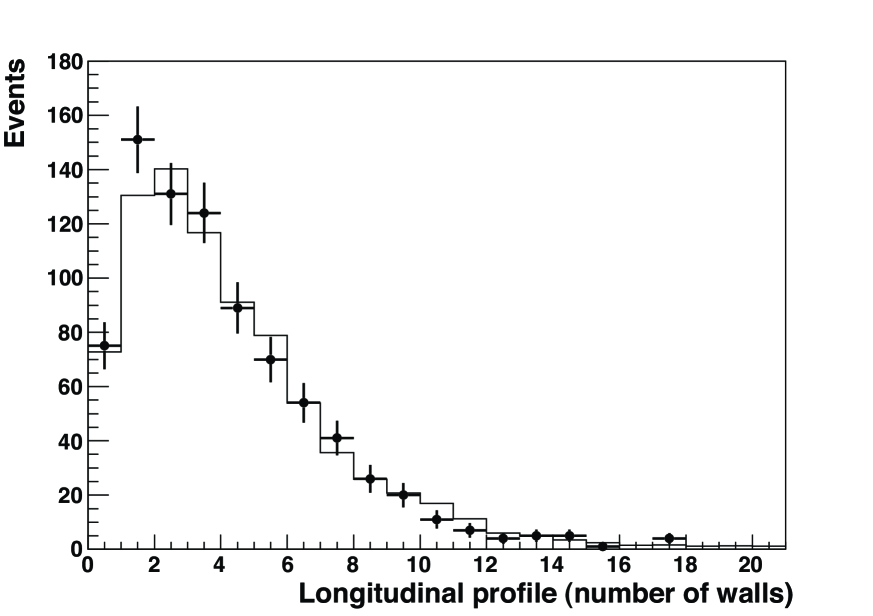
5.4 Hadronic shower profile
A precise implementation in the MC simulation of the hadronic activity observed in data is very difficult: tools such as GHEISHA [19] or FLUKA [20] describe imperfectly the measurements available. Nevertheless, the hadronic activity is used, at least indirectly, in algorithms such as the contained events selection or the brick finding. Therefore, the hadronic shower profile in a sample of CC contained events has been analysed. The selected variables are the rms of the distribution of the shower profile in the X and Y projections (the transverse projections), where the TT hit positions are weighted by the number of collected p.e. The results are shown in figure 12 (left). Similarly, the longitudinal profile of the shower is shown in figure 12 (right). In order to correctly calculate the longitudinal profile, the muon track has been removed, relying on an algorithm that finds the point where the muon exits from the shower and a clear track shows up. Comparing the transverse profile the hadronic activity measured in data is broader than in MC, whereas this effect is not visible in the longitudinal profile of the shower. The simulation results shown here have been obtained with the GFluka option turned on in the GEANT3 simulation. The same comparison using the GHEISHA option yields a larger disagreement between data and MC.
6 Conclusions
The interactions data collected by the OPERA
experiment in its two first running years, 2008 and 2009, have been
analysed using the full potentialities of the electronic
detectors.
During this period, all electronic detectors were fully
operational for more than 98 % of the active beam time.
Neutral and charged current interaction events have been analysed,
and a preliminary neutral to charged current event ratio has been
measured and found to be consistent with MC expectations.
The analysis of the released energy profiles for both neutral and charged
current events has been performed and a good agreement between data and MC
found.
Charged current events have been analysed in terms of muon momentum
and charge reconstruction.
In particular, the muon charge ratio has been found to be consistent with the
expected beam contamination.
In addition, charged current events have been used to measure the total
reconstructed energy and the Bjorken- distribution.
Finally, the hadronic shower profile
has been analysed and compared to a MC simulation.
Although some characteristics of the energy profile are not reproduced
in detail the general description is satisfactory.
The results presented have shown the excellent performances of the OPERA
electronic detectors and a good understanding of their simulation and response.
7 Acknowledgements
We thank CERN for the commissioning of the CNGS facility and for its successful operation, we thank INFN for the continuous support given to the experiment during the construction, installation and commissioning phases through its LNGS laboratory. We warmly acknowledge funding from our national agencies: Fonds de la Recherche Scientifique - FNRS and Institut Interuniversitaire des Sciences Nucléaires for Belgium, MoSES for Croatia, CNRS and IN2P3 for France, BMBF for Germany, INFN for Italy, JSPS (Japan Society for the Promotion of Science), MEXT (Ministry of Education, Culture, Sports, Science and Technology ), QFPU (Global COE program of Nagoya University, “Quest for Fundamental Principles in the Universe” supported by JSPS and MEXT) and Promotion and Mutual Aid Corporation for Private Schools of Japan, SNF, the Canton of Bern and the ETH Zurich for Switzerland, the Russian Federal Property Fund, the grant 09-02-00300_a, 08-02-91005-CERN, Programs of the Presidium of the Russian Academy of Sciences “Neutrino Physics” and “Experimental and theoretical researches of fundamental interactions connected with work on the accelerator of CERN”, Programs of support of leading schools of thought (grant 3517.2010.2), Federal Agency on a science and innovations state contract 02.740.11.5092 for Russia, Department of priority directions of science and technologies, the Korea Research Foundation Grant (KRF-2008-313-C00201) for Korea. We are also indebted to INFN for providing fellowships and grants to non Italian researchers. We thank the IN2P3 Computing Centre (CC-IN2P3) for providing computing resources for the analysis and hosting the central database for the OPERA experiment. We are indebted to our technical collaborators for the excellent quality of their work over many years of design, prototyping and construction of the detector and of its facilities. Finally, we thank our industrial partners.
Appendix A: simulation of the Electronic Detectors
In this appendix the simulation of the most relevant subdetectors, TT, RPC and PT, will be reviewed in some detail. The single strip, TT/RPC, or drift tube, PT, efficiencies implemented in the MC simulation are given in table 4. The last subsection will also show the performances, in term of energy resolution, of the calorimetric measurements that can be achieved with OPERA.
| Detector | Efficiency |
|---|---|
| TT | 99 % (threshold at 1/3 p.e.) |
| RPC | 95 % |
| PT | 99 % |
A.1 Simulation of the RPC
When a particle is tracked through the volume occupied by the RPC planes, one or more adjacent hit strips are created and the corresponding times are recorded. Nine planes in each super-module are also used to generate a fast trigger signal used as an external trigger by the drift tubes of the PT. This trigger signal is also accurately computed in the simulation. Due to the different width of the horizontal and vertical sets of readout strips, a slightly different efficiency is implemented in the MC simulation. The efficiency in the MC is tuned from the observed multiplicity of vertical and horizontal strips measured for neutrino induced muon tracks. From these data and from cosmic ray data, the average strip efficiency measured in situ exceeds 95 %. The stability of the performances is monitored using cosmic ray data.
A.2 Simulation of the PT
If a charged particle passes through the gas filled volume of a PT drift tube, the hits in this volume are recorded as well as the corresponding time. The hit nearest to the sense wire is taken to determine the drift time using a drift time to distance relation. In addition the drift time is smeared using a resolution function. The time information of the RPC hits in planes contributing to the trigger are used to generate a trigger time. The signal propagation delays in all corresponding cables and in the RPC strips are taken into account for a realistic simulation of the trigger time delay. The resulting trigger time is then subtracted from the time of the drift tube hit and this difference is used as an offset for the drift time. Thus trigger effects and the time of flight between the trigger planes and the drift tubes are properly accounted for. Also the signal propagation delay on the drift tube wires and the signal cables is taken into account. In the simulation, the single tube efficiency is set to 99 %. If no trigger is generated in a super-module, no drift tube data is saved for this super-module. The time to distance relation, the resolution function and the single tube efficiency have been determined using a test setup outside the LNGS, with the same operational parameters as used onsite. Detector alignment is performed during dedicated cosmic ray runs without magnetic field. In situ, performances are monitored using cosmic ray data.
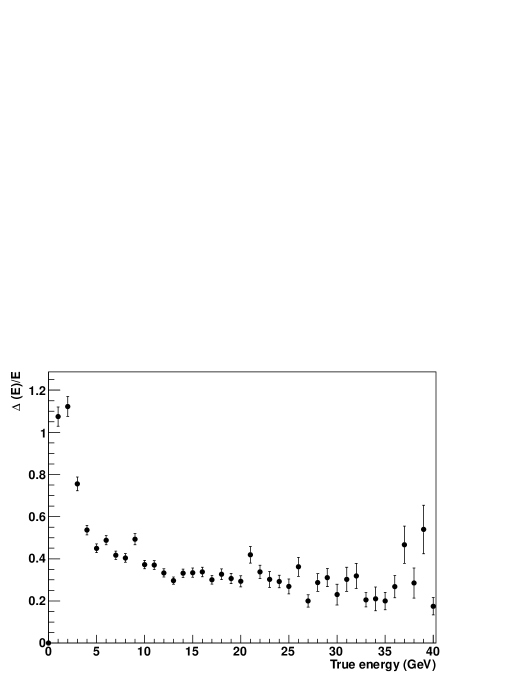
A.3 Simulation of the TT
When a particle is tracked through the volume occupied by a TT scintillator strip, the energy deposited and the time are recorded. A corresponding light signal is generated, and the attenuation and the delay in the propagation through the strip via the WLS fibre up to the corresponding photomultiplier channel is computed. The signal is converted into a number of p.e. With the chosen threshold (1/3 of p.e.), the mean detection efficiency for a minimum ionising particle crossing the strip in the middle is higher than 99 %. To make the detector description as realistic as possible the cross talk has also been included, i.e. the possibility that the signal deposited in one TT strip is recorded on a neighbouring photomultiplier channel. Calibrations are periodically performed and efficiencies, obtained from neutrino interaction data or cosmic ray data, are compared to the MC simulation. Using MC data, it is then possible to correlate the visible energy in the TT with the incoming neutrino energy. In the presence of an energy leakage from the TT into the spectrometer, the RPC data are also explicitly taken into account by the algorithm. The energy resolution reached is shown in figure 13.
References
- [1] OPERA collaboration, M. Guler et al., “An appearance experiment to search for oscillations in the CNGS beam: experimental proposal”, CERN-SPSC-2000-028.
-
[2]
The CERN Neutrino beam to Gran Sasso
(Conceptual Technical Design), Ed. K. Elsener, CERN 98-02,
INFN/AE-98/05;
CNGS project: http://proj-cngs.web.cern.ch/proj-cngs/ - [3] OPERA collaboration, N. Agafonova et al., Phys. Lett. B 691, 138 (2010).
- [4] OPERA collaboration, R. Acquafredda et al., 2009 JINST 4 P04018.
- [5] OPERA collaboration, R. Acquafredda et al., New. J. Phys. 8 (2006) 303.
- [6] OPERA collaboration, A. Anokhina et al., JINST 3 (2008) P07005.
- [7] K. Nakamura et al., J. Phys. G 37, 075021 (2010).
- [8] CERN - SL DIVISION, A.E. Ball et al., “CNGS: Update on secondary beam layout”, SL-Note-2000-063 EA.
- [9] D. Autiero, Nucl. Phys. Proc. Suppl. 139, 253 (2005).
- [10] NOMAD Collaboration, J. Altegoer et al., Nucl. Instrum. Meth. A 404, 96 (1998).
- [11] BOREXINO Collaboration, G. Alimonti et al., Astropart. Phys. 16, 205 (2002).
-
[12]
R. Brun et al., GEANT3,
Technical Report CERN-DD/EE/84-1, CERN, 1987;
CERN Program Library Long Writeup W5013;
http://wwwasd.web.cern.ch/wwwasd/geant/ - [13] J. Marteau for the OPERA Collaboration, Nucl. Instrum. Meth. A 617, 291 (2010).
- [14] OPERA collaboration, N. Agafonova et al., Eur. Phys. J. C 67 (2010) 25.
- [15] A. Bertolin and N.T.Tran, “OpCarac: an algorithm for the classification of the neutrino interactions recorded by OPERA”, OPERA public note 100, (August 2009).
- [16] C. Jollet and A. Meregaglia, “Muon identification and matching between the electronic detectors and the emulsions in OPERA”, OPERA public note 101, (September 2009).
-
[17]
R. Fruhwirth,
Nucl. Instrum. Meth. A 262, 444 (1987);
P. Billoir, Nucl. Instrum. Meth. A 225, 352 (1984). - [18] T. Adam et al., Nucl. Instrum. Meth. A 577, 523 (2007).
- [19] H. C. Fesefeldt, Technical Report PITHA 85-02 (1985).
- [20] G. Battistoni, et al., “The FLUKA code: Description and benchmarking”, AIP Conference Proceeding 896, 31-49, (2007).