A Constant Molecular Gas Depletion Time in Nearby Disk Galaxies
Abstract
We combine new sensitive, wide-field CO data from the HERACLES survey with ultraviolet and infrared data from GALEX and Spitzer to compare the surface densities of H2, , and the recent star formation rate, , over many thousands of positions in 30 nearby disk galaxies. We more than quadruple the size of the galaxy sample compared to previous work and include targets with a wide range of galaxy properties. Even though the disk galaxies in this study span a wide range of properties, we find a strong, and approximately linear correlation between and at our common resolution of 1 kpc. This implies a roughly constant median H2 consumption time, , of Gyr (including heavy elements) across our sample. At 1 kpc resolution, there is only a weak correlation between and over the range – M⊙ pc-2, which is probed by our data. We compile a broad set of literature measurements that have been obtained using a variety of star formation tracers, sampling schemes and physical scales and show that overall, these data yield almost exactly the same results, although with more scatter. We interpret these results as strong, albeit indirect evidence that star formation proceeds in a uniform way in giant molecular clouds in the disks of spiral galaxies.
Subject headings:
galaxies: evolution — galaxies: ISM — radio lines: galaxies — stars: formation1. Introduction
Giant molecular clouds (GMCs) are the sites of star formation in the Milky Way (e.g., Blitz, 1993). Therefore, it is not surprising that a strong correlation is observed between tracers of molecular gas and recent star formation (e.g., Rownd & Young, 1999; Wong & Blitz, 2002; Leroy et al., 2008; Bigiel et al., 2008), while the correlation between atomic gas and recent star formation is found to be weak or absent within galaxies (e.g., Kennicutt et al., 2007; Bigiel et al., 2008). The details of this correlation have important implications. Its evolution over cosmic time informs our understanding of galaxy assembly (Daddi et al., 2010; Genzel et al., 2010). The finding of short molecular gas consumption times compared to galaxy lifetimes highlights the importance of fueling the inner disks of galaxies. The relatively low efficiency of star formation per dynamical time requires that the star formation process be more complex than simple gravitational collapse (e.g., McKee & Ostriker, 2007). Finally, the relationship between star formation and molecular gas is an important input and benchmark for models attempting to reproduce today’s galaxies or galaxy populations.
The importance of this topic has led to several studies of the relationship between surface densities of H2 and the star formation rate. Many of these focus on single galaxies (e.g., Heyer et al., 2004; Kennicutt et al., 2007; Schuster et al., 2007; Blanc et al., 2009; Verley et al., 2010; Rahman et al., 2010) or a small sample (e.g., Wong & Blitz, 2002; Leroy et al., 2008; Bigiel et al., 2008; Wilson et al., 2009; Warren et al., 2010). Restricted by the availability of sensitive and wide-field molecular gas maps, studies of large sets of galaxies (e.g., Young et al., 1996; Kennicutt, 1998; Rownd & Young, 1999; Murgia et al., 2002; Leroy et al., 2005) mostly used integrated measurements or a few pointings per galaxy. To date, no homogeneous analysis of the correlation between the star formation rate and H2 surface densities in a large set of nearby galaxies at good spatial resolution exists.
In this letter we take this next logical step, comparing molecular gas — traced by CO emission — to recent star formation — traced by ultraviolet and infrared emission — at kpc resolution across a large sample of 30 nearby galaxies. This sample is significantly larger and more diverse than that of Bigiel et al. (2008, hereafter B08). From 2007-2010, the HERA CO-Line Extragalactic Survey (HERACLES, first maps are presented in Leroy et al., 2009) collaboration used the IRAM 30-m telescope111IRAM is supported by CNRS/INSU (France), the MPG (Germany) and the IGN (Spain). to construct maps of CO emission from 48 nearby galaxies. Because the targets overlap surveys by Spitzer (mostly SINGS, Kennicutt et al., 2003) and GALEX (mostly the NGS, Gil de Paz et al., 2007), excellent multiwavelength data are available for most targets.
2. Method
We study all galaxies meeting the following criteria: 1) a HERACLES map containing a robust CO detection, 2) GALEX far UV (FUV) and Spitzer infrared data at 24m (IR), and 3) an inclination . The first condition excludes low mass galaxies without CO detections. The second removes a few targets with poor Spitzer 24m data. The third disqualifies a handful of edge-on galaxies. We are left with disk galaxies, listed in Table 1 along with distances adopted from Walter et al. (2008), LEDA, and NED. This sample is more than four times larger than that of B08 and spans a substantial range in metallicities ()222Metallicities are adopted from Moustakas et al. (2010) where available and supplemented by data from the compilations in Calzetti et al. (2010) and Marble et al. (2010). and mass ()333Stellar masses are estimated using the near IR luminosities from Dale et al. (2007, 2009) and the mass-to-light ratio from Leroy et al. (2008)..
| Galaxy | Galaxy | ||
|---|---|---|---|
| [Mpc] | [Mpc] | ||
| NGC 0337ddToo distant to reach 1 kpc resolution, included in the 1 kpc plots at their respective native resolution. | 24.7 | NGC 4254ddToo distant to reach 1 kpc resolution, included in the 1 kpc plots at their respective native resolution. | 20.0 |
| NGC 0628B08B08Target from B08. | 7.3 | NGC 4321 | 14.3 |
| NGC 0925 | 9.2 | NGC 4536 | 14.5 |
| NGC 2403 | 3.2 | NGC 4559 | 7.0 |
| NGC 2841 | 14.1 | NGC 4569ddToo distant to reach 1 kpc resolution, included in the 1 kpc plots at their respective native resolution. | 20.0 |
| NGC 2903 | 8.9 | NGC 4579ddToo distant to reach 1 kpc resolution, included in the 1 kpc plots at their respective native resolution. | 20.6 |
| NGC 2976 | 3.6 | NGC 4625 | 9.5 |
| NGC 3049 | 8.9 | NGC 4725 | 9.3 |
| NGC 3184B08B08Target from B08. | 11.1 | NGC 4736B08B08Target from B08. | 4.7 |
| NGC 3198 | 13.8 | NGC 5055B08B08Target from B08. | 10.1 |
| NGC 3351 | 10.1 | NGC 5194B08B08Target from B08. | 8.0 |
| NGC 3521B08B08Target from B08. | 10.7 | NGC 5457 | 7.4 |
| NGC 3627 | 9.3 | NGC 5713ddToo distant to reach 1 kpc resolution, included in the 1 kpc plots at their respective native resolution. | 26.5 |
| NGC 3938 | 12.2 | NGC 6946B08B08Target from B08. | 5.9 |
| NGC 4214 | 2.9 | NGC 7331 | 14.7 |
We follow the approach of B08 with only a few modifications. B08 compared the first seven HERACLES maps to FUV, IR, and H emission to infer the relationship between the surface density of H2, , and the star formation rate surface density, . As in B08, we estimate from HERACLES CO emission. We assume a Galactic cm-2 (K km s-1)-1, correct for inclination, include helium in our quoted surface densities (a factor of 1.36, a difference from B08), and adopt a CO line ratio (note that B08 used a ratio of 0.8).
We estimate (inclination corrected) using a combination of FUV emission and m emission. FUV emission traces mainly photospheric emission from O and B stars, with a typical age of – Myr (Leitherer et al., 1999; Salim et al., 2007) but sensitive to populations up to 100 Myr of age. Infrared emission at 24m comes from dust mainly heated by young stars. This emission correlates closely with other signatures of recent star formation, especially H emission, and so has been used to correct optical and UV tracers for the effects of extinction (Calzetti et al., 2007; Kennicutt et al., 2007). Leroy et al. (2008) motivated this FUV–IR combination, showing that it reproduces other estimates of with accuracy down to M⊙ yr-1 kpc-2.
For 24 galaxies, we use FUV maps from the Nearby Galaxy Survey (NGS, Gil de Paz et al., 2007), for five targets from the All-sky Imaging Survey (AIS) and for one galaxy we use a map from the Medium Imaging Survey (MIS). We use maps of IR emission at 24m from the Spitzer Infrared Nearby Galaxies Survey (SINGS, Kennicutt et al., 2003) and the Local Volume Legacy Survey (LVL, Dale et al., 2009). Handling of the maps follows B08.
We convolve the IR and FUV maps to the (FWHM) resolution of the HERACLES data. Given the wide distance range of our sample, resolution corresponds to physical scales from pc to kpc. To avoid being influenced by physical resolution, we create a second set of maps at a common physical resolution of 1 kpc (FWHM), appropriate to carry out a uniform analysis. Five galaxies are too distant to reach 1 kpc resolution. We include them in our “kpc” analysis at their native resolution, 1.4 kpc on average (excluding them does not change our conclusions).
The HERACLES maps are masked to include only significant emission (Leroy et al., 2009). The exact completeness of each map in mass surface density depends on the inclination and, for fixed spatial resolution, the distance of the target. A typical noise level is mK per 5.2 km s-1 channel at resolution. For the most distant, face-on systems this limitis K km s-1 or 5 M⊙ pc-2 for our adopted and line ratio. Closer or more inclined systems will be complete to lower .
We sample both sets of maps, one at and one at 1 kpc resolution, using a hexagonal grid spaced by one half-resolution element. We keep only sampling points inside the -band 25th magnitude isophotal radius, , and where the HERACLES mask includes emission. At resolution, this yields and estimates for a total of points ( independent measurements) in 30 nearby star-forming galaxies. At kpc resolution, this number drops to ( independent) measurements.
3. Results
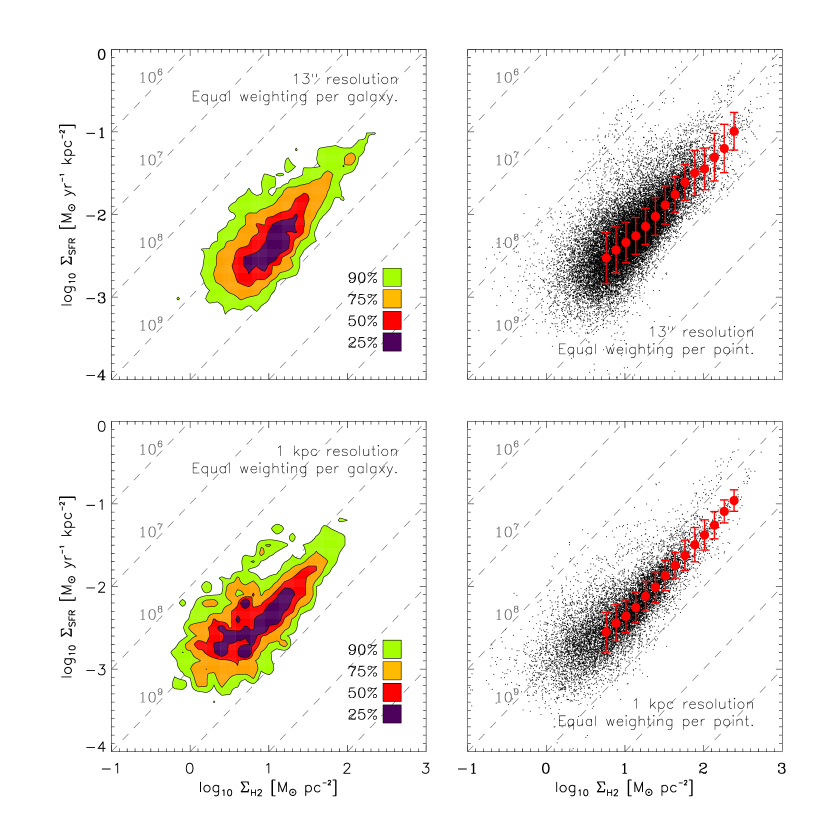
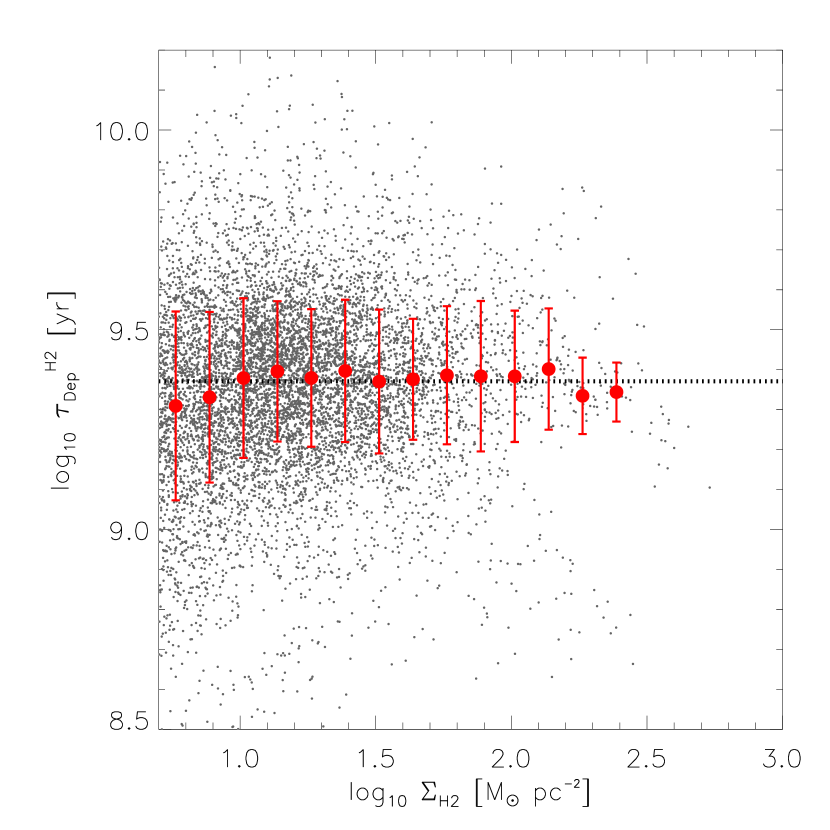
Figure 1 shows our data in - space. The upper panels present measurements at a common angular resolution of , the lower panels show results for a common physical scale of 1 kpc. The left panels show contours indicating the density of data with each galaxy weighted equally. The right panels directly show each data point. Dotted lines in each plot indicate constant molecular gas depletion times, , i.e., fixed ratios of H2-to-SFR.
To make the contour plots, we divide the - space into 0.1 dex-wide cells to grid the data. During gridding, we assign each data point a weight inversely proportional to the number of data points for the galaxy that it was drawn from. This assigns the same total weight to each galaxy, ensuring that a few large galaxies do not drive the overall distribution. Contours indicate the density of sampling points in each cell.
The scatter plots on the right treat all measurements equally, which leads large galaxies to dominate the distribution. While the contour plots treat a galaxy as the fundamental unit, the scatter plots treat each region as a key independent measurement. The red points show a running median in as a function of . Though treating as an independent variable is not rigorous, this binning is a useful way to guide the eye. We only bin where M⊙ pc-2 and we are confident of being complete.
All four plots reveal a strong correlation between and . In this letter we focus our quantitative analysis on the right hand plots, which weight every measurement equally. The Spearman rank correlation coefficient across all data is at 1 kpc resolution, indicating a strong correlation between and . We find a median H2 depletion time Gyr with scatter 0.24 dex (). The results at fixed resolution are similar, median is Gyr and .
It is common to parameterize relationships between gas and star formation using power law fits. This can be problematic physically, because data from widely varying environments are often not well-described by a single power law (B08, Bigiel et al., 2010b). It is also challenging practically, because of, e.g., issues of completeness and upper limits (see Blanc et al., 2009), zero point uncertainties (compare Rahman et al., 2010) or a correct treatment of the uncertainties associated with physical parameter estimation. Bearing these caveats in mind, a rough parameterization may still be useful to the reader. If we apply a simple linear regression in log space and fit444We normalize the fit at M⊙ pc-2 following B08. the function to the binned kpc data (red points in the lower right panel of Figure 1), we find M⊙ yr-1 kpc-2 and . This is not rigorous: we have treated the observable as an independent variable and we discarded information in the process of binning. However the fit does reasonably bisect the data. We find similar results fitting the individual measurements where we are complete with varying by and varying by , depending mainly on how the fit is constructed.
The results of this fitting can be distilled to what is immediately apparent from the plot: a characteristic Gyr and a power law index close to unity, so that the data extend parallel to the dashed lines of fixed in Figure 1. The global index close to unity implies that the ratio of to does not change much as a function of across our data. We quantify this by comparing to where we are complete ( M⊙ pc-2). Figure 2 plots the individual measurements along with a running median and scatter; both show little or no systematic variation of as a function of across the range studied. The rank correlation coefficient relating to is in our kpc data, i.e., the two quantities are only very weakly correlated.
These results extend those found by B08 and Leroy et al. (2008), who also found a roughly constant ratio for a smaller, less diverse sample. Based on detailed studies of Local Group galaxies (e.g. Blitz et al., 2007; Bolatto et al., 2008; Bigiel et al., 2010a; Fukui & Kawamura, 2010), they speculated that the approximately linear - relation arises because star formation in disk galaxies takes place in a relatively uniform population of GMCs. Given typical GMC masses of – M⊙ and sizes of pc, each of our resolution elements likely averages over at least a few — and often many — GMCs. Thus, in this scenario the relationship between and reduces to a counting exercise: corresponds to a different number of GMCs inside different resolution elements, rather than to changing physical conditions in the molecular gas. This also naturally explains the weak dependence of our results on spatial scale, which merely determines the number of GMCs per resolution element but leaves the average fixed constant intact (compare B08 for a detailed discussion).
This scenario does not contradict earlier results finding that depends on or : the strongest measurements of variable come from LIRGs and ULIRGs (e.g., Kennicutt, 1998; Gao & Solomon, 2004), systems with H2 surface densities significantly exceeding those studied here and where the assumption of a uniform GMC population likely breaks down. Departures are also expected on scales of individual molecular clouds, where only a small fraction of the molecular gas actively forms stars (e.g., Heiderman et al., 2010). We will show in the next section, however, that for normal disk galaxies and on scales greater than a few 100 pc our results agree remarkably well with previous measurements of .
4. Comparison to Literature Data
As described in Section 1, many studies have examined the relationship between molecular gas and star formation in nearby disk galaxies over the last decade. The emphasis on power law fits has somewhat obscured the basic question of whether these data fundamentally agree or disagree regarding which part of space is occupied by local disk galaxies. To address this point, Figure 3 shows our binned data (big points with error bars) along with a wide compilation of recent measurements.
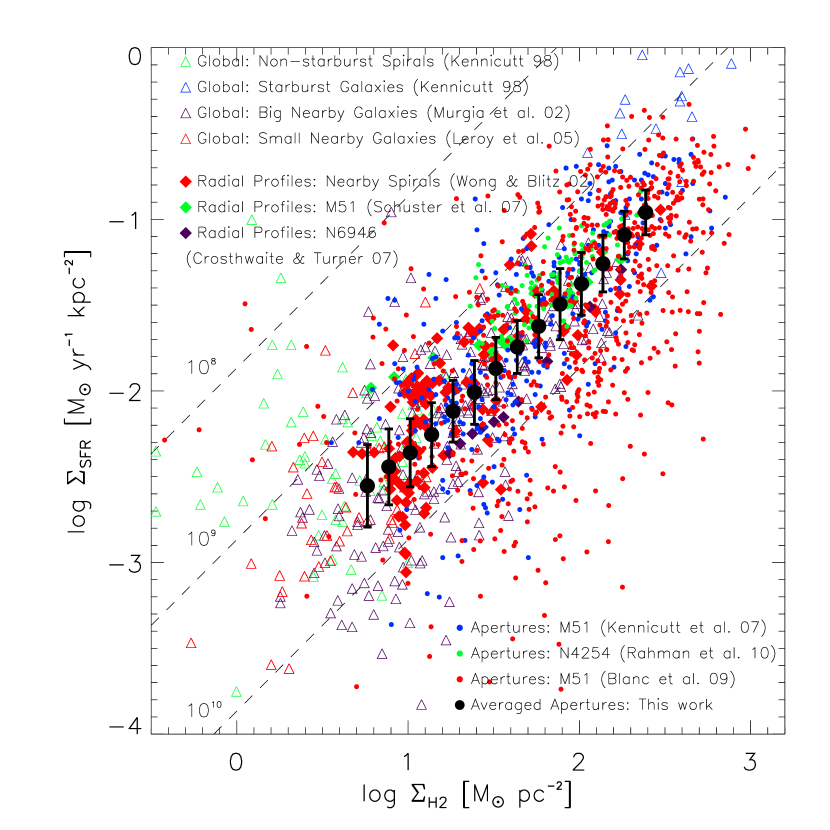
We adjust all literature measurements to share our adopted and stellar IMF (Kroupa), but otherwise leave the data unchanged. These points therefore reflect a wide range of star formation tracers, sampling schemes and physical scales.
We plot averages over whole galaxies as triangles. These include 57 normal spiral galaxies (green) and 15 starburst galaxies (blue) from Kennicutt (1998). Kennicutt (1998) estimates from H for normal spirals and IR emission for starbursts. We also show 236 pointings towards spirals from Murgia et al. (2002, purple) and towards 80 small nearby spirals and dwarfs from Leroy et al. (2005, red)555These studies compile measurements from Young et al. (1995), Taylor et al. (1998), Elfhag et al. (1996), and Böker et al. (2003).. Both data sets have resolution, corresponding to – kpc, and use 1.4 GHz radio continuum (RC) emission to estimate .
Filled diamonds indicate radial profile measurements. Data for 7 nearby spirals from Wong & Blitz (2002) are shown in red, those for M51 from Schuster et al. (2007) in green and those for NGC 6946 from Crosthwaite & Turner (2007) in purple. Wong & Blitz (2002) derive from H emission, Schuster et al. (2007) from RC emission, and Crosthwaite & Turner (2007) from FIR emission.
Small points represent aperture data. Blue points show 520 pc-sized aperture measurements from Kennicutt et al. (2007) of star forming regions in the spiral arms of NGC 5194 (M51). They infer from a combination of H and 24 µm emission. Green points show 500 pc apertures from Rahman et al. (2010), who sample mainly the spiral arms of NGC 4254. The points shown here reflect as derived from FUV and 24 µm emission. Red points indicate 170 pc apertures covering the central kpc2 of NGC 5194 (M51) from Blanc et al. (2009). They infer from extinction corrected H emission using integral field unit observations. The left panel of Figure 3 labels these various studies and overplots our data.
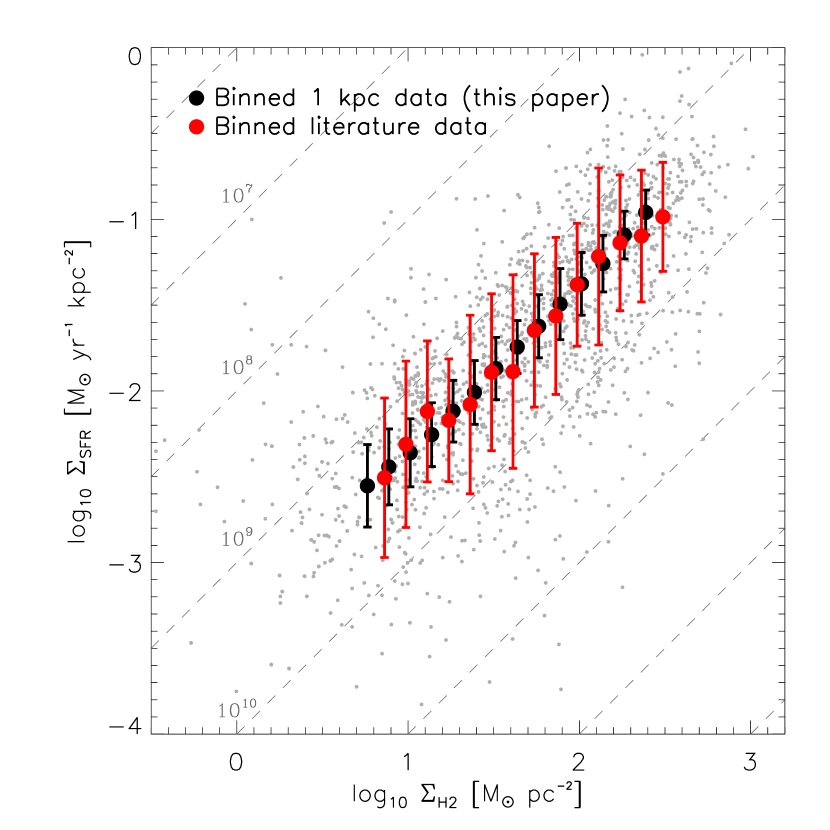
Figure 3 shows that these measurements sweep out a distinct part of – space. Most data scatter between and yr and our measurements lie near the center of the distribution. The right panel in Figure 3 shows this most clearly: we take the simplistic approach of treating all of the literature data equally (shown as gray points) and construct the same running median that we use on our own data. The literature average (red points) agrees strikingly well with our measurements (black points). This implies that our results are robust with respect to the choice of tracers or experimental setup. The literature sample as a whole also suggests that Gyr in nearby disks and that is a fairly weak function of .
5. Summary
Using new IRAM 30m CO maps from the HERACLES survey, we determine the relation between H2 surface density, , and SFR surface density, , in 30 nearby disk galaxies. This significantly extends the number of galaxies (by more than a factor of four) and the range of galaxy properties probed compared to Bigiel et al. (2008). We present our main results for a common physical resolution of 1 kpc. We find a remarkably constant molecular gas consumption time Gyr (including helium) with a 1 scatter of 0.24 dex () and little dependence of on over the range – M⊙ pc-2.
This extends and reinforces the conclusions of Bigiel et al. (2008) and Leroy et al. (2008) that the star formation rate per unit H2 in the disks of massive star-forming galaxies is, to first order, constant. We interpret this as strong, yet indirect, evidence that the disks of nearby spiral galaxies are populated by GMCs forming stars in a relatively uniform manner. We caution that these results are specific to disk galaxies and scales on which we average over many GMCs — they may be expected to break down at very high surface densities and on small scales. Taken as a whole, a broad compilation of literature data on disk galaxies from the last decade yields impressively similar results.
References
- Bigiel et al. (2008) Bigiel, F., Leroy, A., Walter, F., Brinks, E., de Blok, W. J. G., Madore, B., & Thornley, M. D. 2008, AJ, 136, 2846
- Bigiel et al. (2010a) Bigiel, F., Bolatto, A., Leroy, A., Blitz, L., Walter, F., Rosolowsky, E., Lopez, L., & Plambeck, R. 2010a, ApJ, 725, 1159
- Bigiel et al. (2010b) Bigiel, F., Leroy, A., Walter, F., Blitz, L., Brinks, E., de Blok, W. J. G., & Madore, B. 2010b, AJ, 140, 1194
- Blanc et al. (2009) Blanc, G. A., Heiderman, A., Gebhardt, K., Evans, N. J., & Adams, J. 2009, ApJ, 704, 842
- Blitz (1993) Blitz, L. 1993, in Protostars and Planets III, ed. E. H. Levy & J. I. Lunine, 125–161
- Blitz et al. (2007) Blitz, L., Fukui, Y., Kawamura, A., Leroy, A., Mizuno, N., & Rosolowsky, E. 2007, in Protostars and Planets V, ed. B. Reipurth, D. Jewitt, & K. Keil, 81–96
- Böker et al. (2003) Böker, T., Lisenfeld, U., & Schinnerer, E. 2003, A&A, 406, 87
- Bolatto et al. (2008) Bolatto, A. D., Leroy, A. K., Rosolowsky, E., Walter, F., & Blitz, L. 2008, ApJ, 686, 948
- Calzetti et al. (2007) Calzetti, D., et al. 2007, ApJ, 666, 870
- Calzetti et al. (2010) Calzetti, D., et al. 2010, ApJ, 714, 1256
- Crosthwaite & Turner (2007) Crosthwaite, L. P., & Turner, J. L. 2007, AJ, 134, 1827
- Daddi et al. (2010) Daddi, E., et al. 2010, ApJ, 714, L118
- Dale et al. (2007) Dale, D. A., et al. 2007, ApJ, 655, 863
- Dale et al. (2009) Dale, D. A., et al. 2009, ApJ, 703, 517
- Elfhag et al. (1996) Elfhag, T., Booth, R. S., Hoeglund, B., Johansson, L. E. B., & Sandqvist, A. 1996, A&AS, 115, 439
- Fukui & Kawamura (2010) Fukui, Y., & Kawamura, A. 2010, ARA&A, 48, 547
- Gao & Solomon (2004) Gao, Y., & Solomon, P. M. 2004, ApJ, 606, 271
- Genzel et al. (2010) Genzel, R., et al. 2010, MNRAS, 407, 2091
- Gil de Paz et al. (2007) Gil de Paz, A., et al. 2007, ApJS, 173, 185
- Heiderman et al. (2010) Heiderman, A., Evans, N. J., II, Allen, L. E., Huard, T., & Heyer, M. 2010, ApJ, 723, 1019
- Heyer et al. (2004) Heyer, M. H., Corbelli, E., Schneider, S. E., & Young, J. S. 2004, ApJ, 602, 723
- Kennicutt (1998) Kennicutt, Jr., R. C. 1998, ApJ, 498, 541
- Kennicutt et al. (2003) Kennicutt, Jr., R. C., et al. 2003, PASP, 115, 928
- Kennicutt et al. (2007) Kennicutt, Jr., R. C., et al. 2007, ApJ, 671, 333
- Leitherer et al. (1999) Leitherer, C., et al. 1999, ApJS, 123, 3
- Leroy et al. (2005) Leroy, A., Bolatto, A. D., Simon, J. D., & Blitz, L. 2005, ApJ, 625, 763
- Leroy et al. (2008) Leroy, A. K., Walter, F., Brinks, E., Bigiel, F., de Blok, W. J. G., Madore, B., & Thornley, M. D. 2008, AJ, 136, 2782
- Leroy et al. (2009) Leroy, A. K., et al. 2009, ApJ, 702, 352
- Marble et al. (2010) Marble, A. R., et al. 2010, ApJ, 715, 506
- McKee & Ostriker (2007) McKee, C. F., & Ostriker, E. C. 2007, ARA&A, 45, 565
- Moustakas et al. (2010) Moustakas, J., Kennicutt, R. C., Jr., Tremonti, C. A., Dale, D. A., Smith, J.-D. T., & Calzetti, D. 2010, ApJS, 190, 233
- Murgia et al. (2002) Murgia, M., Crapsi, A., Moscadelli, L., & Gregorini, L. 2002, A&A, 385, 412
- Rahman et al. (2010) Rahman, N., et al. 2010, ApJ, in press, arXiv:1009.3272
- Rownd & Young (1999) Rownd, B. K., & Young, J. S. 1999, AJ, 118, 670
- Salim et al. (2007) Salim, S., et al. 2007, ApJS, 173, 267
- Schuster et al. (2007) Schuster, K. F., Kramer, C., Hitschfeld, M., Garćıa-Burillo, S., & Mookerjea, B. 2007, A&A, 461, 143
- Taylor et al. (1998) Taylor, C. L., Kobulnicky, H. A., & Skillman, E. D. 1998, AJ, 116, 2746
- Verley et al. (2010) Verley, S., Corbelli, E., Giovanardi, C., & Hunt, L. K. 2010, A&A, 510, A64
- Walter et al. (2008) Walter, F., Brinks, E., de Blok, W. J. G., Bigiel, F., Kennicutt, R. C., Thornley, M. D., & Leroy, A. 2008, AJ, 136, 2563
- Warren et al. (2010) Warren, B. E., et al. 2010, ApJ, 714, 571
- Wilson et al. (2009) Wilson, C. D., et al. 2009, ApJ, 693, 1736
- Wong & Blitz (2002) Wong, T., & Blitz, L. 2002, ApJ, 569, 157
- Young et al. (1995) Young, J. S., et al. 1995, ApJS, 98, 219
- Young et al. (1996) Young, J. S., Allen, L., Kenney, J. D. P., Lesser, A., & Rownd, B. 1996, AJ, 112, 1903