11email: veronique.buat@oamp.fr,elodie.giovannoli@oamp.fr, sebastien.heinis@oamp.fr, denis.burgarella@oamp.fr 22institutetext: Institute for Advanced Research, Nagoya University, Furo-cho, Chikusa-ku, Nagoya 464–8601, Japan
22email: takeuchi@iar.nagoya-u.ac.jp 33institutetext: Division of Particle and Astrophysical Sciences, Nagoya University, Furo-cho, Chikusa-ku, Nagoya 464–8602, Japan
33email: yuan.fangting@g.mbox.nagoya-u.ac.jp 44institutetext: Institut für Astro- und Teilchenphysik, Universität Innsbruck, Technikerstr.25/8, 6020 Innsbruck, Austria
44email: Stefan.Noll@uibk.ac.at 55institutetext: Instituto de Astrofísica de Andalucía, Glorieta de la Astronomía, 18008 Granada, Spain 66institutetext: Centro Astronómico Hispano Alemán, C/ Jesús Durbán Remón 2-2, 04004 Almería, Spain
66email: jiglesia@iaa.es
Spectral energy distributions of an AKARI-SDSS-GALEX sample of galaxies
Abstract
Context. The nearby universe remains the best laboratory to understand the physical properties of galaxies and is a reference for any comparison with high redshift observations. The all sky (or very large) surveys that have been performed from the ultraviolet (UV) to the far-infrared (far-IR) provide us with large datasets of very large wavelength coverage to perform a reference study.
Aims. We investigate the dust attenuation characteristics, as well as the star formation rate (SFR) calibrations of a sample of nearby galaxies observed over 13 bands from 0.15 to 160 m.
Methods. A sample of 363 galaxies is built from the AKARI /FIS all sky survey cross-correlated with SDSS and GALEX surveys. Broad band spectral energy distributions are fitted with the CIGALE code optimized to analyse variations in dust attenuation curves and SFR measurements and based on an energetic budget between the stellar and dust emission.
Results. Our galaxy sample is primarily selected in far-IR and mostly constituted of massive, actively star-forming galaxies. There is some evidence for a dust attenuation law that is slightly steeper than that used for starburst galaxies but we are unable to constrain the presence or not of a bump at 220 nm. We confirm that a time-dependent dust attenuation is necessary to perform the best fits. Various calibrations of the dust attenuation in the UV as a function of UV-optical colours are discussed. A calibration of the current SFR combining UV and total IR emissions is proposed with an accurate estimate of dust heating by old stars. For the whole sample, 17 of the total dust luminosity is unrelated to the recent star formation.
Key Words.:
galaxies: star formation-(ISM:) dust, extinction-infrared: galaxies-ultraviolet: galaxies1 Introduction
The broad-band spectral energy distribution (SED) of a galaxy represents the combination of the emission from both stars of all ages and interstellar dust that interact in a complex way by means of the absorption and scattering of the stellar light by dust grains. The stars emit from the UV to the near-IR whereas the mid and far-IR emission comes from interstellar dust heated by the stellar emission.
The broad-band SEDs can be reconstructed from a library of stellar tracks by assuming a star formation history, an initial mass function, and a scenario for dust attenuation to reproduce the observed UV-optical distribution and the re-emitted emission in mid and far-IR.
By comparing data with models, one can attempt to derive some physical parameters related to the star formation history and dust attenuation in a homogeneous way and simultaneously for all galaxies of a given sample. Practically the current star formation rate (SFR), the stellar mass, and the amount of dust attenuation are commonly derived from broad-band photometry (e.g. Salim et al., 2007; da Cunha et al., 2008; Walcher et al., 2008, 2010, and references therein). Without spectral information and given the high degree of degeneracy in the SEDs, details about the star formation history such as stellar population ages, or specific aspects of dust attenuation such as its wavelength dependence, are more difficult to constrain (e.g. Walcher et al., 2010; Noll et
al., 2009b) .
With the availability of mid and far-IR data for large samples of galaxies, codes that combine stellar and dust emission to analyse SEDs are particularly useful.
The standard approach consists of solving the radiation transfer in model galaxies to build self-consistent SEDs from the UV to the far-IR (e.g. Popescu et al., 2000; Silva et al., 1998; Tuffs et al., 2004). These sophisticated models require complex calculations and are not directly applicable to large samples of galaxies. Libraries of templates can be produced (Iglesias-Páramo et al., 2007; Popescu et al., 2010), as well as some recipes (Tuffs et al., 2004), but the various free parameters and physical assumptions are difficult to constrain with only broad-band, integrated fluxes. Another tool applicable to large samples of galaxies consists of models based on a simple energetic budget where the global dust emission corresponds to the difference between the emitted and observed stellar light (da Cunha et al., 2008; Noll et
al., 2009b). Codes based on synthetic stellar population modeling and simple emission properties for the dust are well suited to analysing large datasets at the expense of an over simplification of the physical processes at work in galaxies.
The natural laboratory for this SED analysis is the nearby universe for which plenty of high-quality photometric data are available.
Several studies have been based on the Spitzer Nearby Galaxies Survey (SINGS) (Kennicutt, 2003), which provided broad-band spectral energy distributions from 0.15 to 160 m for 75 galaxies (Dale et al., 2007). da Cunha et al. (2008) and Noll et
al. (2009b) illustrate the capabilities of their fitting code with this sample.
In the present work, we investigate the properties of nearby galaxies by selecting a sample of objects that is as large as possible, observed during the AKARI, SDSS, and GALEX surveys that correspond to 13 photometric bands from 0.15 to 160 m. Particular care was taken to measure total flux densities for the extended sources. Our aim is to perform SED fitting to deduce physical properties in a homogeneous and consistent way, focusing on dust attenuation and SFR measurements.
The originality of our study is to extend the wavelength coverage beyond 100 m (the longest wavelength observed by IRAS) so that we consider only galaxies with a reliable flux at 140 m: our selection is close to a selection at 140 m and consists of 363 unresolved objects with a very large wavelength coverage and secure measurements, allowing a statistical analysis. A selection at 140 m, beyond the peak of dust emission for most galaxies is particularly valuable for further comparison with distant galaxies observed in sub-mm by Herschel. It is also the first application of our code CIGALE to a large sample of nearby galaxies with such a wavelength coverage.
In section 3, we describe the SED fitting method, the reliability of its results derived by the analysing a mock catalogue and the specific results obtained for our galaxy sample. Section 4 is devoted to the analysis of dust attenuation characteristics and section 5 to SFR calibrations. The conclusion is presented in section 6. All magnitudes are given in AB system. We assume that , , and .
2 Data
| Survey | Band | Wavelength | Nb of sources |
|---|---|---|---|
| GALEX | FUV | 153 nm | 363 |
| GALEX | NUV | 231 nm | 363 |
| SDSS | u,g,r,i,z | 355, 469, 617, 748, 893 nm | 363 |
| AKARI/FIS∗ | N60 | 65 m | 129 |
| AKARI/FIS∗ | WIDE-S | 90 m | 357 |
| IRAS | Band-3 | 60 m | 359 |
| IRAS | Band-4 | 100 m | 354 |
| AKARI/FIS | WIDE-L | 140 m | 363 |
| AKARI/FIS | N160 | 160 m | 111 |
| Parameters | Symbol | Range |
| Star formation history | ||
| metallicities (solar metallicity) | 0.02 | |
| of old stellar population models in Gyr | 1; 3.0; 5.0; 10.0 | |
| ages of old stellar population models in Gyr | 13 | |
| ages of young stellar population models in Gyr | 0.025; 0.05; 0.1 ;0.3 ;0.5 ;1.0 | |
| fraction of young stellar population | 0.001; 0.01; 0.1; 0.999 | |
| IMF | K | Kroupa |
| Dust attenuation | ||
| Slope correction of the Calzetti law | -0.3; -0.2; -0.1; 0.0; 0.1; 0.2 | |
| V-band attenuation for the young stellar population | 0.15; 0.30; 0.45; 0.60; 0.75; 0.90; 1.05; 1.20; 1.35; | |
| 1.5; 1.65; 1.8; 1.95; 2.1 | ||
| Reduction of basic for old SP model | 0.0; 0.50; 1.0 | |
| IR SED | ||
| IR power-law slope | 1.0; 1.5; 1.75; 2.0; 2.25; 2.5; 4.0 |
Our aim is to build a galaxy sample with high quality fluxes from the UV to the far-IR. The present sample is built from the primary sample of Takeuchi et al. (2010). It consists of galaxies observed as part of the AKARI/FIS all sky survey (Kawada et al., 2007) and restricted to the area covered by SDSS/DR7 (Abazajian et al., 2009) and the GALEX All Imaging Survey (Martin et al., 2005) for an additional cross-match. Takeuchi et al. (2010) cross-matched the first primary catalogue of the AKARI/FIS All Sky Survey (-1 version) with the IRAS/PSCz (Saunders et al., 2000) to select 776 sources confirmed as galaxies, with a known redshift and observed with GALEX. For 607 of these 776 sources, SDSS images are suitable for performing accurate photometry (no bright star superposed). We refer to Takeuchi et al. (2010) for details of the sample selection and photometric measurements. Briefly, specific aperture photometry was performed for each source in the GALEX and SDSS images at the positions to avoid shredding. Total flux densities were measured in elliptical apertures on the images using the method described in Iglesias-Páramo et al. (2007). When sources were shredded in the SDSS images during the deblending step of the pipeline (most of the cases), we used the photometry of the parent object measured before deblending within the Petrosian radius. The errors due to the photometric measurements at UV and optical wavelengths were measured and are of the order of .
We collect the fluxes from the AKARI/FIS All-Sky Survey Bright Source Catalogue Version 1.0 (Yamamura et al., 2010), whose errors are smaller than those of the -1 version used in Takeuchi et
al. (2010). We restrict the sample to galaxies whose 140 m flux is of high quality (FQUAL140=3), 363 sources fulfiling this condition. We find that most of selected sources (357 sources) also have high quality fluxes at 90 m but the fraction of these sources with reliable fluxes at 65 and 160 m is about .The fluxes uncertainties are estimated to be as quoted in the AKARI/FIS All-Sky Survey Bright Source Catalogue. All the 363 sources were detected by and in all SDSS bands.
In Table 1, we gather the number of sources with high quality fluxes at each wavelength of interest, the sample used for our SED analysis consisting of the 363 sources reliably detected at 140 m and in all the SDSS bands. Thirteen bands are considered, most galaxies being detected in 11 of them. All the fluxes are corrected for Galactic extinction using the Schlegel et al. (1998) dust maps and the Cardelli et al. (1989) extinction curve. The redshift distribution of the sources is similar to that of the original sample of Takeuchi et
al. (2010) with a mean value
Since the detection rate at 65 m is low (129/363 sources), we prefer to consider the IRAS fluxes at 60 m available for 359 sources (we use the 60 m co-added fluxes from the PSCz and consider only sources with an IRAS quality flag equal to 3).
AKARI fluxes at 65 and 90 m are systematically lower than IRAS fluxes at 60 and 100 m, respectively (Takeuchi et
al., 2010). This discrepancy is likely to be due to the higher spatial resolution of AKARI data (pixel size 27 arcsec, FWHM of the PSF equal to 39 arcsec (Kawada et al., 2007)): the point source extraction is no longer valid for slightly extended nearby sources (Yuan et al. in preparation). Therefore, at 100 m we also consider IRAS co-added fluxes for the 354 sources safely detected by IRAS at 100 m (IRAS quality flag equal to 3), in section 3 we discuss the difference in the estimate of the total IR luminosity when using either only AKARI data or a combination of AKARI and IRAS data.
Optical diameters measured at the isophotal level B= 25 mag arcsec-2 are compiled from the HyperLeda database 111http://leda.univ1-lyon1.fr/.
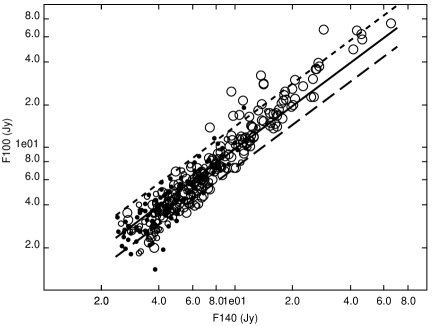
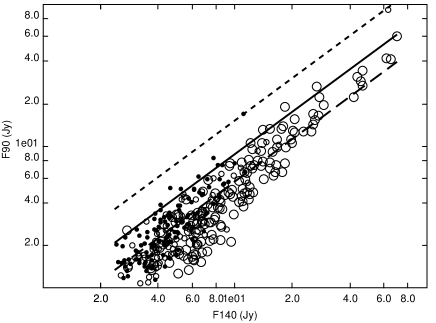
Any limitation of the spatial resolution and point source extraction are expected to be less important at 140 and 160 m than at 65 and 90 m, with a pixel size of 44 arcsec and a PSF FWHM of 58 and 61 arcsec, respectively, at 140 and 160 m (Kawada et al., 2007). In Fig 1, the 140 m fluxes are compared to the fluxes at 90 and 100 m together with the predictions of the Dale & Helou (2002) models representative of galaxies in the nearby universe (corresponding to an parameter of the Dale & Helou (2002) models between 1.5 and 2.5 as described in section 3) . Models and data at 100 m are found to be consistent without any obvious trend with the galaxy diameters whereas AKARI fluxes at 90 m appear systematically underestimated, the discrepancy increasing with the optical diameter, confirming the analysis results of Takeuchi et
al. (2010) and Yuan et al. (in preparation).
3 SED fitting
3.1 CIGALE code
An efficient way to derive physical parameters of star formation and dust attenuation homogeneously is to fit the observed SED with models from a stellar population synthesis code. We use the code CIGALE (Code Investigating GALaxy Emission) 222http://www.oamp.fr/cigale, which derives physical information about galaxies by fitting their UV-to-far-IR SED (Noll et al., 2009b; Giovannoli et al., 2010). A Bayesian analysis is used to derive galaxy properties similar to that developed by Kauffmann et al. (2003a). CIGALE combines a UV-optical stellar SED and a dust, IR-emitting component. First, models are built, then each model is quantitatively compared to the observed SEDs as we account for the uncertainties in the observed fluxes. The probability function of each parameter is calculated and the estimated value of the parameter and its error correspond to the mean and standard deviation of this distribution. Models are generated with a stellar population synthesis code, assuming a particular star formation history and dust attenuation scenario. The energetic balance between dust-enshrouded stellar emission and re-emission in the IR is carefully conserved by combining the UV-optical and IR SEDs. We refer the reader to Noll et al. (2009b) for a detailed description. Briefly, the IR SEDs are built from the Dale & Helou (2002) templates. CIGALE allows for additional dust emission from a dust-enshrouded AGN but does not include the unobscured emission of an active nucleus. Therefore, we discard five galaxies classified as Seyfert 1 by Véron-Cetty & Véron (2006). We then performed several tests after adding two AGN templates (corresponding to a PAH-free emission with respectively 32 and 64 mag of extinction from the Siebenmorgen & Krügel (2007) library) to the SED fitting (Noll et al., 2009b) and found that the AGN contribution to the total IR emission never exceeds 12 (without any difference for galaxies classified as active or not) but is very badly constrained in the absence of mid-IR data (a null contribution of the AGN component is never excluded by the Bayesian analysis).
In the following, we describe the parameters that are crucial to this study. The input parameters values used in this work are listed in Table 2 and presented in this section. They were chosen after several trials and represent a compromise between a good estimate of the parameters of interest and the duration of the SED fitting process. An over sampling of ill-constrained parameters may also reduce the accuracy of well-constrained parameters by increasing the number of models of moderate probability and consequently the dispersion in the parameter estimates. This effect was found to be moderate but real, thus there is no need to perform a rigorous sampling of all the parameters. The range of values was chosen to be large for the first tests, then reduced by excluding values never chosen during the minimization. The sampling of the parameters was then optimized in terms of computer time and parameter estimation.
3.1.1 Stellar populations and star formation histories
We adopt the stellar population synthesis models of Maraston (2005), which include a full treatment of the thermally pulsating asymptotic giant branch stars. The chosen initial mass function is that of Kroupa (2001). The metallicity is taken to be solar.
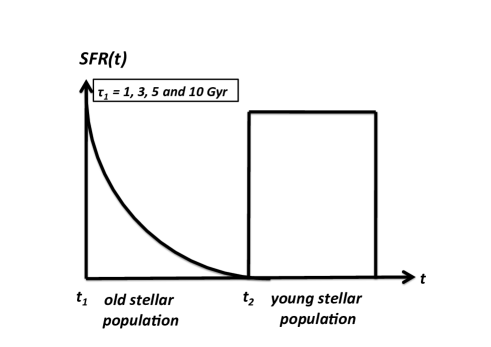
The star formation history implemented in CIGALE is the combination of two stellar components resembling an old and a young stellar populations. The two populations roughly represent a burst of star formation in addition to a more passively evolving stellar component. We verify that including these two populations improves the results of the SED fitting relative to the case where only a single exponentially decreasing star formation rate is assumed. The reality is certainly more complex but adding more components may lead to degenerate solutions. The old stellar component is modeled with an exponentially decreasing SFR (with various values of the e-folding rate ) that started 13 Gyr ago ( = 13 Gyr), the young stellar component consisting of a burst of constant star formation starting later ( Gyr ago) whose amplitude is adjustable (Fig. 2). We adopt four values of (1, 3, 5, or 10 Gyr) and is taken in the range 0.025 to 1 Gyr. The two stellar components are linked by their mass fraction, , which corresponds to the ratio of the mass locked in the young stellar population mass to the total stellar mass. The parameter varies in the range 0-1, with a logarithmic scale (linear or logarithmic variations are allowed for the input parameters). CIGALE estimates the SFR, defined as (1-)*SFR1 + *SFR2, where SFR1 and SFR2 correspond to the star formation rates of the old and young stellar populations, respectively. In the following, the SFR refers to the formula calculated for the current time.
In its newest version, CIGALE also estimates the dust-free D4000 break measured in the spectrum of the composite stellar population. The calibration used is that of Balogh et al. (1999) (see also section 3.4 for a more detailed discussion).
3.1.2 Dust attenuation and infrared emission
To model the attenuation by dust, the code uses the attenuation law of Calzetti et al. (2000) as a baseline, and offers the possibility of varying the steepness of the attenuation law and/or adding a bump centred at 220 nm (see Noll et al. (2009b) for a complete description of the dust attenuation prescription). To produce different slopes, the parameter is introduced and the original Calzetti et al. (2000) law is multiplied by with nm. We choose between -0.3 and 0.2. This range of values was chosen after several trade-offs and we exclude larger departures from the Calzetti law since these solutions were never chosen by the SED fitting process. Several tests are made to check whether we are able to constrain the presence of a UV bump with the available photometric broadbands, including the analysis of mock catalogues, described in section 3.3, and we conclude that the bump is unconstrained. Thus, we decide to only consider slope deviations provided by the parameter.
The stellar population models must be attenuated before the IR emission can be added, since the total IR luminosity is defined as the dust-absorbed luminosity of the stars.
The code allows us to consider that the old stellar population is less affected by dust attenuation than the young one as recommended by several studies (e.g. Calzetti et al., 2000; Charlot & Fall, 2000; Panuzzo et al., 2007). The primary input parameter is the dust attenuation in the V band of the young stellar population, . A reduction factor of the dust attenuation for the old stellar population (relative to the young one) is also introduced as an input parameter. The global dust attenuation for the total (young and old) stellar population is defined as the output parameter . The range of values adopted for
and are listed in Table 2. Since we are particularly interested in dust attenuation in the UV range, we also define , the dust attenuation in the FUV filter.
To fit IR observations, CIGALE uses the semi-empirical one-parameter models of Dale & Helou (2002). These 64 models are parametrized by , which relates the dust mass to heating intensity.
The parameter is directly related to /, where and are fluxes in Jy at 60 and 100 m, respectively.
We choose in the interval [1 ; 4] to cover a large domain of activity.
3.2 Reliability and distribution of the output parameters
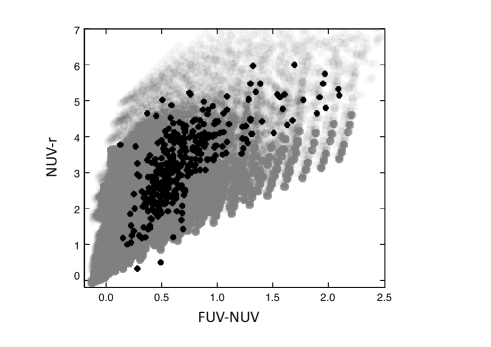
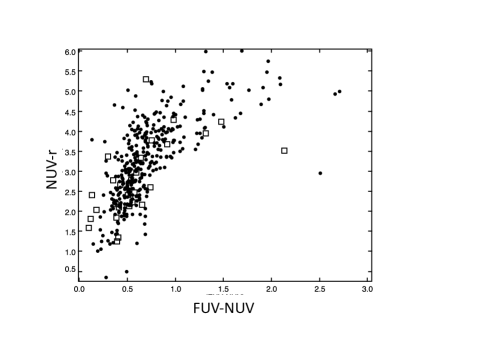
A first check of the ability of the models to reproduce the data is to compare their photometric distributions. The parameters we wish to constrain are related to the star formation history and dust attenuation characteristics that mainly affect the UV emission. Therefore, we choose to compare the distributions of the FUV-NUV and NUV-r colours, both being very sensitive to the star formation history and dust attenuation. One can see in Fig 3 that the range of the modeled colours covers the range of the observed ones confirming that the stellar populations and the dust attenuation assumed in the models clearly reproduce the observed characteristics of the sources .
The reliability of the parameter estimation is then tested by applying the method developed by Giovannoli et al. (2010), which consists of building a specific mock catalogue for each set of data to be fitted. The mock catalogue is made of artificial galaxies for which we know the flux in each photometric band of interest and the exact values of the parameters used by CIGALE.
To construct this catalogue, we follow three steps. The first step is to run the code on the data to choose the best-fit model for each object by means ot a simple minimization method. We select the 28 galaxies detected at all IR wavelengths: 60, 100, 140, and 160 m. In the second step, we add a randomly distributed error (which represents typically 10 of the flux) to each flux of the best-fit models measured in the photometric bands of the dataset:
we have a catalogue of artificial galaxies which are observed in the same filters as the real galaxies and representative of them. The representativeness of our mock catalogue is checked by comparing the colours (FUV-NUV and NUV-r) of the simulated and real galaxies (Fig 4). The last step is to run the code on these simulated data and compare the exact values of the parameters with the values estimated by the code.
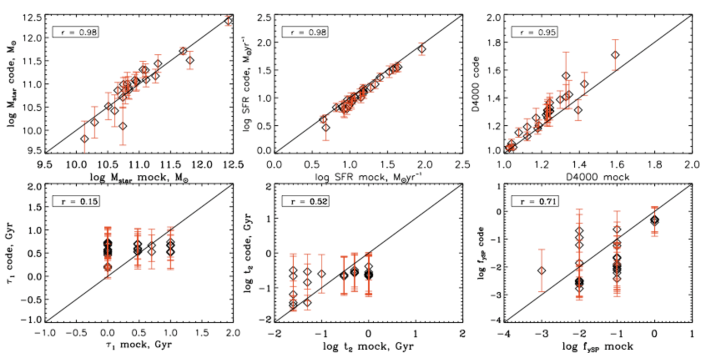
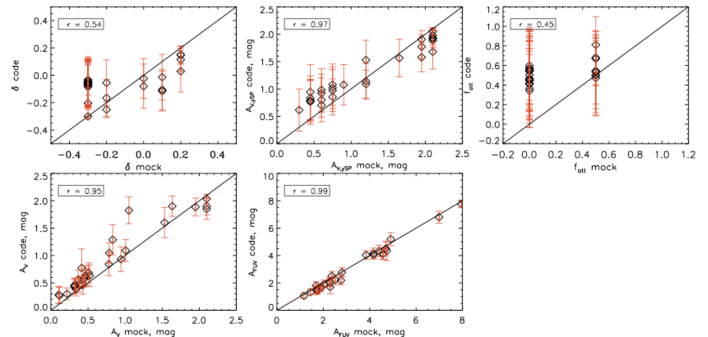
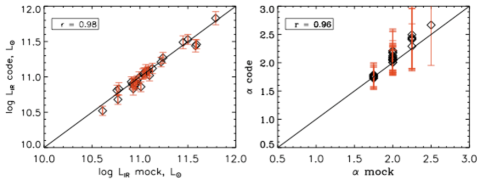
Fig 5 compares the output parameters from the Bayesian analysis for the mock galaxies considered in this work with the values estimated by the code. Values of the linear Pearson correlation coefficient (r) are also indicated in the plots.
The output parameters for the real data are all Bayesian estimates. We find very good correlations for , SFR, D4000, , , , , and with r 0.80.
The mass fraction is only poorly estimated (r = 0.71) and the estimations of , , , and are much less satisfying, with a correlation coefficient equal to 0.15, 0.52, 0.54, and 0.45 respectively.
According to this analysis which was also confirmed by that of the Bayesian error distribution (Noll et
al., 2009b), we conclude that the reliable parameters are , SFR, D4000, , , , , and . These parameters are used in the following, with some discussion about and .
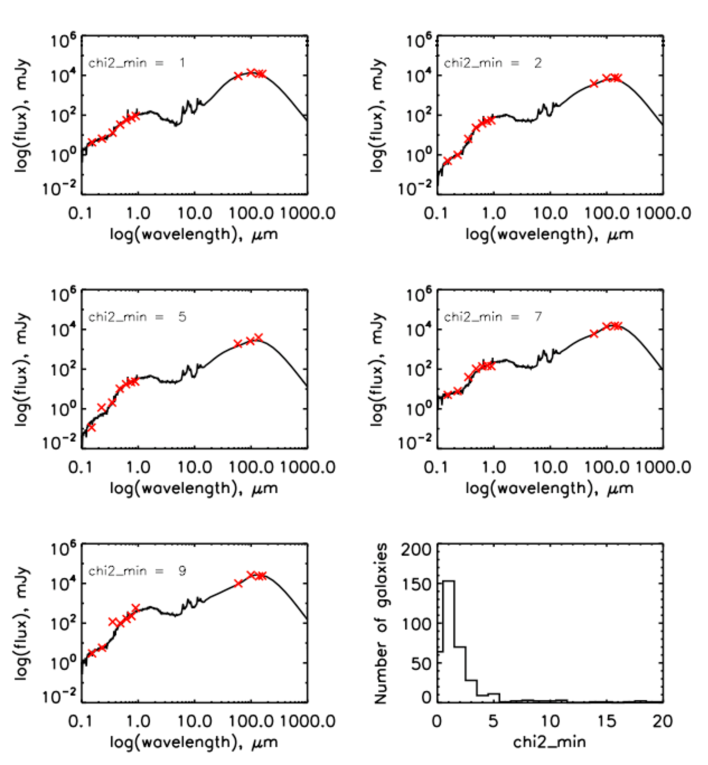
The SED fitting and the Bayesian analysis are performed on the dataset with the input parameters listed in Table 2. We restrict the analysis to objects for which minimum value of the reduced is lower than 10: 342 galaxies satisfy this criterium, the reduced distribution for the entire sample is presented in Fig 6 (last panel). The discrepant cases are likely to correspond to misidentified objects and GALEX data that are inconsistent with the other ones. Given the low number of these catastrophic cases (), we omit them from any further analysis. Some examples of best-fit models superposed on the observed fluxes are given in Fig 6.
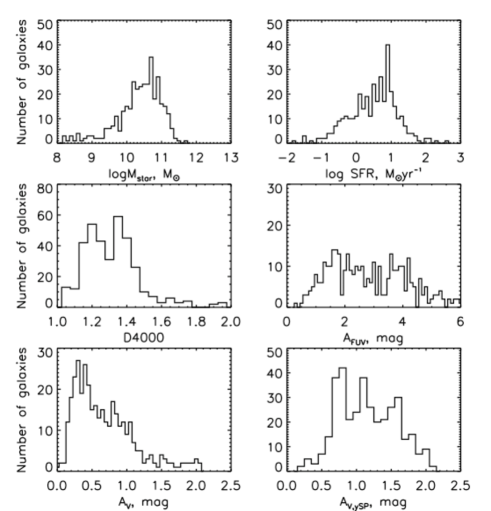
Fig. 7 shows the distributions for the parameters of interest estimated with the Bayesian analysis for the 342 objects: , SFR, D4000, , , , , , and .
Galaxies are massive with a median value of equal to M⊙.
We find that the SFR is between 0.1 and 100 with very few values higher than 30 and a median value of 4 . The galaxies are moderately luminous () as expected for a flux-limited sample of nearby galaxies.
The D4000 distribution corresponds to that of actively star-forming galaxies in the nearby universe with a median value equal to 1.3 (Kauffmann et al. (2003a) and discussion below). The parameter
spans the entire range of input values between 0.5 and 2.1 mag with a few objects above 1.25 mag. For most of the objects, 1 mag. These output parameters are discussed in more detail in the following sections.
3.3 Dust emission
3.3.1 Total infrared luminosities
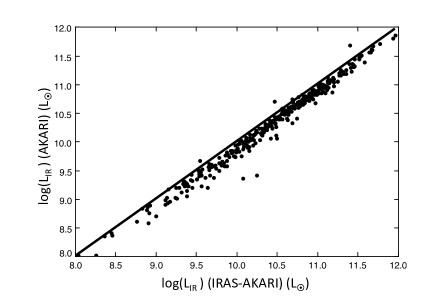
As discussed in section 2, AKARI measurements at 65 and 90 m seem to be underestimated relative to IRAS fluxes at similar wavelengths. We can compare the measure of the total IR luminosities obtained when considering the four AKARI-FIS bands or a combination of IRAS (at 60 and 100 m) and AKARI-FIS (at 140 and 160 m) data. We run CIGALE in both cases and the resulting values of are compared in Fig. 8. Both estimates correlate very well, the values obtained with the four bands being systematically lower than those obtained by combining and data by 25. In the following, we only consider the combination of IRAS and AKARI data.
3.3.2 Infrared SEDs
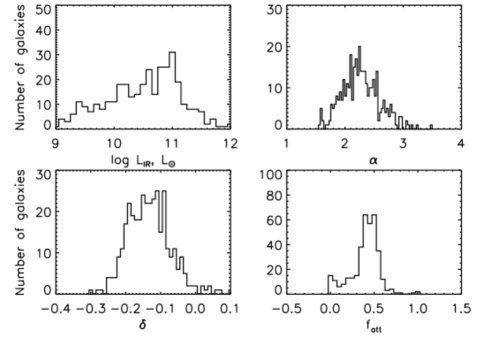
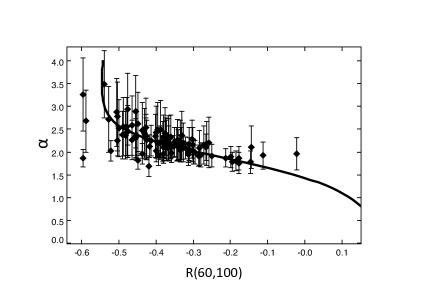
The IR dust emission is fitted using the Dale & Helou (2002) library (hereafter DH02). These models are parametrized by a value of that is directly related to R(60,100) the ratio of the fluxes at 60 to 100 m observed by IRAS. In Fig. 9, the values of obtained for galaxies observed at 60, 100, 140, and 160 m are plotted against the ratio of the IRAS fluxes at 60 to 100 m, R(60,100), and compared to the relation between and R(60,100) from the DH02 models. A very good agreement is found between values found with CIGALE and the values expected from R(60,100). The SED library of DH02 is built to clearly reproduce the far-IR (longward 100 m) and sub-mm (at 850 m) emission of local galaxies. Therefore, good agreement is expected when data longer than 100 m are introduced and the SEDs are likely to be better constrained when both data at 140 and 160 m are added. When galaxies are only observed at 60, 100, and 140 m, is found to be slightly larger ( 0.2) than predicted from R(60,100) and the DH02 relation: we can tentatively explain this trend by the high values of being likely to be ill-constrained without data at 160 m leading to a degeneration of the probability distribution and then to a slight overestimation of . In all cases the difference in the determinations remains lower than the uncertainty given by the Bayesian analysis.
3.3.3 Constraints on the dust attenuation curve
The presence of a bump at 220 nm in the attenuation curve of external galaxies is still controversial. The best way to search for the presence of this bump is to work with UV spectra. In pioneering studies, Calzetti et al. (1994) found no bump in local starburst galaxies, Burgarella et al. (2005) found some hints of a bump in one local Luminous IR Galaxy observed with GALEX, and, at higher z Noll et al. (2009a) found evidence of a bump in star-forming galaxies with . Although the NUV band of GALEX lies on the bump itself (Conroy et al., 2010), our SED fitting is unable to reliably ascertain whether a bump is present, as mentioned in section 3. We can say that the slope of the UV attenuation curve (parameter ) is more reliable although the uncertainty remains large. The number of free parameters acting on the UV emission (star formation history, various parameters of dust attenuation) are at the origin of these poor determinations as discussed by Noll et al. (2009b).
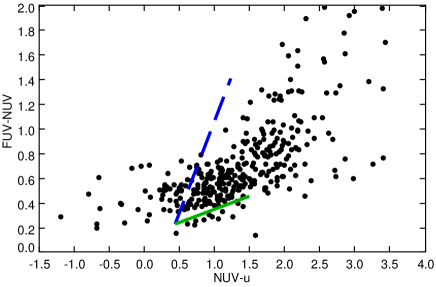
Conroy et al. (2010) adopted a more empirical approach and developed a diagnostic based on a colour analysis that clearly distinguishes models with or without a bump.
The comparison of the and colours is sensitive to the presence of the bump. Their assumption of a constant star formation rate over 13.7 Gyr considerably reduces the number of free parameters. They also assumed a steep underlying curve (by adopting a low RV) and found that their galaxies have and colours compatible with the presence of a bump with an amplitude slightly lower than for the Milky Way extinction curve.
In Fig 10, we report the colours of our galaxies with the predictions of Conroy et al. (2010) for no bump or a bump with an amplitude similar to that of the Milky Way. Our galaxies span a larger range of colours than those explored by Conroy et al. (2010) but they clearly lie between the two predicted lines, suggesting that a bump is present that has a lower amplitude than for the MW. In all cases, the analysis of the full SED of these galaxies allowing for variations in the star formation history and dust attenuation scenarios cannot reach a reliable conclusion about the presence of a bump.
The parameter quantifies the variations in the slope of the attenuation law, the reference being the starburst reddening curve of Calzetti et al. (2000). For the measurement of , the slopes of the attenuation law are found to be slightly steeper than the Calzetti law but is not well constrained with the available data (Fig 5). This illustrates the difficulty in constraining the wavelength dependence of the attenuation curve with broad-band data only. As explained in Noll et
al. (2009b), corresponds to a variation in originally equal to 4.05 for the Calzetti et al. law: corresponds to .
3.4 Age and mass of the stellar component
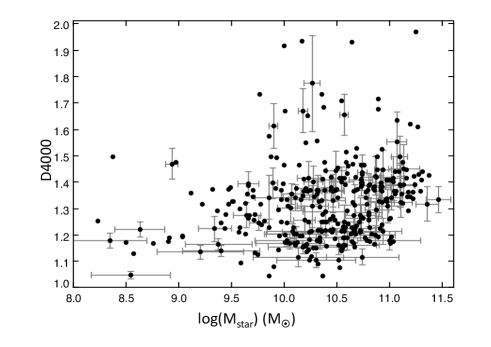
The 4000 break (hereafter D4000) provides information on the age of the stellar populations. It is small for young stellar populations and large for old galaxies (Kauffmann et al., 2003a). The D4000 definition adopted here is that of Balogh et al. (1999). It is expected to be insensitive to dust attenuation. Our models have a resolution that is sufficient to calculate the D4000 break (Maraston, 2005), the calculation being based on the un-reddened spectra and thus an intrinsic, dust-free D4000 measurement. D4000 is quite sensitive to metallicity and its variation with the age of the stellar population is also strongly dependent on the star formation history (Maraston, 2005). Its smooth and continuous increase when stars become older makes it a useful indicator of the age of the predominant stellar population. Moreover, its extensive use in analyses of SDSS data sets (e.g. Kauffmann et al., 2003b) has provided references for the distribution of the D4000 in the nearby universe.
In Fig 11, we report the D4000 values as a function of the stellar mass, both quantities being outputs of CIGALE. The value of D4000 (i.e. the age of the stellar populations) increases with the stellar mass, as also found by Kauffmann et al. (2003b). Most objects have a low D4000 (D40001.5), even for massive galaxies. The situation is quite different for the SDSS galaxies that exhibit a bimodal D4000 distribution (roughly separated at D4000 = 1.5), the more massive galaxies () having D4000 . Our galaxies have D4000 values characteristic of galaxies with in the SDSS.
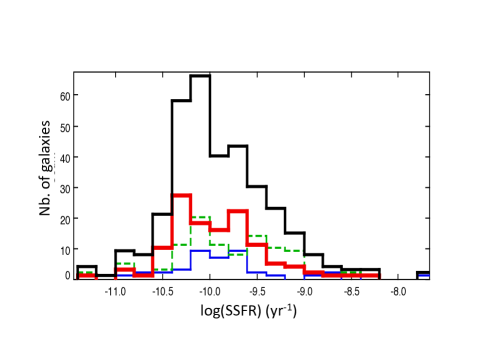
Another interesting parameter is the specific star formation rate SSFR = SFR/ which is a measure of the present star formation activity relative to the past one and gives a rough indication of the star formation history in galaxies. The histograms of SSFR for the whole sample and different mass bins are plotted in Fig 12. As expected from their D4000 and stellar mass distributions, galaxies exhibit a unimodal distribution of SSFR with a tail towards high SSFR, the average value for the whole sample being yr-1. This distribution is similar to that found for galaxies with stellar mass between and in the SDSS (Brinchmann et al., 2004). No obvious trend is found with stellar mass, in contrast to the findings of Brinchmann et al. (2004) in the SDSS.
We can therefore conclude that our selection, which is mainly based on a detection at 140 m with AKARI, is biased towards massive galaxies () that are quite active in star formation relative to the SDSS galaxy sample: the SSFR and D4000 found for our sample are representative of less massive galaxies when the galaxies are selected using visible data.
4 Dust attenuation
4.1 Time-dependent dust attenuation
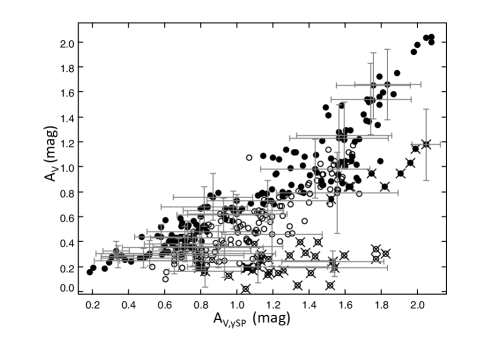
Young stellar populations may be more affected by dust attenuation than older ones (Calzetti et al., 2000; Charlot & Fall, 2000; Panuzzo et al., 2007). CIGALE allows us to separately vary dust attenuation for the two stellar populations considered for the star formation history by adjusting the parameter , the reduction factor applied to the dust attenuation in the V band of the old population (expressed in magnitudes). Although is poorly constrained, the global dust attenuation (for both old and young stellar populations) and that found for the young stellar population alone are clearly determined. We consider here D4000 as an estimate of the luminosity-weighted age of the stellar population and we divide the sample into two sub-samples corresponding to D4000 lower or larger than 1.3. In Fig 13, the total V-band attenuation is plotted against the V band attenuation of the young stellar population only, . The quantities are correlated and their relation depends on the stellar population age.
The galaxies with D4000 1.3 for which is found to be lower than exhibit a very low : the old stellar population contributes substantially to the stellar emission and undergoes dust attenuation that is much lower than the one affecting the young component. This is indicative of a low value for the global attenuation in the V band relative to that applied to the young stellar population.
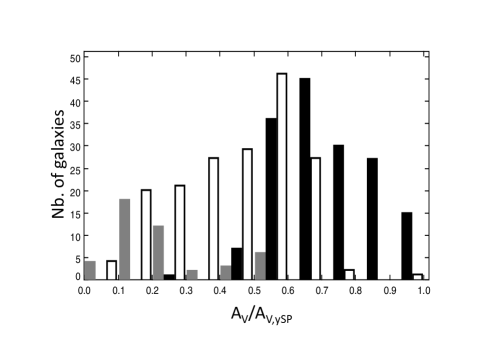
Histograms of are plotted in Fig 14. As expected, the ratio is found to be lower for galaxies with : ( for sources with ) than for galaxies with : .
Calzetti et al. (2000) found a factor of 0.44 between the color excess of the emission lines (related to the very young stellar populations) and the underlying continuum (older stellar populations). Charlot & Fall (2000) recommend reducing by a factor three the effective optical depth for stars older than years. In the same way Panuzzo et al. (2007) defined different age-dependent scale-heights for the stellar population, using again a typical timescale of years to define young stars. In the present work, the young and old stellar populations are defined differently from these previous studies: the young stellar population does not represent stars younger than years but the stellar population from a second episode of star formation and the parameter D4000 measures a mean age of the global stellar populations dominating the optical emission. Although the age of the young stellar population alone () is ill-constrained (cf. section 3), the mean value of the output parameter is Gyr, i.e. older than years. Moreover, we compare the attenuation of the global (oldyoung) stellar population , which also depends on the star formation history, to that of the young stellar population alone, . We cannot therefore directly compare with the difference of color excess E(B-V) found by Calzetti et al. (2000) between the nebular gas emission lines and the underlying stellar continuum, which correspond to more extreme ages for the stellar populations (a few years for the emission lines and a few Gyr for the underlying continuum of the Balmer lines). The recipe of Charlot & Fall (2000), which consists of reducing by a factor three the effective absorption after 107 years, is related to our parameter , which is defined as the ratio of for the old to young stellar populations. As discussed in section 3, is ill-constrained for individual cases. Nevertheless, = 1 is chosen as the best-fit model when running CIGALE ( analysis) for only 4 of the galaxies and the Bayesian analysis gives for only seven sources (cf. Fig. 7). The mean value of for the whole sample is 0.39 0.15, below the mean of the input values (equal to 0.5, cf. Table 2), which, for an ill-constrained parameter, suggests a true mean lower than the return value of 0.39. Hence we can conclude that as already found by Noll et
al. (2009b) for SINGS galaxies. An attenuation factor lower than 0.5 as well as a global dust attenuation () lower than that of the young stellar population alone ( ) provide strong support for an age-dependent process for dust attenuation in galaxies.
Given the uncertainties in the exact determination of and the different timescales adopted to define young stellar populations, our results are consistent with those of Calzetti et al. (2000) and Charlot & Fall (2000) and an age-dependent dust attenuation has to be assumed when performing SED fitting.
4.2 as a function of
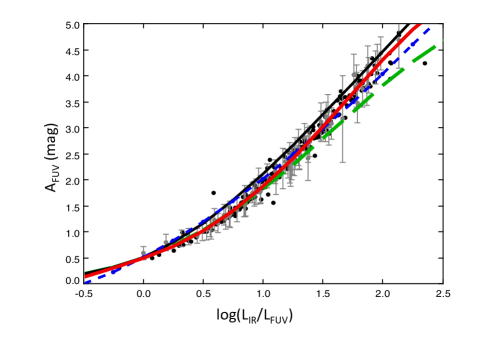
The ratio333 at 153 nm expressed in solar units as is known to be a very robust estimator of as long as galaxies form stars efficiently. Several calibrations can be found, the main difference coming from the star formation history adopted (e.g. Buat et al., 2005; Cortese et al., 2008). In quiescent systems, a substantial part of dust heating is due to photons emitted by old stars which do not emit primarily in UV. In this case, the relations between and derived for an active star formation overestimate dust attenuation in the UV range. CIGALE gives the global attenuation in the FUV (combination of dust attenuation of young and old stellar populations), which is plotted in Fig. 15 as a function of . A very tight relation is found, as expected since our galaxies are found to constitute a homogeneous population of star-forming galaxies in terms of SSFR and D4000. Applying a polynomial regression on our data yields:
, where .
We can compare these estimates to other relations from the literature, obtained with different scenaros for the dust attenuation and star formation rates. Gordon et al. (2000) showed that the relation between and is insensitive to dust attenuation configurations. Further studies identified a stronger sensitivity to the star formation history. Meurer et al. (1999) assumed a young stellar population only, for constant star formation rate over 1 to 100 Myr, to derive a relation between and ( is defined as , the ratio of the far-IR luminosity between 40 and 120 m to the luminosity at 1600 ). Cortese et al. (2008) explored more realistic models for normal galaxies with exponentially decreasing SFRs and various , Buat et al. (2005) obtained a mean relation for a large number of star formation scenarios, from short bursts to constant star formation rates. These different relations are reported in Fig. 15. All of them are obtained by assuming a single stellar/dust configuration, without any time dependence of the attenuation whereas a different attenuation for the old and young stellar population is introduced in CIGALE. The relation of Meurer et al. (1999) systematically overestimates the dust attenuation we find in this work. Our results are more compatible with the relation of Buat et al. (2005) at least for galaxies with dust attenuations larger than 2 mag. The Cortese et al. (2008) relation with Gyr provides a good fit for sources with intermediate attenuation (between 1 and 2 mag). In all cases the variations in these estimates remain modest there being a difference of at most 0.3 mag between our polynomial regression and the relations of Meurer et al. (1999) and Buat et al. (2005) that reaches 0.7 mag with the Cortese et al. (2008) calibration for large dust attenuations.
4.3 and UV-optical colours
Dust attenuation diagnostics based on UV-optical data alone can be very useful for applyung a correction for dust attenuation to the emission of galaxies not observed in far IR. Meurer et al. (1999) found a relation between the slope of the rest-frame UV continuum (defined as for nm) and dust attenuation traced by for local starburst galaxies observed by IUE and IRAS. This local starburst relation is now widely used to estimate dust attenuation in UV-selected galaxies. In the local universe, the colour is used as a proxy of , even if the NUV band overlaps the bump area of the Milky Way dust extinction curve (e.g. Conroy et al., 2010)). Johnson et al. (2007) investigated the link between (and therefore ) and various colours for galaxies detected by GALEX, SDSS, and Spitzer. Their sample represents both the red and blue sequence of the local universe and they found a dependence of on D4000, i.e. on the age of the stellar populations. As described in section 3, our sample is strongly biased towards active star-forming galaxies, so we expect to find a smaller dispersion in the -colour relation than that found by Johnson et al. (2007).
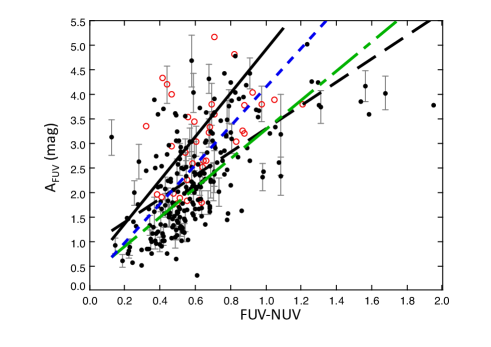
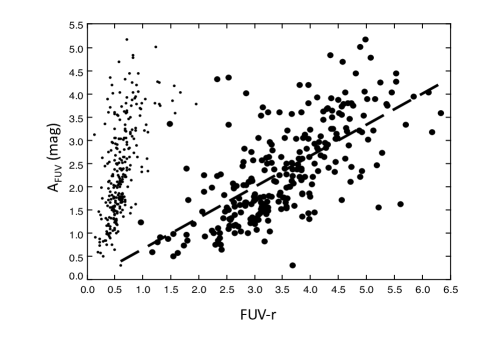
We compare the dust attenuation parameter obtained with our SED fitting method and two colours: the UV-only colour and the longer base-line colour .
We first consider the colour and restrict our analysis to sources with an error in that is smaller than 0.2 mag . The values are reported in Fig 16 and exhibit a fairly weak correlation (correlation coefficient R=0.59), a linear regression indicating that:
Several authors proposed a relation between and . Meurer et al. (1999) obtained a linear relation between the slope of the UV continuum and for starburst galaxies, Seibert et al. (2005) found that the starburst relation overestimates by mag for a sample of galaxies not necessarily starbursting. These relations are reported in Fig 16, wheren when necessary is computed from the colour ( (Kong et al., 2004)). We find that the relation proposed by Seibert et al. (2005) fits our results more closely than that of Meurer et al. (1999) but, in most cases, it overestimates the dust attenuation for a given colour. Salim et al. (2007) derived a shallower relation by fitting UV-optical data only (without IR data) for normal blue galaxies. Their relation is also reported in Fig 16 and appears consistent with our own regression. In all cases the dispersion in the data leads to a standard deviation around the regression line of 0.8 mag. The steepness of the relation between and make the derivation of a dust attenuation from the color quite uncertain. This weakness of the colour as a dust attenuation estimator is also underlined by Conroy et al. (2010). Using our regression formula leads to an uncertainty of 0.5 mag on for an error of only 0.2 mag on the colour. Luminous infrared galaxies (LIRGs) with (Fig 16) are found to be closer to the starburst law than the bulk of the sample as already found by Takeuchi et al. (2010) and Howell et al. (2010), but the dispersion in their distribution remains large.
The long baseline is now considered, where we again restrict the analysis to sources with an error smaller than 0.2 mag in this colour. A weak correlation (R=0.68) is found between and . It is clear from Fig 17 that the larger range of values obtained for compared to that for leads to a more reliable estimate of dust attenuation for a similar uncertainty in the colours. A linear regression gives
The RMS dispersion is large reflecting the dispersion in the correlation. Nevertheless, the relation between and is much flatter than that between and implying an error of only 0.1 mag in for an error of 0.2 mag in .
Johnson et al. (2007) proposed several relations between , , and D4000. For consistency, we prefer to compare rather than with . Nevertheless, we have checked that their relation corresponding to D4000 = 1.25 (close to the mean D4000 found for our sample) is compatible with our values of and .
Both colours give only a crude estimate of with an RMS dispersion of mag. Since we have considered galaxies actively forming stars the colour is found to be a more reliable proxy than of dust attenuation in UV: only one UV band is necessary and the relation with is less sensitive to the photometric uncertainty than when is considered. In the same way, Johnson et al. (2007) proposed to use the m colour.
5 SFR calibrations
When both UV and IR fluxes are measured, a very efficient way to estimate SFR is to add the contributions of both types of emission to the total SFR (e.g. Iglesias-Páramo et al., 2006; Elbaz et al., 2007). One must also account for dust heating by old stars, which is not directly related to the current star formation and given by
where represents the fraction of IR emission due to dust heating by old stars, being calculated by converting the total IR luminosity into SFR assuming that all the light from stars is absorbed by dust and is calculated from the observed UV luminosity . The relation between the IR and FUV luminosities and the corresponding SFRs are derived from population synthesis models assuming a particular initial mass function and star formation history. In this work, we use the calibrations from Buat et al. (2008) for a constant over years (the typical duration of the UV emission to reach a steady state) and a Kroupa initial mass function (Kroupa, 2001)
: and . We prefer to combine SFRs rather than luminosities to avoid bolometric corrections in UV, which depend on the wavelength range assumed for the UV (Bell et al., 2005) the FUV being taken to be monochromatic (at 153 nm) and directly calibrated in terms of the SFR.
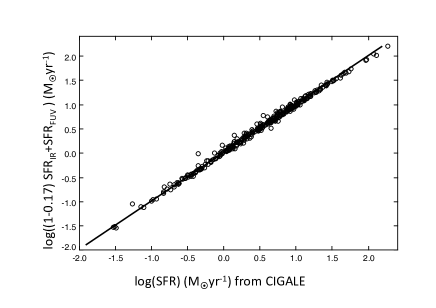
In Fig 18, we report the variation in as a function of for our sample,
for the whole sample. A small trend is found as a function of with for (26 galaxies).
Adopting leads to a very good agreement between and the SFR estimated by CIGALE (Fig. 19). This agreement implies that the timescales over which both SFRs are calculated are similar. As explained above, the calculation of assumes a constant SFR over years. The SFR deduced from the code is mainly governed by the second stellar population, which is produced at a constant rate over years (cf. Fig. 2). Even if is poorly constrained (cf. section 3.2), its median value for the sample is 250 Myr, confirming that the SFR measured by CIGALE is consistent with a constant SFR over years.
The value of we find here is lower than that found by Hirashita et
al. (2003) (). Bell (2003) estimated the mean contribution of old stellar populations to to be for and for , these values and those of the present work are compatible within their uncertainties.
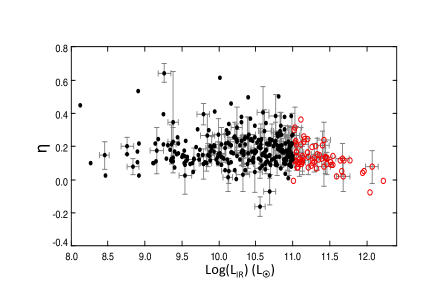
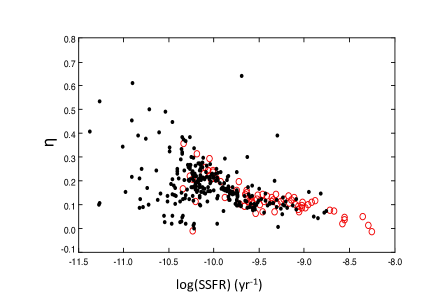
da Cunha et al. (2010) estimated the fraction of total IR luminosity emitted by dust in the diffuse ISM, stars being assumed to migrate in this ambient ISM years after their birth. This parameter is not directly comparable to for several reasons: dust in the ISM is also heated by the young stars and a fraction of its emission is related to the star formation. We note that we define by assuming a constant star formation rate over years and stars in the ISM younger than years are also contributors to the current SFR. We therefore expect to be larger than . Indeed, da Cunha et al. (2010) found median values of between 0.5 and 0.7 with a dependence on the stellar mass and the specific star formation rate. We found a very weak positive correlation between and and strongly correlates with the SSFR (Fig. 20) confirming the results of da Cunha et al. (2010). This result is unsurprising since in galaxies that are very active in star formation the dust is mainly heated by newly formed stars.
6 Conclusions
We have analysed the broad-band SEDs of 363 nearby galaxies from the UV to the far-IR by combining AKARI, SDSS, and GALEX surveys. The sample is close to representing one based on a far-IR selection. We fitted the SEDs with the code CIGALE that performs a Bayesian analysis to deduce parameters related to the dust attenuation and star formation of each galaxy. An old (exponentially decreasing SFR) and a young (constant SFR) stellar population are combined and the attenuated stellar emission is related to the dust emission on the basis of energy conservation. We have shown that the detailed star formation history is ill-constrained even when considering 11 photometric bands, whereas global properties such as the stellar mass, the total dust emission, the star formation rate, the 4000 break, or the amount of dust attenuation are reliably estimated.
Our galaxies appear to be both massive and active in star formation. Different dust attenuations are found for the young and old stellar populations leading to a global dust attenuation in the V band that is lower than that assumed for the young stellar population only, by a factor of 0.4 for galaxies with a 4000 break, D4000 1.3, and a factor of 0.7 for galaxies with D4000 (D4000 being estimated from the SED fitting process). We have been unable to constrain the presence of a bump at 220 nm but have found that a dust attenuation law that is slightly steeper than that proposed by Calzetti et al. (2000) more closely reproduces our data.
The dust attenuation in the FUV band of is very well constrained by the ratio. A polynomial calibration is provided and compared to other already published relations.
We discussed the reliability of the and colours in estimating dust attenuation at FUV in the absence of IR data and find that both give only a very crude estimate of . The colour is more reliable because the linear regression - is not as steep as that between and .
The SFR given by CIGALE is compared to the combination of SFRs estimated by adding the IR and the UV observed contributions. Both estimates agree remarkably well when a contribution of dust heating by old stars of 17 is assumed.
Acknowledgements.
This work is based on observations with AKARI, a JAXA project with the participation of ESA. VB, EG and DB have been supported by the Centre National des Etudes Spatiales (CNES). TTT has been supported by Program for Improvement of Research Environment for Young Researchers from Special Coordination Funds for Promoting Science and Technology, and the Grant-in-Aid for the Scientific Research Fund (20740105) commissioned by the Ministry of Education, Culture, Sports, Science and Technology (MEXT) of Japan. TTT is partially supported from the Grand-in-Aid for the Global COE Program “Quest for Fundamental Principles in the Universe: from Particles to the Solar System and the Cosmos” from the MEXT.References
- Abazajian et al. (2009) Abazajian K. N., Adelman-McCarthy, J.K., Agueros, M.A. et al., 2009, ApJS, 182, 543
- Balogh et al. (1999) Balogh, M. L.; Morris, S. L.; Yee, H. K. C.; Carlberg, R. G.; Ellingson, E. 1999, ApJ, 527, 54
- Bell (2003) Bell, E. 2003, ApJ 586, 794
- Bell et al. (2005) Bell, E.F.; Papovich, C., Wolf, C. et al. 2005, ApJ 625, 23
- Boissier et al. (2007) Boissier S.,Gil de Paz, A., Boselli, A. et al. 2007, ApJS, 173, 524
- Boquien et al. (2009) Boquien, M., Calzetti, D. , Kennicutt, R. et al., 2009, ApJ, 706, 553
- Brinchmann et al. (2004) Brinchmann, J., Charlot, S.; White, S. D. M.2004, MNRAS, 351, 1151
- Buat et al. (2005) Buat, V., Iglesias-Páramo, J.; Seibert, M. et al. 2005, ApJ, 619, L51
- Buat et al. (2008) Buat, V., Boissier, S., Burgarella, D. et al. 2008, A&A, 483, 107
- Burgarella et al. (2005) Burgarella, D.; Buat, V.; Iglesias-Páramo, J. 2005, MNRAS, 360, 1413
- Calzetti et al. (1994) Calzetti, D., Kinney, A.L., Storchi-Bergmann, T.1994, ApJ 429, 582
- Calzetti et al. (2000) Calzetti, D., Armus, L., Bohlin, R. C. et al. 2000, ApJ, 533, 682
- Cardelli et al. (1989) Cardelli, J.A., Clayton, G.C., Mathis, J.S. 1989, ApJ, 345, 245
- Charlot & Fall (2000) Charlot, S., Fall, M. 2000, ApJ 539, 718
- Chary & Elbaz (2001) Chary, R., Elbaz, D. 2001, ApJ, 556, 652
- Conroy et al. (2010) Conroy, C., Schiminovich, D., Blanton, M.R. 2010, ApJ, 718, 184
- Cortese et al. (2008) Cortese C., Boselli, A., Franzetti, P. 2008, MNRAS, 386, 1157
- da Cunha et al. (2008) da Cunha, E., Charlot, S., Elbaz, D. 2008, MNRAS, 388, 1595
- da Cunha et al. (2010) da Cunha, E., Eminian, C., Charlot, S., Blaizot, J. 2010, MNRAS 403, 1894
- Daddi et al. (2007) Daddi E., Alexander, D.L., Dickinson, M. et al. 2007, ApJ, 670, 156
- Dale et al. (2001) Dale, D., A., Helou, G., Contursi, A., Silbermann, N.A., Kolhatkar, S. 2001, ApJ, 549, 215
- Dale & Helou (2002) Dale, D. A. , Helou, G. 2002, ApJ, 576, 159
- Dale et al. (2007) Dale, D. A., Gil de Paz, A., Gordon, K.D. et al. 2007, ApJ, 655, 863
- Elbaz et al. (2007) Elbaz, D., Daddi, E. , Le Borgne, D. et al. 2007, A&A, 468, 33
- Giovannoli et al. (2010) Giovannoli, E., Buat, V., Noll, S., Burgarella, D., Magnelli, B. 2011, A&A, 525, 150
- Gordon et al. (2000) Gordon, K. D., Clayton, G.C., Witt, A. N., Misselt, K.A. 2000, ApJ 533, 236
- Iglesias-Páramo et al. (2006) Iglesias-Páramo, J., Buat, V., Takeuchi, T. T., et al. 2006, ApJS, 164, 38
- Iglesias-Páramo et al. (2007) Iglesias-Páramo, J., Buat, V., Hernandez-Fernandez, J., et al. 2007, ApJ, 670, 279
- Hirashita et al. (2003) Hirashita, H., Buat, V., & Inoue, A. K. 2003, A&A, 410, 83
- Inoue et al. (2006) Inoue, A.K., Buat, V., Burgarella, D., Panuzzo, P., Takeuchi, T.,T., Iglesias-Páramo, J. 2006, A& A, 370, 380
- Johnson et al. (2007) Johnson, B. D., Schiminovich, D., Seibert, M. et al. 2007, ApJS, 173, 377
- Kauffmann et al. (2003a) Kauffmann, G., Heckman, T.M., White, S. et al. 2003, MNRAS, 341, 33
- Kauffmann et al. (2003b) Kauffmann, G., Heckman, T.M., White, S. et al. 2003, MNRAS, 341, 54
- Kawada et al. (2007) Kawada, M., Baba, H., Barthel, P.D. et al., 2007, PASJ, 59, 389
- Kennicutt (2003) Kennicutt, R.C., Armus, L., Bendo, G. et al. 2003, PASP, 115, 928
- Kong et al. (2004) Kong X., Charlot S., Brinchmann J., Fall S. M., 2004, MNRAS, 349, 769
- Kroupa (2001) Kroupa P., 2001, MNRAS, 322, 231
- Howell et al. (2010) Howell J. H.,Armus, L., Mazzarella, J.M. et al. 2010, ApJ, 715, 572
- Maraston (2005) Maraston, C. 2005, MNRAS 362, 799
- Martin et al. (2005) Martin D. C., Fanson, J., Schiminovich, D. et al. 2005, ApJ, 619, L1
- Meurer et al. (1999) Meurer, G. R., Heckman, T. M., & Calzetti, D. 1999, ApJ, 521, 64
- Noll et al. (2009a) Noll, S., Pierini, D., Cimatti, A. et al. 2009a, A&A 499, 69
- Noll et al. (2009b) Noll S., Burgarella D., Giovannoli E. et al. 2009b, A&A, 507, 1793
- Panuzzo et al. (2007) Panuzzo P., Granato G. L., Buat V., Inoue A. K., Silva L., Iglesias-Páramo J., Bressan A., 2007, MNRAS, 375, 640
- Popescu et al. (2000) Popescu, C.C., Misiriotis, A., Kylafis, N.D., Tuffs, R.J., Fischera, J. 2000, A&A, 362, 138
- Popescu et al. (2010) Popescu, C.C., Tuffs, R.J, Dopita, M.A., Fischera, J.,, Kylafis, N.D., Madore, B.F. 2011, A&A, 527, 109
- Salim et al. (2007) Salim, S. Rich, M., Charlot, S. et al. 2007, ApJS, 173, 267
- Saunders et al. (2000) Saunders, W., Sutherland, W.J., Maddox, S.J. et al. 2000, MNRAS 317, 55
- Seibert et al. (2005) Seibert, M., Martin, D. C., Heckman, T.M. et al. 2005, ApJ 619, L55
- Siebenmorgen & Krügel (2007) Siebenmorgen, R., Krügel, E. 2007, A&A 461, 445
- Silva et al. (1998) Silva, L, Granato, G.L., Bressan, A., Danese, L., 1998, ApJ 509, 103
- Schlegel et al. (1998) Schlegel, D.,J., Finkbeiner, D.P., Davis, M. 1998, ApJ, 500, 525
- Takeuchi et al. (2010) Takeuchi T. T., Buat V., Heinis S. et al. 2010, A&A, 514, A4
- Tuffs et al. (2004) Tuffs, R. Popescu, C., Volk, H.J., Kylafis, N.D., Dopita, M.A. 2004, A&A 419, 821
- Véron-Cetty & Véron (2006) Véron-Cetty , M.P., Véron, P. 2006, A&A 455, 773
- Walcher et al. (2008) Walcher, J., Lamareille, F., Vergani, D. et al. 2008, A&A 491, 713
- Walcher et al. (2010) Walcher, J., Groves, B., Budavari, T., Dale,D. 2011, Ap&SS 331, 1
- Yamamura et al. (2010) Yamamura, I., Makiuti, S., Ikeda et al. 2010, AKARI-FIS Bright Source Catalogue Release note Version 1.0