Impact of dead zones on the response of a hadron calorimeter with projective and non-projective geometry
Abstract
The aim of this study is to find an optimal mechanical design of the hadronic calorimeter for SiD detector which takes into account engineering as well as physics requirements. The study focuses on the crack effects between two modules for various barrel mechanical design on calorimeter response. The impact of different size of the supporting stringers and dead areas in an active calorimeter layer along the module boundary has been studied for single pions and muons. The emphasis has been put on the comparison of the projective and non-projective barrel geometry for SiD hadronic calorimeter.
keywords:
Calorimeters, Detector modelling and simulations, Micropattern gaseous detectors, Large detector systems for particle and astroparticle physics1 Introduction
Design of the future particle physics detectors for the International Linear Collider (ILC) [1] is optimized for usage of the Particle Flow Algorithm (PFA) [2]. By this strategy, a jet energy resolution of can be reached and thus allows the reconstruction of the invariant masses of W’s, Z’s, and tops with resolutions close to the natural widths of these particles. On the other hand, new challenges are put on the construction of the detector subsystems, particularly on calorimeters which must have imaging capability allowing the assignment of energy cluster deposits to charged or neutral particles with high accuracy. In order to fulfill this requirement, several detector technology for active part of the calorimeters are currently under development. In parallel, the work on the engineering design of whole calorimeters and their assembly methods are well advanced.
The aim of this study is to find an optimal mechanical design of the hadronic calorimeter (HCAL) for SiD detector [3] which takes into account engineering as well as physics constrains. Therefore, the impact of the various HCAL mechanical design on the calorimeter response has been evaluated. Since the calorimeter is composed from independent modules, which due to mechanical reasons creates discontinuities in the detection, the study is focused on the hadronic shower behavior close to the boundaries between these modules for different calorimeter geometry and for size of dead areas along this boundary.
2 Calorimeter geometry and simulation tools
2.1 Projective and non-projective geometry
The SiD hadronic calorimeter is a sampling calorimeter, which is located inside the magnet coil and surrounds the electromagnetic calorimeter. The barrel part is divided into twelve azimutals modules, each one consisting of 40 layers with a passive part composed of 1.89 cm thick stainless steel absorber and an active part equipped with RPC chambers (SiD baseline detector choice for HCAL) or alternative detectors, such as Micromegas, GEM or Scintillator [3]. Thus the total calorimeter depth is 4.5 and the overall dimensions are: mm, mm, and mm, where denote calorimeter length, and its internal and external radii, respectively.
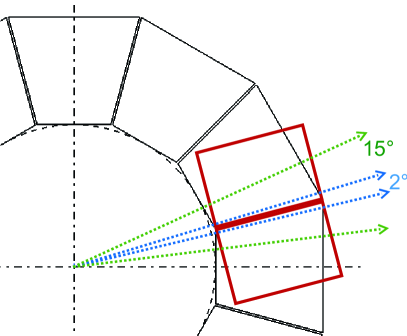
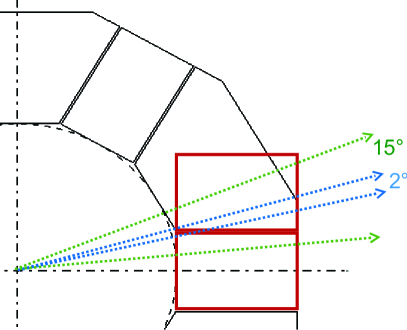
Two calorimeter geometries have been proposed so far. The first one is a projective geometry consisting of twelve identical trapezoidal modules whose edges are pointing to the beam axis, see Fig. 1 left. The second geometry was designed in order to avoid cracks in calorimeter between the modules. Therefore it is an off-pointing or non-projective geometry, where the modules boundaries are not projective with respect to the beam axis. It consists of six trapezoidal and six rectangular modules, which are arranged on a rota basis as it is shown in Fig. 1 right. The shape of the trapezoidal modules of the non-projective geometry is such, that internal and external surface of both proposed geometries are identical, so called do-decagon. A detail description of the geometry for SiD HCAL can be find in Ref. [4].
2.2 Simulation set-up
2.2.1 Geometry configurations
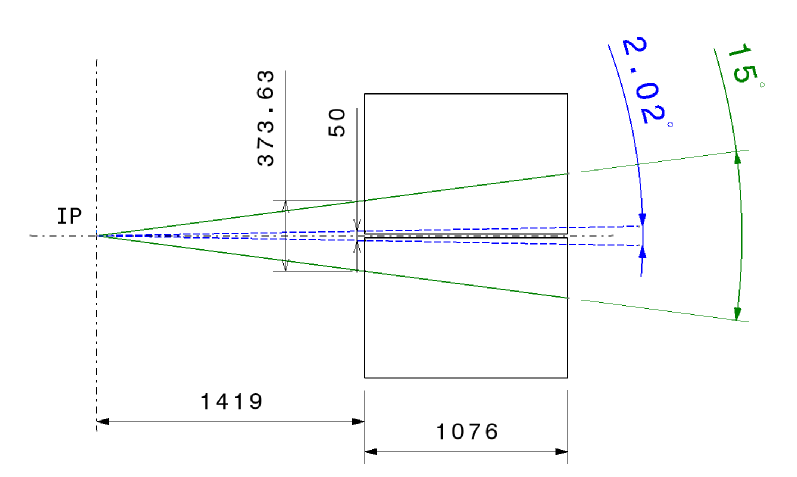
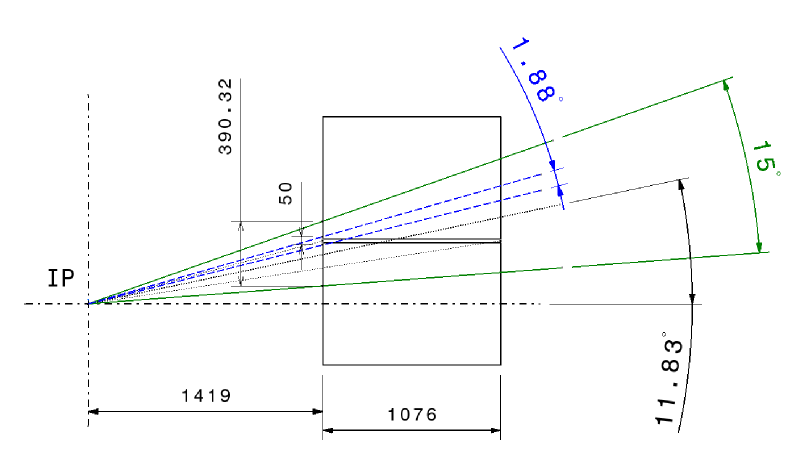
Since the description of the barrel calorimeter (including 12 modules) with all necessary mechanical details (different shape of the modules and utilization of the supporting stringers) had not been available for a detailed simulation study, a simplified geometry using only two adjacent rectangular modules has been implemented. These modules are placed under two different angles with respect to the interaction point, as it is illustrated in Fig. 1, which correspond to the boundary position of the projective and non-projective module configuration, respectively. Because the study is focused on the boundary effects with single impinging particles, the simplified geometry with one module transition can be considered as a good approximation of the two modules with trapezoidal shape as well. Moreover, due to the axial symmetry of the calorimeter, the results obtained with the simplified geometry can be extended to the whole calorimeter having twelve modules.
The overall dimensions of each rectangular module is mm3, where a calorimeter depth of 1076 mm is corresponding to 4.5. Each module consists of 40 absorbers made from a 1.89 cm thick stainless steel plates interlayed by 8 mm gaps for Micromegas chambers which were chosen as an calorimeter active medium for this study. An active part of the chamber is 6.5 mm thick and includes: 1.2 mm of PCB material, 2.3 mm of material for the chips and other passive components and 3 mm of gas (Ar/Isobutane 95/5). A detail geometry description of the existing Micromegas prototype which has been implemented in the simulation can be found in Ref. [5].
Modules in the SiD calorimeter are hold together by supporting stringers made of 2 cm thick stainless steel plates which contribute to the dead areas in the calorimeter. In order to evaluate how they affect the calorimeter response, configurations with different stringer thickness were considered for the projective and non-projective geometry, respectively. The first configuration is ideal with two rectangular modules interconnected without supporting plates and hence without any cracks between them. The second and third configurations have 1 and 2 cm thick supporting plates, respectively. The last configuration is similar to the third one, but material of the electromagnetic calorimeter, which is equal to about 1 , was added in front of the hadronic calorimeter. In this configuration the electromagnetic calorimeter is used only as a passive detector component in order to estimate the fraction of the hadronic shower deposition within its material.
2.2.2 Generated data samples
Two sets of Monte Carlo data were generated by the GEANT4-based simulator SLIC [6] with the
QGSP_BERT physics list for the four above described configurations and for the projective and non-projective
geometry. For each set, 50 GeV negative pions and muons were generated randomly within a vertex cone
angle of about 2∘ and 15∘, directed from the interaction point toward the modules boundary, see
Fig. 1. Therefore an impact area around the boundary was restricted to a disc with a radius
of 2.5 cm for smaller the cone angle and about 19.1 cm for the larger cone angle. Precise values of the cone angles
and impact areas for projective and non-projective geometry are displayed in Fig. 8 (Appx. A).
The small impact area was studied for the reason that the most of the hadronic showers develop close to the boundary
between two modules and hence its influence can be directly quantified and compared. On the other hand,
the large cone angle will simulate all possible directions of incoming particles and thus can be approximated
to the calorimeter which covers whole polar angle. The generated data, 10,000 events for smaller angle and 20,000
events for larger angle for each calorimeter configuration, were subsequently reconstructed and analyzed by a
standalone program using the org.lcsim framework [6].
2.2.3 Digitization
The Micromegas detector has very fine lateral segmentation (about 11), which is read out by digital electronics embedded directly on the detector. Calorimeter with digital readout is based on the principle that the number of counted hits is proportional to energy deposited in calorimeter. In given case, one hit is counted in a 11 cell only when the energy measured in the cell is higher than a threshold. The readout threshold that was used within this study is 0.5 MIP MPV. In order to be as close as possible to the real detector conditions, the a full digitization of the signals is performed in the simulation. This includes mainly the conversion from energy deposited in 3 gas gap from GeV to charge in pC and electronics digitization. The most important parameters, such as chamber geometry, mesh transparency, gas amplification, electronics noise, and chamber efficiency, where delivered from dedicated laboratory and test beam measurements.
3 Comparison of the projective and non-projective geometry
3.1 Calorimeter response
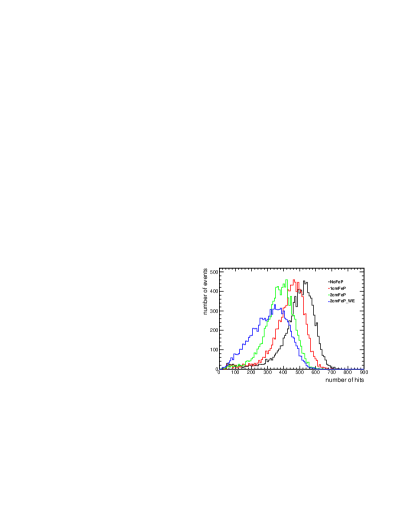
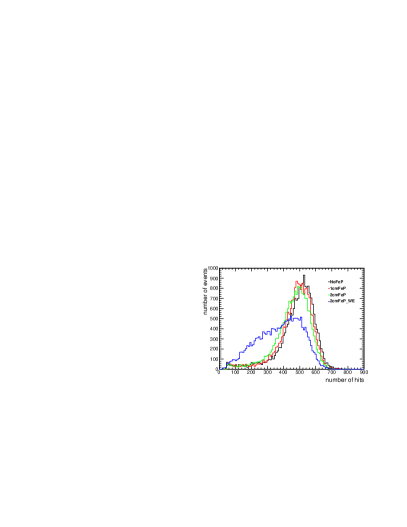
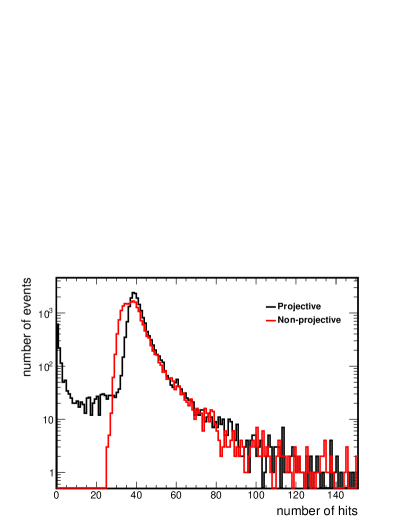
Figure 2 shows distributions of the total number of hits counted in calorimeter for 50 GeV single pions generated within 2∘ cone vertex angle for different simulation configurations and for the projective and non-projective geometry. In case of the projective geometry, smaller number of hits and thus less visible energy is seen as the thickness of the absorber plate increases, see Fig. 2 left. This is because the trajectory of the primary pions is close to the boundary and therefor most hadronic showers develop near the boundary. Thus the significant part of the shower is absorbed in inactive material of the supporting plate and is not measured by the calorimeter. Moreover, in configuration with electromagnetic calorimeter the smallest number of hits is counted due to the events with showers that start already inside the electromagnetic calorimeter. That is why its distribution has a broad left-hand tail. Of course, this part of the shower energy can be retrieved if the electromagnetic calorimeter is active. On the other hand, in case of the non-projective geometry, the number of hits collected in calorimeter with and without absorbing plate is almost identical, see Fig. 2 right. This is due to the fact that most primary pions cross the boundary between the modules before starting a shower, and also because the showers develop in a direction of primary particle. Therefore a very small fraction of the showers, if even any, is lost in the supporting plate.
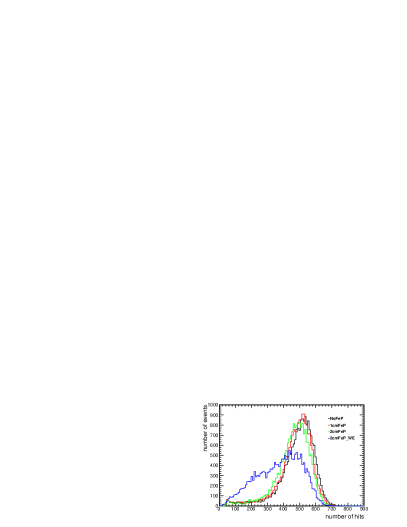
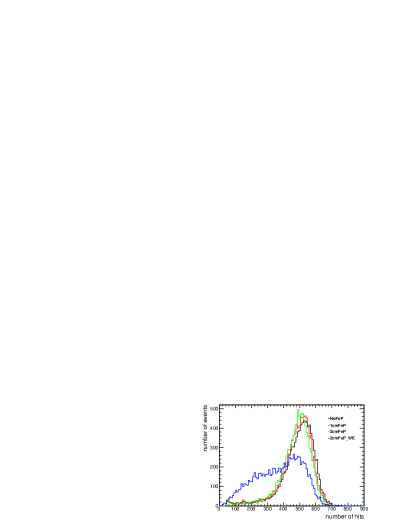
Different situation arises in case of the large cone vertex angle (15∘), for which, both projective and non-projective geometry, show similar behaviors, see Fig. 3. Though the direction of the primary pions is different for both geometries, the total number of the counted hits is almost same. This is because the volume of the supporting plate is small with respect to the total volume where energy of the hadronic showers can be deposited. Thus the number of hits which is lost due to the crack between the modules is small in comparison with the average total number of registered hits.
3.2 Impact of the detector dead zone along the module boundary
Due to mechanical constrains, the thickness of the stringers which support the calorimeter modules is limited to 2 cm of stainless steel. Thus the thickness of the stringer defines the minimum size of the dead area between modules. Another contribution to the dead zone is given by the thickness of the frame around the active medium, which can be, depending on the technology of the active layer, up to 2 cm. Therefore a total width of the dead zone is between 2 and 6 cm. Fig. 4 shows the calorimeter response to single pions measured as a mean value of the total number of hits registered in calorimeter for all events versus thickness of the supporting plate for the projective and non-projective geometry. The figure compares also results for a full area active layer and layer with 1 cm dead zone along the edge next to the supporting plate.
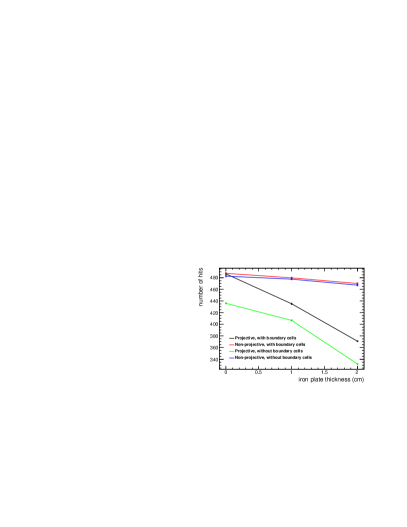
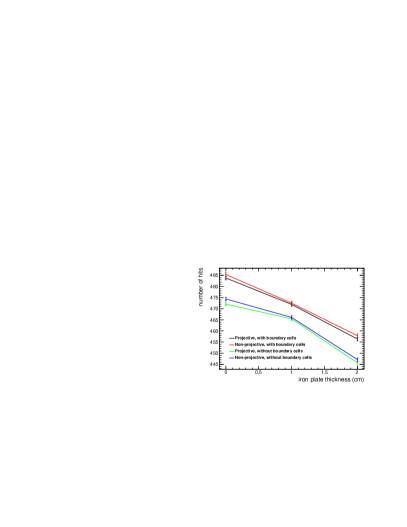
Generally, for the reasons explained in previous section, the calorimeter response decrease with increasing supporting plate thickness. For small cone vertex angle (see Fig. 4 left), the projective geometry, where showers are father from the boundary, only a small decrease in the number of hits is shown if an additional dead zone of 2 cm in the active material (1 cm in each module) is considered. Contrary, the projective geometry shows significant decrease in response (about 10%), because most showers take place close to the boundary. For large cone vertex angle (see Fig. 4 right), same behavior has been found for the projective as well as for non-projective geometry with a response variation of -2.9%/cm of stringers thickness. The response falls-off by about 2% for configuration with 2 cm supporting plate in case of 2 cm dead zone in the active layer (1 cm in each module).
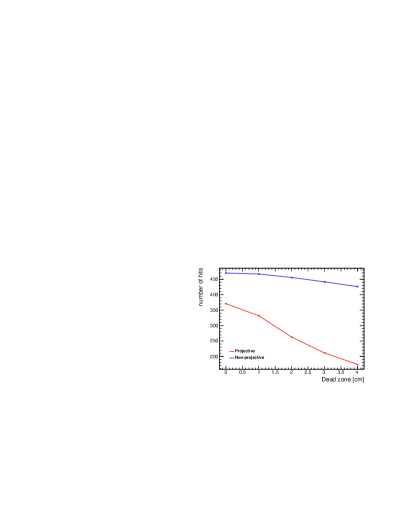
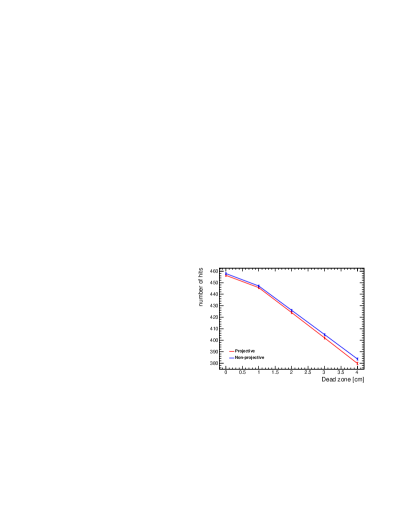
In order to quantify how the size of the dead area in active layer affects the calorimeter response, the size of the dead zone has been varied from 0 up to 4 cm for each calorimeter module. Thus the total size including both the absorber plate and dead areas in active medium have been varied between 2 and 10 cm. As expected, large difference have been found between the projective and non-projective geometry for small cone vertex angle, as it is shown in Fig.5 left. In case of large vertex cone angle (see Fig.5 right), both configurations behave similarly with a response variation of -4.4%/cm of dead area.
3.3 Response versus distance from a crack
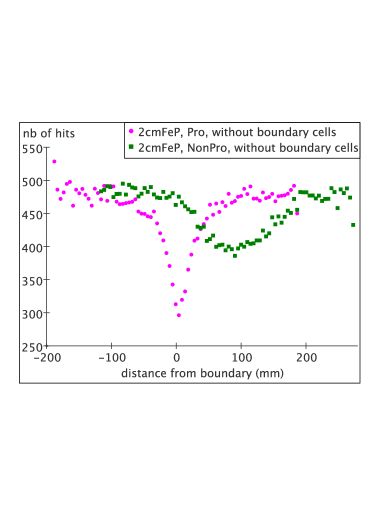
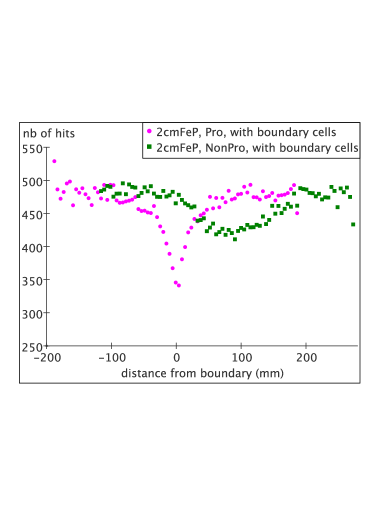
An appearance shape of the calorimeter response around a crack for the projective and non-projective geometry without readout cells along the boundary (1 cm of dead space along the boundary in each module) is shown in Fig. 6 left. The smallest response is observed for the projective geometry, for which the number of hits degreases down to 40% of its maximal value at it is measured far from the crack. As expected, the minimum of the response is seen close to the crack. In case of the non-projective geometry, the calorimeter response drops by 20%. Moreover, due to the off-pointing geometry, the minimal value of the response is located about 10 cm away from the crack. A similar behavior is expected also in whole non-projective HCAL, where the degrease in response due to a crack will be present mainly in trapezoidal modules and smaller part will be seen in rectangular modules. Finally, if the dead space in the active medium is not considered, the calorimeter response is about 5 % higher than in previous case (see Fig. 6 right).
3.4 Comparison for muons
Another important question in comparing the projective and non-projective geometry is what is the fraction of muons that will be not identified in the calorimeter due to cracks. This is an important issue for PFA where the total jet energy is computed from individual particle energy contributions in a jet. For performance of the PFA will be very useful if muons crossing the calorimeter can be easily identified and assigned to the ones measured in muon chambers.
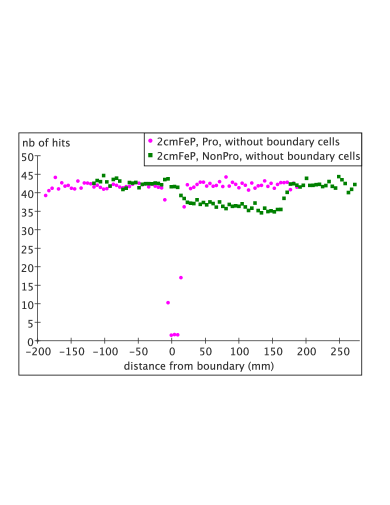
Therefore a test with 50 GeV negative single muons (20,000 events) generated within 15∘ vertex cone angle has been performed and results for the SiD baseline configuration having 2 cm thick supporting plate and 1 cm of a dead zone on each module side are shown in Fig. 7. For an ideal muon event, which has passed a calorimeter without crossing the module boundary, one hit per layer is measured (this results to 40 hits in SiD HCAL). In reality, the number of hits can be slightly smaller due to detection inefficiency of the active layer, or a bit higher due to interactions along the muon track. If a muon goes through the crack, number of registered hits decrease proportionally to the distance which the muon has passed in the crack. In Fig. 7 left is shown that for the projective geometry, a significant number of muons are not registered at all. On the other hand, for every event in non-projective geometry, a clear muon track with more that about 25 hits is recorded. In other words, if one considers that at least 4 hits are necessary for the muon reconstruction in a calorimeter, then about 5 % of muons events is lost in case of the projective geometry and no one is lost for the non-projective geometry. It needs to be noted that the fraction of muons, which are not detected due to the crack, will be slightly smaller in a real detector due to the presence of the solenoid magnetic field.
From an appearance shape of the calorimeter response around the crack (Fig. 7 right) it is seen that for the projective geometry the response is affected in an area of several cm around the crack where the response drops sharply to the zero registered hits. In case of the non-projective geometry, the affected area is larger, around 20 cm, but the number of registered hits decreases by about 20%, which still allows to determine a passing muon close to the module boundary.
4 Summary and conclusions
The projective and non-projective HCAL geometries, which are proposed for SiD detector, have been investigated in order to determine the most suitable one. The comparison for various design configurations allowed to evaluate the impact of the supporting stringers and dead areas along the module boundary which has been studied with single pions and muons. The impact of the boundary between modules is clearly seen for area about 20 cm around a crack. This corresponds to a cone angle of 8∘ which means that for 12 modules the affected area is about 26% of the whole polar angle. Thus, it can be concluded that the decrease of the calorimeter response close to the boundary (for small angles of impinging particles) is significantly smaller for the non-projective geometry. If the impinging particles are distributed in the large polar angles, the global response is similar for both geometries. In this case a response variation of -2.9%/cm of stringers thickness and -4.4%/cm of dead area have been found. This confirms that for base-line SiD design (2 cm thick stringers and 1 cm of dead area in each module) an average response will decrease by about 7 to 8% around a crack. The advantage of the non-projective geometry is that no muons will be lost in a crack, contrary to about 5% of muon events which will be not identified in the projective geometry. On the other hand, the drawback of the non-projective geometry is the mechanical design requiring two different module shapes in comparison with the projective geometry where all the modules are identical. All this aspects need to be carefully weighted in order to give a final decision.
Finally, it needs to be pointed out that because this study has been performed for the simplified geometry description with single pions and muons, it provides very important, but only the first image how the cracks may impact on the calorimeter performance. Also the absence of the magnetic field and information from the other detectors subsystems need to be taken into account for the reconstruction performance in a real detector. Therefore, it is advisable to perform a complementary study with whole SiD detector and real physics analysis of events with jets.
Acknowledgements.
We would like to thank to our colleague A. Espargilière for implementing the Micromegas digitization driver that has been used within this study. Also we would like to express our thanks to the SLIC and lcsim developers whose software has been used and tested in this study and who have always promptly answered all our technical questions concerning this simulation and analysis framework.References
- [1] ILC Global Design Effort and World Wide Study, Int. Linear Collider Reference Design Report
- [2] M. A. Thomson, Particle flow calorimetry and the PandoraPFA algorithm, NIM A611 (2009)
- [3] SiD detector, \hrefhttp://silicondetector.org/display/SiD/homehttp://silicondetector.org/display/SiD/home
- [4] Geffroy at al., Proposal of a new HCAL geometry avoiding cracks in the calorimeter, LAPP-TCECH-2008-02, Sep. 2008
- [5] C. Adloff et al., Micromegas chambers for hadronic calorimetry at a future linear collider, 2009 JINST 4 P11023
- [6] SLIC and org.lcsim, \hrefhttp://www.lcsim.org/software/slic/http://www.lcsim.org/software/slic/ and \hrefhttp://lcsim.org/http://lcsim.org/
Appendix A Detailed description of the geometry as it is used in simulation