Van der Waals density functionals applied to solids
Abstract
The van der Waals density functional (vdW-DF) of Dion et al. [Phys. Rev. Lett. 92, 246401 (2004)] is a promising approach for including dispersion in approximate density functional theory exchange-correlation functionals. Indeed, an improved description of systems held by dispersion forces has been demonstrated in the literature. However, despite many applications, standard general tests on a broad range of materials are lacking. Here we calculate the lattice constants, bulk moduli, and atomization energies for a range of solids using the original vdW-DF and several of its offspring. We find that the original vdW-DF overestimates lattice constants in a similar manner to how it overestimates binding distances for gas phase dimers. However, some of the modified vdW functionals lead to average errors which are similar to those of PBE or better. Likewise, atomization energies that are slightly better than from PBE are obtained from the modified vdW-DFs. Although the tests reported here are for “hard” solids, not normally materials for which dispersion forces are thought to be important, we find a systematic improvement in cohesive properties for the alkali metals and alkali halides when non-local correlations are accounted for.
pacs:
71.15.Mb 61.50.-f 31.15.-pI Introduction
London dispersion interactions are an ubiquitous phenomenon which contribute to the stability of a wide variety of systems ranging from biomolecules to molecules adsorbed on surfaces. However, the origin of the dispersion forces – non-local electron-electron correlations – makes their accurate theoretical description challenging. This is especially true for density functional theory (DFT) where local or semi-local functionals lack the necessary ingredients to describe the non-local effects. In fact, developing methods that include dispersion, at least approximately, has been one of the most important fields of development in DFT in the last decade. Out of the various schemes that have been proposed to add dispersion to current DFT approximations Andersson et al. (1996); Dobson and Dinte (1996); Dion et al. (2004); von Lilienfeld et al. (2004); Antony and Grimme (2006); Becke and Johnson (2007); Grimme et al. (2007); Sato et al. (2007); Tkatchenko and Scheffler (2009); Sato and Nakai (2010, 2010), the van der Waals density functional (vdW-DF) method Dion et al. (2004) is very appealing since it is based directly on the electron density. In this functional the exchange-correlation energy takes the form of
| (1) |
where the exchange energy uses the revPBE generalized-gradient approximation (GGA) functional Zhang and Yang (1998), is the local density approximation (LDA) to the correlation energy. The is the non-local energy term which accounts approximately for the non-local electron correlation effects. Although is obtained using a relatively simple double space integration, this still represents an improvement compared to local or semi-local functionals.
Although the vdW-DF method greatly improves the interaction energies of dispersion bonded systems, its accuracy, however, has been shown Gulans et al. (2009); Kelkkanen et al. (2009); Klimeš et al. (2010) to be inferior to certain GGAs for a range of systems where hydrogen bonds are present Jurečka et al. (2006); Li et al. (2008); Santra et al. (2008). This has lead to modifications of the method that have focused on both the exchange and correlation parts Vydrov and Van Voorhis (2009); Klimeš et al. (2010); Vydrov and Van Voorhis (2010a); Lee et al. (2010); Cooper (2010); Vydrov and Van Voorhis (2010b). With several functional forms proposed, it is important to test the methods on general reference test sets to uncover strengths and weaknesses and help further development. To this end we assess here the functionals using a test set of solid state properties of materials Staroverov et al. (2004). Apart from method assessment, this is also important since many of the applications of the vdW functionals lie outside of “soft matter”, involving, for example, adsorbates on solid surfaces. Indeed there has recently been a surge of interest in the application of vdW-DF to adsorption processes, including adsorption of water or of hydrocarbons on different surfaces Lazić et al. (2005); Chakarova-Käck et al. (2006); Sony et al. (2007); Johnston et al. (2008); Yanagisawa et al. (2008); Moses et al. (2009); Berland et al. (2009); Chen et al. (2010); Carrasco et al. (2011). Such studies will require a good description of the structural parameters of the substrate to accurately describe the systems of interest Feibelman (2008). The PBE lattice constant is usually employed in studies using revPBE-vdW, however, as we show here, the PBE and revPBE-vdW lattice constants can differ by several percent and the surface is therefore artificially strained.
There is at least one more reason to perform these tests: non-local correlations are thought to be important for solid state materials where the core electron densities have relatively large polarizability. For example, copper and gold have been subject to several studies Friedel (1952); Rehr et al. (1975); Richardson and Mahanty (1977), with the vdW contribution to binding estimated to be 0.2–0.6 eV for Cu and 0.6–1.2 eV for Au (i.e., up to 30% of the total atomization energy of bulk Au). There are only a handful of studies concerning heavy alkali metals (see, e.g., Ref. Upadhyaya and Wang, 1979), but it was found that dispersion needs to be included to make the bcc structure the most stable. More recently, the need to include non-local correlation in DFT semi-local functionals has been discussed for the heavy alkalis Tao et al. (2010).
Here we test the performance of several vdW functionals using a standard test of lattice constants, bulk moduli, and atomization energies of solids. Our test is similar to the test of Csonka et al. Csonka et al. (2009) and includes metals, ionic, and covalent materials. We include the original vdW-DF (referred to as revPBE-vdW herein), the recently proposed vdW-DF2 Murray et al. (2009); Lee et al. (2010) (referred to as rPW86-vdW2 herein), and two vdW functionals developed recently by us, optPBE-vdW and optB88-vdW Klimeš et al. (2010). We also propose a new exchange functional based on the B86b exchange Becke (1986) which gives an accuracy similar to the optB88 based vdW-DF on the S22 reference set of weakly bonded gas phase dimers Jurečka et al. (2006) and has an improved asymptotic behavior Murray et al. (2009). See Appendix A for more details of the optB86b exchange functional. This test, together with our previous study Klimeš et al. (2010), should give the reader a broad overview of the strengths and deficiencies of the vdW functionals that will hopefully lead to further developments.
The main outcomes of this study are: the revPBE-vdW and rPW86-vdW2 functionals significantly overestimate the lattice constants for most materials considered and the average absolute error is more than twice that of the optB88-vdW and optB86b-vdW functionals. The optB88-vdW and optB86b-vdW functionals give errors between that of PBEsol and PBE with optB86b-vdW giving smaller errors than optB88-vdW. This is because the exchange enhancement factor () of the optB88-vdW and optB86b-vdW functionals is between the of PBEsol and PBE for small reduced density gradients (). The optB88-vdW and optB86b-vdW functionals also almost halve the errors of PBE in atomization energies. optPBE-vdW improves over revPBE-vdW but not as much as optB88-vdW does. This behavior for the lattice constants is similar to that of binding curves and bond lengths; in all three cases the functionals with rapidly growing enhancement factors give on average longer equilibrium distances and agree less with the reference values than the functionals where follows the slowly varying gas limit for small .
In the next section we discuss the implementation of the vdW-DF method and details of the computational setup. The results are summarized in Sections III, IV, and V for lattice constants, bulk moduli, and atomization energies, respectively. We study the differences between local, semi-local, and non-local correlation functionals in Section VI. And finally in Section VII we discuss the implications of this study for further development of the vdW-DF methods.
II Computational setup
We have used the VASP Kresse and Hafner (1993); Kresse and Furthmüller (1996) code with our implementation of the vdW-DF correlation using the efficient algorithm of Román-Pérez and Soler Román-Pérez and Soler (2009). The vdW-DF term is calculated on the sum of the pseudo valence and partial electronic core charge densities, i.e., on the same density that is used to calculate the valence exchange-correlation energy in the projector-augmented wave (PAW) Blöchl (1994); Kresse and Joubert (1999) method in VASP. The use of the PAW method means that the calculation is all-electron frozen core (with PBE orbitals) for the exchange and the LDA correlation part of the exchange-correlation energy. The evaluation of the vdW correlation energy is done in a pseudopotential approximation. We test this approximation in Appendices B and C and find that it is very accurate. For example, the error in lattice constant is usually below 0.1%, slightly higher for materials with very small bulk moduli. Such differences are much smaller than the intrinsic errors of the exchange-correlation functionals themselves and smaller or comparable to differences between different codes Paier et al. (2006); Haas et al. (2009); Csonka et al. (2009); Harl et al. (2010) or potentials Mattsson et al. (2008). While to obtain high accuracy within the Román-Pérez and Soler scheme using the all-electron density a careful choice of parameters is required (discussed in Appendices B and C), the VASP calculations are accurate using less tight settings. For VASP calculations we use 30 interpolation points for the function with a saturation value . The vdW kernel uses a hard setting for the kernel short range softening which eliminates the need for the soft correction term (see Ref. Román-Pérez and Soler, 2009). Finally, we note that the algorithm utilizes the fine FFT grid and, except for the FFTs and summing of the energy, there is no other communication needed between the processes.
We employ a standard approach to calculate the solid properties. The energy is calculated for a set of lattice constant values and for each functional at least seven points around the lowest energy are used to fit the Murnaghan equation of state. The plane-wave basis cut-off is set to 750 eV (900 eV for solids containing C or F). To reduce errors, we have used the latest hard PAW potentials supplied with VASP Paier et al. (2005) with the highest number of valence electrons. For semiconductors and ionic solids (metals) a 888 (161616) Monkhorst-Pack k-point grid is used in the conventional unit cell. Our PBE lattice constants agree well with the VASP calculations of Paier et al. Paier et al. (2006) as well as with the all-electron reference PBE and PBEsol values of Haas et al. Haas et al. (2009). The reference calculations for atoms were performed in a large Å3 box; for spin polarized atoms we evaluate the term on the sum of the two spin-densities. The experimental reference values, corrected for zero point energy effects in the case of lattice constants and atomization energies, are taken from Refs. Csonka et al., 2009 and Perdew et al., 2009. The statistical values that we use to quantify the errors of the functionals are the mean error (ME) and the mean absolute error (MAE), as well as the relative versions of these quantities, namely mean relative error (MRE) and mean absolute relative error (MARE).
III Lattice Constants
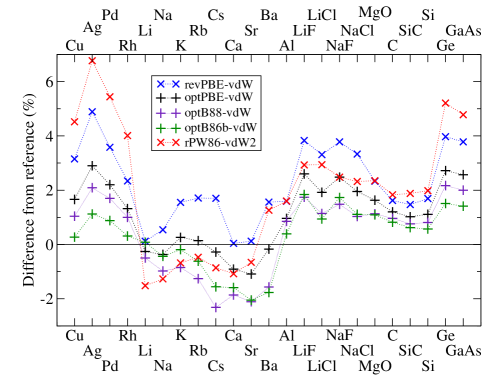
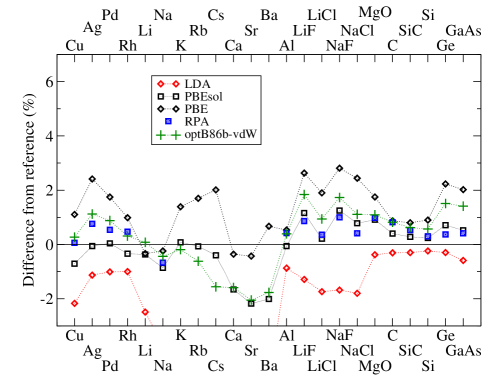
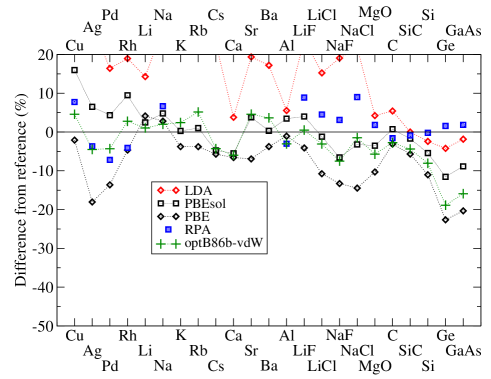
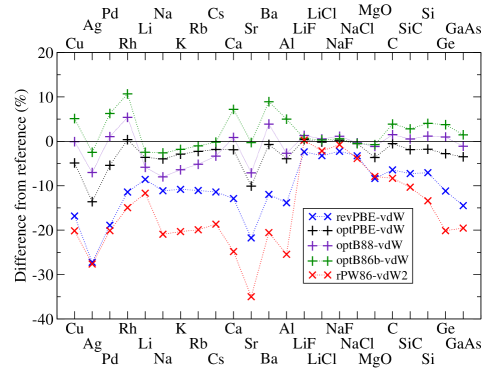
The lattice constants calculated with VASP are given in Table 1 and shown as relative errors in Figure 1. For comparison we also give the errors of LDA, PBE, and the PBEsol functional, one of the GGA functionals Armiento and Mattsson (2005); Wu and Cohen (2006); Madsen (2007); Perdew et al. (2008) devised for solid-state calculations. We also include the results of the adiabatic-connection fluctuation-dissipation theorem (ACFDT) in the random phase approximation (RPA) Langreth and Perdew (1975); Gunnarsson and Lundqvist (1976); Langreth and Perdew (1977) from Ref. Harl et al., 2010, which represents the state-of-the-art for solid state calculations. Before discussing the results in detail, let us just point out a striking feature of the results: the errors are not random and clear periodic trends are observed. All methods shown tend to give larger lattice constants for the transition metals, ionic solids, and semiconductors while the alkali and alkali earth lattices are too short. This seems to correspond to the tendency of functionals to give larger lattice constants when going from left to right in the periodic table Haas et al. (2009). This behavior does not seem to be improved by hybrid functionals Paier et al. (2006); Schimka et al. (2011) and is also present to some extent in the RPA lattice constants, although from the alkali and alkali earth metals only the data for Na has been published Harl et al. (2010). In fact, even the functionals designed for solids do not lead to a qualitative improvement of the lattice constants. For example, the difference between the largest and the smallest relative errors is similar for LDA, AM05, PBEsol, and PBE Haas et al. (2009).
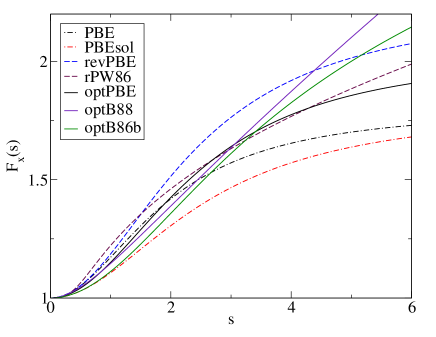
Let us now discuss the results of the vdW functionals. The two van der Waals functionals proposed by the Langreth and Lundqvist groups (revPBE-vdW and rPW86-vdW2) tend to give larger lattice constants (ME Å for revPBE-vdW and ME Å for rPW86-vdW2). While revPBE-vdW overestimates all values, rPW86-vdW2, rather surprisingly, underestimates the lattice constants of the alkali and alkali earth metals. The errors are as large as 5.0% (6.8%) for revPBE-vdW (rPW86-vdW2) in the case of Ag and large for other transition metals included as well as for Ge and GaAs. The large errors are similar to the overestimation of the binding distance that has been observed before for many systems Dion et al. (2004); Puzder et al. (2006); Chakarova-Käck et al. (2006); Ziambaras et al. (2007). This has been related to the too steep behavior of the exchange enhancement factor for small reduced density gradients which can be seen in Figure 2. Although originally both revPBE and rPW86 exchange functionals were selected because they give similar binding to Hartree-Fock for some gas phase dimers, at short separations these functionals are too repulsive Murray et al. (2009), which is important in hydrogen bonding and here for lattice constants.
The repulsion is largely decreased by utilising an exchange functional that has a less steeply rising and thus is less repulsive for short interatomic separations, such as the exchange functionals proposed in Ref. Klimeš et al., 2010 (see Figure 2). The optPBE-vdW is based on the PBE functional and it gives similar lattices to PBE for all the systems except for the alkali and alkali earth metals. For these metals, the vdW correlation term gives better agreement with the reference than the semi-local PBE correlation. The average errors are further reduced by using the optB88-vdW or optB86b-vdW functionals. However, for the alkalis the lattice constants become too short and this worsens progressively as the ion size increases. This might be caused by overestimation of the dispersion energy in the vdW functional Vydrov and Van Voorhis (2010a) or by the lack of higher order terms von Lilienfeld and Tkatchenko (2010). The optB88-vdW functional yields a mean error of Å. The mean absolute error of Å is comparable to the error of optPBE-vdW (MAE Å). The optB86b-vdW which, like PBEsol, follows the limit of slowly varying density for small , further improves the agreement with the reference (MAE Å) and performs in between PBEsol (MAE Å) and PBE (MAE Å).
Although it might be surprising at first sight that functionals optimized on interaction energies of gas phase dimers give very good lattice constants, it just highlights the connection between the influence of the exchange part on lattice constants, molecular bonds, and intermolecular binding curves Tran et al. (2007); Mattsson and Mattsson (2009). In all these cases the small behavior is able to alter the properties, and by following the slowly varying electron gas limit all these three measures tend to be improved.
Exchange revPBE rPW86 optPBE optB88 optB86b LDA PBEsol PBE Correlation vdW vdW2 vdW vdW vdW LDA PBEsol PBE Exp. (ZPEC) Cu 3.708 3.757 3.655 3.632 3.605 3.517 3.569 3.635 3.595 Ag 4.254 4.331 4.174 4.141 4.101 4.010 4.059 4.154 4.056 Pd 4.014 4.086 3.960 3.941 3.909 3.836 3.876 3.943 3.875 Rh 3.882 3.945 3.843 3.831 3.805 3.755 3.780 3.830 3.793 Li 3.453 3.396 3.440 3.432 3.452 3.363 3.436 3.437 3.449 Na 4.233 4.156 4.195 4.169 4.191 4.054 4.174 4.200 4.210 K 5.293 5.177 5.225 5.168 5.202 5.046 5.216 5.284 5.212 Rb 5.672 5.550 5.584 5.506 5.541 5.373 5.572 5.671 5.576 Cs 6.141 5.987 6.022 5.899 5.945 5.751 6.015 6.160 6.039 Ca 5.555 5.493 5.502 5.450 5.465 5.328 5.461 5.533 5.553 Sr 6.052 6.005 5.979 5.917 5.921 5.782 5.913 6.019 6.045 Ba 5.073 5.058 4.987 4.917 4.906 4.747 4.894 5.028 4.995 Al 4.084 4.084 4.058 4.054 4.036 3.985 4.018 4.041 4.020 LiF 4.116 4.080 4.067 4.033 4.037 3.913 4.010 4.068 3.964 LiCl 5.223 5.204 5.153 5.114 5.103 4.968 5.067 5.152 5.056 NaF 4.752 4.693 4.693 4.647 4.658 4.502 4.636 4.708 4.579 NaCl 5.750 5.694 5.673 5.622 5.627 5.465 5.609 5.701 5.565 MgO 4.281 4.282 4.252 4.231 4.230 4.168 4.222 4.257 4.184 C 3.600 3.608 3.585 3.577 3.572 3.532 3.557 3.574 3.543 SiC 4.406 4.424 4.386 4.375 4.369 4.329 4.354 4.377 4.342 Si 5.507 5.523 5.476 5.460 5.447 5.403 5.429 5.465 5.416 Ge 5.864 5.934 5.793 5.762 5.725 5.623 5.680 5.766 5.640 GaAs 5.851 5.908 5.783 5.751 5.717 5.605 5.667 5.752 5.638 ME (Å) 0.105 0.088 0.050 0.013 0.010 0.062 MAE (Å) 0.105 0.116 0.064 0.067 0.050 0.100 0.033 0.067 MRE (%) 2.3 2.0 1.1 0.4 0.3 1.3 MARE (%) 2.3 2.6 1.4 1.4 1.0 2.0 0.7 1.4
IV Bulk moduli
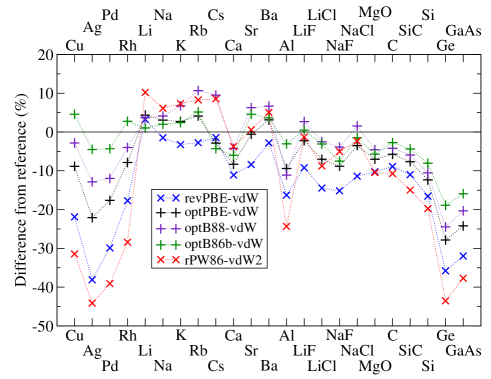
It is known that the results of a given functional for bulk moduli are related to the behavior for lattice constants. The shorter the predicted lattice constant, the higher the bulk modulus. The vdW functionals tend to follow this trend as can be seen from the data in Table 2 and the relative errors shown in Figure 3. The revPBE-vdW and rPW86-vdW2 functionals give too soft lattices, with the bulk moduli smaller by more than % for Ag, Pd, Ge, and GaAs. This correlates well with the overestimation of the lattice constant by more than 3% for these materials with revPBE-vdW and rPW86-vdW2.
There are several trends that one can observe, perhaps the clearest is the tendency of PBE and PBEsol to underestimate the bulk modulus with the increase of the ion size. This is most prominent for semiconductors, where it is clear that none of the vdW functionals alter this trend. On the other hand the RPA results do not suffer this deficiency. Importantly, this softening trend for alkali metals is improved by the vdW functionals. The reference experimental values were not adjusted for zero point energy effects which would slightly increase the reference values (up to 3% in the case of Li Csonka et al. (2009)). Let us then conclude that here again the optimized vdW functionals improve upon the original methods and they follow the trend expected from the errors in the lattice constants. Specifically, the average absolute errors increase in order PBEsol optB86b-vdW optB88-vdW PBE optPBE-vdW revPBE-vdW rPW86-vdW.
Exchange revPBE rPW86 optPBE optB88 optB86b LDA PBEsol PBE Correlation vdW vdW2 vdW vdW vdW LDA PBEsol PBE Exp. Cu 111 97 129 138 149 190 165 139 142 Ag 67 61 85 95 104 139 116 89 109 Pd 137 119 161 172 187 227 203 168 195 Rh 221 193 248 258 276 320 295 256 269 Li 13.7 14.7 13.9 13.8 13.4 15.2 13.6 13.9 13.3 Na 7.39 7.96 7.73 7.81 7.65 9.50 7.86 7.71 7.5 K 3.58 3.97 3.80 3.95 3.79 4.60 3.71 3.56 3.7 Rb 2.82 3.14 3.02 3.21 3.05 3.54 2.93 2.79 2.9 Cs 2.07 2.28 2.04 2.30 2.01 2.58 2.00 1.98 2.1 Ca 16.4 17.7 16.9 17.6 17.3 19.1 17.4 17.2 18.4 Sr 11.4 12.5 12.3 13.2 13.0 14.8 12.9 11.5 12.4 Ba 9.04 9.77 9.59 9.92 9.64 10.9 9.33 8.95 9.3 Al 67.1 60.6 72.4 71.1 77.4 83.8 82.1 78.6 79.4 LiF 63.4 68.9 68.2 71.7 70.2 86.5 72.6 66.9 69.8 LiCl 30.3 32.3 32.9 34.5 34.3 40.8 35.0 31.6 35.4 NaF 43.6 48.8 46.9 49.4 47.5 61.2 48.0 44.6 51.4 NaCl 23.6 26.0 25.7 27.0 26.2 32.4 25.8 22.8 26.6 MgO 148 148 153 157 156 172 159 148 165 C 404 395 418 424 431 467 446 429 443 SiC 200 191 208 212 215 225 221 212 225 Si 82.8 79.6 86.9 88.7 91.2 96.8 93.8 88.3 99.2 Ge 48.7 42.8 54.7 57.3 61.5 72.6 67.0 58.6 75.8 GaAs 51.4 47.1 57.3 60.2 63.6 74.2 68.9 60.2 75.6 ME (GPa) 10.3 1.6 MAE (GPa) 15.9 20.0 9.4 7.6 5.6 10.9 5.1 7.4 MRE (%) 14.5 0.1 MARE (%) 14.0 16.2 8.7 8.2 5.3 15.3 5.2 8.3
V Atomization energies of solids
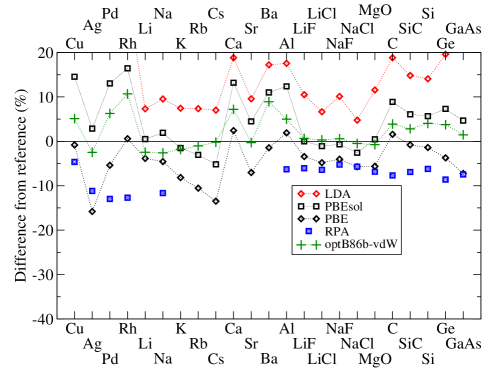
The calculated atomization energies for our selection of solids are presented in Table 3, and the relative errors are shown in Figure 4. Again we include for comparison, LDA, PBE, PBEsol, and RPA data in Figure 4. As can be seen the revPBE-vdW and rPW86-vdW2 functionals underestimate the atomization energies with average relative errors of 11.1% and 16.0%, respectively. This underestimation is similar to the overestimation of LDA (ME ). The optimized optPBE-vdW, optB88-vdW, and optB86b-vdW functionals give much improved results with the average relative errors of 3.0%, 1.3%, and 2.1%, respectively. In most cases the optimized functionals tend to give larger atomization energies and increase in the order optPBE-vdW, optB88-vdW, and optB86b-vdW. Only in the case of the alkali metals does optB88-vdW give less binding than optPBE-vdW which for these materials agrees well with the reference values.
Interestingly, when one compares the GGA and vdW correlation functionals, there seems to be some systematic improvement as well, most notably for the alkali metals. While the PBE atomization energies get progressively worse with the increase of the ion size, all the vdW functionals give errors of a similar magnitude. While one can observe a similar trend for PBE atomization energies of semiconductors, which is decreased by the optimized vdW functionals, PBEsol seems to improve over PBE as well. The atomization energies of the alkali halides calculated using the optimized vdW functionals are also in better agreement with the reference data than either PBE or PBEsol. The effect of different correlation functionals will be discussed more in the next section.
Exchange revPBE rPW86 optPBE optB88 optB86b LDA PBEsol PBE Correlation vdW vdW2 vdW vdW vdW LDA PBEsol PBE Exp. (ZPEC) Cu 2.93 2.81 3.35 3.52 3.70 4.55 4.04 3.49 3.52 Ag 2.16 2.15 2.57 2.76 2.90 3.64 3.06 2.50 2.97 Pd 3.18 3.13 3.71 3.96 4.16 5.08 4.43 3.71 3.92 Rh 5.12 4.92 5.81 6.10 6.40 7.67 6.73 5.82 5.78 Li 1.52 1.47 1.61 1.57 1.63 1.79 1.68 1.60 1.67 Na 1.01 0.90 1.09 1.04 1.10 1.24 1.15 1.08 1.13 K 0.84 0.75 0.91 0.88 0.92 1.01 0.93 0.86 0.94 Rb 0.76 0.69 0.84 0.81 0.85 0.92 0.83 0.77 0.86 Cs 0.72 0.66 0.80 0.79 0.81 0.87 0.77 0.70 0.81 Ca 1.62 1.40 1.82 1.88 1.99 2.21 2.11 1.90 1.86 Sr 1.36 1.13 1.56 1.61 1.73 1.90 1.81 1.61 1.73 Ba 1.68 1.52 1.90 1.99 2.08 2.24 2.12 1.88 1.91 Al 2.96 2.56 3.30 3.34 3.61 4.04 3.86 3.50 3.44 LiF 4.36 4.48 4.49 4.53 4.50 4.94 4.47 4.32 4.47 LiCl 3.47 3.51 3.58 3.61 3.60 3.83 3.55 3.42 3.59 NaF 3.89 3.95 4.00 4.02 4.00 4.38 3.95 3.82 3.98 NaCl 3.23 3.21 3.32 3.33 3.32 3.50 3.25 3.15 3.34 MgO 4.83 4.85 5.08 5.21 5.23 5.88 5.29 4.97 5.27 C 7.09 6.95 7.54 7.70 7.88 9.01 8.26 7.70 7.58 SiC 6.02 5.82 6.37 6.52 6.67 7.45 6.88 6.44 6.49 Si 4.35 4.05 4.60 4.74 4.87 5.34 4.95 4.62 4.68 Ge 3.43 3.09 3.76 3.90 4.01 4.62 4.15 3.72 3.86 GaAs 2.90 2.73 3.27 3.36 3.44 4.09 3.55 3.15 3.39 ME (eV) 0.00 0.10 0.56 0.20 MAE (eV) 0.25 0.46 0.09 0.07 0.12 0.56 0.22 0.13 MRE (%) 2.1 15.1 4.7 MARE (%) 11.1 16.0 3.1 2.9 3.2 15.1 6.0 5.0
VI The effect of non-local correlation
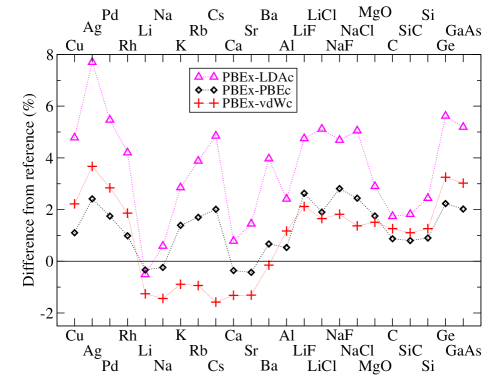
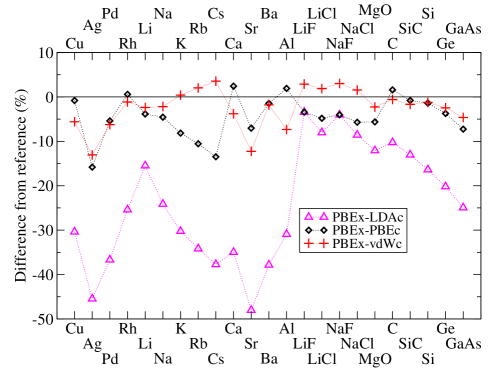
Although we know that the vdW-DF correlation form is only approximate, it is interesting to see what changes occur when semi-local correlation such as the PBE correlation (referred to as “PBEc”) is replaced by the non-local form of vdW. (The “vdW correlation” is the correlation energy). To study this change we have calculated the lattice constants using the PBE exchange functional (referred to as “PBEx”) and LDA, PBE, and vdW correlation functionals. This way we can directly compare the effect of adding PBE semi-local or vdW non-local corrections. Let us first present the results for the lattice constants in Figure 5. At first sight, the PBEx-PBEc and PBEx-vdWc give rather similar results, consistently decreasing the PBEx-LDAc lattice constantfoo . This means that an exchange functional which gives good results for solids with PBE correlation will tend to give good results with the vdW correlation as well. As we noted before, there is, however, a clear difference for the alkali metals, where the PBEx-PBEc gives progressively worse lattice constants with the increase of the ion size. This is even more pronounced for the atomization energies, shown in Figure 6, where PBEx-PBEc underbinding starts at only % for Li but worsens to % for Cs. This trend is clearly reversed by the vdW correlation, although too much. The tendency to underbind larger ions by semi-local functionals is analogous to the behavior of semi-local functionals for noble-gas dimers in the gas phase van Mourik and Gdanitz (2002). The interaction energy is obtained only from the region of electron density overlap and therefore does not scale in the same way as the size of the ion.
Careful observation reveals that the differences between PBE and vdW correlations are qualitatively similar for transition metals and semiconductors. The lattice constants are larger by 1% (except for the smaller semiconductors, where the difference is less) while the atomization energies have a smaller range of errors. It has been shown Harl and Kresse (2010); Harl et al. (2010) using RPA that out of the Rh, Pd, Ag group, electron correlation beyond Hartree-Fock-like exchange is the most important for Ag. With this in mind, it is satisfactory to see the decreased range of errors in atomization energies for this group, although the trend is not cured completely. Note that the trend in lattice constants is not improved and it would be actually worsened by using a hybrid functional Paier et al. (2006). Thus the semi-local PBE or non-local vdW correlation with semi-local or hybrid exchange seems to be unable to describe the delicate balance of the interactions in the late transition metals. For semiconductors PBEx-vdWc further increases the lattice constants compared to PBEx-PBEc. Since for these systems the non-local correlation is less important than the semi-local contribution, the results suggest that the semi-local part of the vdW correlation is effectively less attractive than PBEc. However, PBEx-PBEc worsens the atomization energies for solids with larger atoms where the vdW correlation improves the trend.
VII Discussion and Conclusions
In this study we have compared solid state properties obtained with different semi-local and non-local exchange-correlation functionals and we summarize the main results in Table 4. We have found that the particular choices of exchange functionals made by Langreth and Lundqvist and co-workers for the revPBE-vdW and rPW86-vdW2 functionals (i.e., revPBE and rPW86) lead to large overestimations of lattice constants and underestimations of bulk moduli and atomization energies for most of the solids considered. In addition, the errors have a wide range, e.g., rPW86-vdW2 underestimates the lattice constant of Li by 1.5% but overestimates the value for Ag by 6.7%. The atomization energies are underestimated by more than 0.3 eV on average. The optimized exchange functionals introduced in Ref. Klimeš et al., 2010 (i.e., optPBE-vdW and optB88-vdW) and the optB86b-vdW functional introduced here improve over revPBE-vdW and give lattice constants that are similar to those of PBE. This leads to similar improvements for the bulk moduli. From our study it seems that the vdW correlation functional does not improve dramatically over PBE except for the lattice constants of the alkali metals. This means that there is still some spread of the errors in the lattice constants which is not improved compared to PBE or PBEsol and further developments are required to reduce this range of errors. Importantly, the atomization energies seem to be qualitatively improved when a non-local correlation functional is used. This is most notable for the alkali metals, where PBE and PBEsol increasingly underbind with the increasing size of the ion but the vdW functionals suffer no such deficiency. Moreover, the atomization energies of ionic solids are in very good agreement with the experimental values.
PBE revPBE-vdW, rPW86-vdW2 Optimized exchange Lattice constants Worse than PBE Similar to or better than PBE MARE 1.4% 2.3% (revPBE-vdW) 1.4% (optB88-vdW) Atomization energies Worse than PBE Better than PBE MARE 5.0% 11.1% (revPBE-vdW) 2.9% (optB88-vdW)
Let us now discuss the results obtained here in a broader context. First, after the local and semi-local approximations, the non-local density functionals are the next logical step before the orbitals are introduced in the exchange-correlation energy such as is done in the RPA or hybrids. In this sense the non-local correlation functionals offer great promise. However, both revPBE-vdW and rPW86-vdW2 suffer from too much repulsion at short distances, a well known feature of revPBE-vdW for systems like the gas phase dimers Dion et al. (2004); Puzder et al. (2006); Lee et al. (2010). In this study we have shown that lattice constants of solids are subject to similar errors. This is a significant problem since accurate lattice constants are crucial for the predictive power of theory Feibelman (2008). One possible way to alleviate the problems is to change the exchange functional. We have shown that functionals with less steeply rising exchange enhancement factors for small will improve both results on the S22 set and, in this study, the lattice constants of solids. However, it is known that this change will reduce the accuracy for molecular atomisation energies and further development to alleviate this is required.
At a more fundamental level, the question of what form of exchange and correlation to use is still to be resolved. In principle one can try to find an exchange functional compatible with “dispersionless” interaction energies Pernal et al. (2009). Another approach might be to fit a functional to interaction energies based on the so called exact exchange (EXX) in the ACFDT formalism. This would allow the correlation part to be compared directly to the ACFDT correlation energy (e.g., in the RPA approximation). However, this might not be qualitatively that different from trying to reproduce HF binding curves. Moreover, the EXX energy depends on the single particle orbitals and the correlation part will be just . Therefore no “exact” correlation energy can be defined in this sense. Even defining using some choice of orbitals will mean that this needs to be reproduced by a given DFT functional which seems to be rather difficult. So far, even the form of semi-local correlation that should be used is an ongoing debate Dion et al. (2004); Vydrov et al. (2008). This includes the question of how much of the semi-local correlation energy the vdW correlation functional recovers. In this light, there is a need for reference systems to help the development, similar to GGA functionals where lattice constants, atomization energies, bond lengths, and other data have been extremely useful. The doubts and discussions concerning the vdW functionals just highlight the need for accurate reference data for gas phase clusters, adsorbates, solids, and so on. The approach of using quantum chemistry methods for the solid state Rościszewski et al. (1999); Li et al. (2008); Nolan et al. (2009); Tosoni and Sauer (2010); Jenness et al. (2010); Grueneis et al. (2010) is one that seems very useful and deserves more attention.
To conclude, we have calculated solid state properties of a set of solids using a self-consistent implementation of the vdW-DF method in the VASP code. We have shown that the method agrees well with all-electron data which are much more time consuming to obtain. The lattice constants of solids are, in analogy to what has been reported for gas phase dimers Dion et al. (2004); Puzder et al. (2006); Lee et al. (2010), too large with the original revPBE-vdW and rPW86-vdW2 methods but improved when optimized exchange functionals are used. Indeed, optB86b-vdW gives errors in lattice constants between PBE and PBEsol and thus yields accurate binding properties for gas phase clusters and also describes bulk materials well. The atomization energies of solids are considerably improved when the optimized functionals are used. This work provides some clear reference data as to how the vdW-DF family of functionals perform which should be useful in the further development of the method.
Acknowledgements.
A. M. is supported by the EURYI award scheme (see: www.esf.org/euryi), the EPSRC, and the European Research Council. DRB is supported by the Royal Society. We are grateful to the London Centre for Nanotechnology and UCL Research Computing for computational resources. Via our membership of the UK’s HPC Materials Chemistry Consortium, which is funded by EPSRC (EP/F067496), this work made use of the facilities of HECToR, the UK’s national high-performance computing service, which is provided by UoE HPCx Ltd at the University of Edinburgh, Cray Inc and NAG Ltd, and funded by the Office of Science and Technology through EPSRC’s High End Computing Programme.Appendix A optB86b
Here we briefly present the optB86b exchange functional, a more in depth discussion will be published elsewhere. From detailed studies of the exchange functionals and binding curves it became apparent that the behavior of the exchange enhancement factor () for small reduced density gradients () affects the position of the repulsive Pauli wall. Functionals with steeply increasing are more repulsive, and more importantly, start to be repulsive for longer distances than functionals with less steep or flat, like LDA. Therefore lattice constants tend to be longer when one goes from LDA to PBEsol to PBE to revPBE Mattsson et al. (2008); Haas et al. (2009) and similar observations can be made for equilibrium distances of gas phase clustes, e.g. the water dimer Santra et al. (2007); Mattsson and Mattsson (2009). This has been exploited in the PBEsol functional which decreases the average overestimation of the PBE equilibrium distances Perdew et al. (2008). In an analogous way the overestimation of the revPBE-vdW binding distances, observed for many systems, can be reduced by choosing a functional that rises less steeply for small . Using the same small behavior as PBEsol leads to a good agreement of the gas phase dimer binding curves with the reference data. For large , it has been suggested that should have behavior Murray et al. (2009). We modified the B86b exchange functional to obey these limits (although the second with a coefficient slightly different from the one suggested in Ref. Murray et al., 2009). The form of the optB86b functional is then and the function is shown in Figure 2. The optB86b-vdW gives almost the same results on the S22 dataset as the optB88-vdW functional, namely the mean absolute deviations are 12 meV for the total set and 13, 16, 6 meV for the hydrogen, dispersion, and mixed bonding subsets (using the reference data of Podeszwa et al. Podeszwa et al. (2010) on the geometries of Jurečka et al. Jurečka et al. (2006)). However, since this form has a less steeply rising for large than optB88, it is less repulsive for distances larger than optimum. This leads to a smaller error cancellation between exchange and the overestimated correlation than for the optB88-vdW functional.
Appendix B All electron density based lattice constants
Our tests comparing the approximate vdW evaluation in VASP to all-electron calculations show very good agreement between both approaches. However, it is not clear if reference quality calculations can be performed since the vdW energy depends on the PAW potential used. In this part we aim to obtain all-electron based lattice constants and then assess the accuracy of VASP against this benchmark. We start by showing that by utilising different PAW potentials the lattice constants differ. For example, we show lattice constants of Ge evaluated with three different PAW potentials in Table 5. The potentials are Ge with 4 valence electrons, Ge_d with 14 electrons, and a hard Ge_h with 14 electrons. One can see that the differences between the optB86b-vdW lattice constants cannot be completely attributed to the differences caused by the PAW potential, shown by the optB86b-LDA values. Therefore in the following we first test convergence of the various parameters involved. For this we use Ge because of its medium size and the fact that three different PAW potentials are available for it. Later, in Section B.2 we obtain the all-electron based data for the whole set.
Ge Ge_d Ge_h optB86b-LDA 5.857 5.842 5.845 optB86b-vdW 5.764 5.714 5.726 5.814 5.735 5.738 5.746 5.729 5.732 5.740 5.723 5.726
To calculate the all-electron vdW energy we use a standalone programme based on the vdW routines in SIESTA Soler et al. (2002); Artacho et al. (2008); Román-Pérez and Soler (2009). However, the calculation of the AE based lattice constants is not straightforward as several parameters need to be converged. Importantly, the AE density represented on a finite grid leads to numerical errors close to the ionic cores. Therefore we first smoothly cut the electron density around the cores and test the convergence of the other parameters. We then study the effect of the cut of the density. Furthermore, we test if the lattice constant can be evaluated using only the valence electron density. We use the lattice constant of Ge with the Ge_h PAW data set for the tests of the parameters.
B.1 Convergence tests
The efficient vdW algorithm introduces two basic parameters that control the quality of interpolation of the function: a cut-off and number of interpolation points . The vdW energy also depends on the underlying FFT grid and the density cut-off needed to avoid numerical errors close to the cores. The FFT grid is the most straightforward parameter to converge and we find that grid spacing around 0.03 Å can be considered converged, compared to grid spacing of 0.04 Å the lattice constant changes by only 0.002 Å.
20 30 40 50 5 5.751 5.749 5.748 5.748 10 5.740 5.734 5.731 5.730 18 7.505 5.733 5.732 5.732
The values of and affect the value of the lattice constant more significantly. As can be seen in Table 6, the lattice constant seems to converge when both and are increased. The values of , give results that are in a very good agreement with the lattice constants obtained with either or increased. Moreover, the values are almost identical to the values obtained with . We therefore now set and study how the lattice constant depends on the density cut-off and . Table 7 shows that the values first converge when is increased up to 40, further increase, to and , gives oscillating values. This is more pronounced with higher density cut-offs. This seems to be caused by “overinterpolation” of the function, which would be probably less severe with an even denser grid. However, there seems to be no point in doing this since the calculations using , agree with more stringent settings to within 0.001 Å. Therefore, to obtain the reference lattice constants, we use density cut-off 20 a.u., , , and FFT grid with fine spacing around 0.03 Å. Since increasing is computationally demanding, we use the values , in VASP calculations.
(a.u.) 20 30 40 50 80 20 5.740 5.734 5.731 5.730 5.733 100 5.734 5.734 5.731 5.725 5.742 1000 5.738 5.733 5.730 5.728 5.747
Before calculating the lattice constant on the whole solid state test, we present two alternative approaches to the calculation. First, it turns out that the problematic part of the calculation that makes the direct evaluation of the vdW energy impractical is the soft correction term, introduced in Ref. Román-Pérez and Soler, 2009. However, the lattice constants calculated with or without this term are virtually identical when the electron density is cut and a “hard” vdW kernel is used (c.f. the data in Table 8 and Table 7). Therefore one can use the all-electron density to evaluate the lattice constant if the soft correction is not added. However, as the data for large in Table 8 suggest, there is some numerical noise introduced from the interpolation as well. Despite this, the difference in the lattice constants of the all-electron smoothed density and the all-electron density without the soft correction is very small (%).
(a.u.) 20 30 40 50 80 20 5.736 5.734 5.731 5.730 5.733 100 5.731 5.734 5.731 5.725 5.742 1000 5.732 5.731 5.728 5.726 5.743 5.732 5.731 5.728 5.726 5.743
It is also interesting to try to use the real valence density (i.e. not the pseudo valence density) to obtain the lattice constant. In this case the lattice constant converges quickly with all the parameters and, in the case of Ge, the converged value is 5.737 Å, slightly larger than the 5.732 Å obtained with the all-electron density. As we shall see, the agreement for other materials strongly depends on the number of electrons included in the valence shell.
Let us now summarize the results and compare the lattice constants obtained using the softer potentials as well. We compare the VASP calculations to the real valence, and all-electron with and without electron density cut-off in Table 5. Since we want to be able to compare to our VASP implementation we use and . One can notice that the changes in the all-electron lattice constants ( and ) correspond well to the respective changes in the optB86b-LDA values. The real valence calculation () without the electrons gives too a large lattice constant, the difference is almost halved in the case of the VASP calculation where the partial electronic core charge is added as well. Therefore we can expect a very good agreement of the VASP and all-electron data for PAW potentials that are either hard or contain more than one electronic shell.
B.2 Comparison on the whole set
Now we proceed to calculate the lattice constants of the chosen solids using the approaches shown above. This allows us to test if we need to use the quite cumbersome all-electron evaluation or if VASP can be used. We use several ways to estimate the lattice parameter: first, we calculate it directly from VASP using the approximated . Second, the real valence density is used, third, the all-electron density without the soft correction. Finally, the vdW energy is calculated on the all-electron density with a density cut-off imposed to avoid numerical errors. The VASP implementation uses interpolation points with , the real valence and all-electron calculations use interpolation points and . The number of FFT grid points is set by hand to a large number so that the integration grid spacing is 0.03 Å.
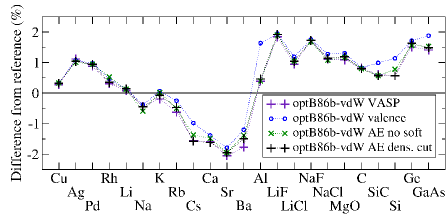
The lattice constants using optB86b-vdW are collected in Table 9 and shown in Figure 7. One can see that the data obtained with VASP (violet ) are in a very good agreement with the all-electron calculations (black ) that use smoothed electron density. This then justifies the approximations involved in the evaluation of the vdW correlation energy in VASP. The calculations without the soft-correction (green ) on the all-electron density are generally very similar to the smoothed density calculations. As we have shown earlier, this seems to come more from the representation of the electron density on the finite grid. We find the largest deviations from the AE results for alkali and alkali earth metals, which are very sensitive to the errors in the vdW correction because of their small bulk moduli. This means that the lattice constant calculated with the all-electron density has some error and the very good agreement between the VASP and AE calculations for Cs might be accidental, the trend towards shortening the lattices with the increased size of the ion is not affected. For the other materials the differences are below 0.1%, i.e., the results differ only at the third decimal place in most cases. This level of accuracy of our VASP calculations is more than sufficient to recover the trends and also similar to or better than the differences for the same solid and functional obtained with different codes Csonka et al. (2009).
An interesting approach which would circumvent the problematic calculation of the AE vdW correction would be to use the real valence density to calculate . However, lattice constants obtained with this approach (blue circles in Figure 7) are slightly larger than the AE ones. This difference seems to crucially depend on the number of shells included in the valence, this is supported by the fact that the largest errors are observed for Al (3 electrons in valence), Si (4), and As (5). Although the valence electron density based data can’t be used to obtain a reliable lattice constant in some cases, they seem to give a good upper bound of the AE based values.
Solid VASP Exp.(ZPEC) 30 40 40 40 – 10 10 10 10 – 20 – Cu 3.605 3.607 3.607 3.606 3.595 Rh 3.805 3.811 3.813 3.806 3.793 Pd 3.909 3.913 3.912 3.912 3.875 Ag 4.101 4.100 4.097 4.098 4.056 Li 3.452 3.454 3.454 3.454 3.449 Na 4.191 4.194 4.185 4.191 4.210 K 5.202 5.215 5.213 5.208 5.212 Rb 5.541 5.562 5.548 5.550 5.576 Cs 5.945 5.980 5.956 5.944 6.039 Ca 5.465 5.476 5.471 5.463 5.553 Sr 5.921 5.937 5.927 5.927 6.045 Ba 4.906 4.935 4.926 4.920 4.995 Al 4.036 4.086 4.036 4.038 4.020 LiF 4.037 4.041 4.039 4.040 3.964 LiCl 5.103 5.116 5.109 5.109 5.056 NaF 4.658 4.660 4.656 4.658 4.579 NaCl 5.627 5.636 5.625 5.628 5.565 MgO 4.230 4.239 4.233 4.234 4.184 C 3.572 3.573 3.571 3.571 3.543 SiC 4.369 4.385 4.367 4.367 4.342 Si 5.447 5.478 5.458 5.447 5.416 Ge 5.725 5.737 5.728 5.731 5.640 GaAs 5.717 5.744 5.724 5.722 5.638
Appendix C All electron atomization energies
To assess the validity of our implementation and to evaluate its accuracy we calculate the atomization energies of the solids within VASP and with the all-electron post-processing correction. A self-consistent calculation using optB86b-vdW is done for the solid close to the energy minimum and the respective atom or atoms in a large rectangular box (with approximately two times larger sides). From this calculation we obtain the approximate . In the next step, the all-electron density from the VASP calculation is used to evaluate . By subtracting the solid energies per atom from the atomic ones, we obtain the non-local contribution to the atomization energy for these two approaches which we can compare. The results are summarized in Table 10 where we show the contribution to binding from VASP and from the all-electron calculations with and without the soft-correction, along with the total atomization energy. The agreement is very good overall with the errors in the total atomization energies below 2%. The soft-correction is not calculated in VASP, however, its effect on the atomization energies is negligible.
As was shown in the case of lattice constants the all-electron density based strongly depends on the underlying grid and high density regions need to be cut. The problem is less severe in the case of atomization energies where we use exactly the same grid spacing for the solid and atomic calculations so that numerical inaccuracies cancel out. In most cases the calculations with cut density give the same vdW contribution to the atomization energy (to within a meV). In a few cases the contribution differs slightly (by up to 30 meV for Pd), and therefore we give the results calculated with the electron density cut above 100 a.u. in Table 10.
VASP ae ae, no soft Cu 3.679 0.941 0.933 0.935 Ag 2.887 1.097 1.063 1.065 Pd 4.160 1.309 1.259 1.261 Rh 6.385 1.498 1.430 1.433 Li 1.203 0.155 0.153 0.155 Na 0.923 0.221 0.221 0.222 K 0.832 0.281 0.275 0.276 Rb 0.762 0.314 0.301 0.303 Cs 0.743 0.355 0.340 0.342 Ca 1.940 0.584 0.569 0.571 Sr 1.691 0.638 0.616 0.617 Ba 2.036 0.739 0.711 0.713 Al 3.488 0.799 0.750 0.752 LiF 4.410 0.273 0.267 0.268 LiCl 3.489 0.375 0.369 0.370 NaF 3.959 0.270 0.268 0.269 NaCl 3.239 0.359 0.356 0.357 MgO 5.189 0.533 0.523 0.524 C 7.910 0.772 0.745 0.747 SiC 6.669 0.767 0.737 0.738 Si 4.836 0.741 0.712 0.714 Ge 4.003 0.752 0.733 0.734 GaAs 3.442 0.741 0.717 0.718
References
- Andersson et al. (1996) Y. Andersson, D. C. Langreth, and B. I. Lundqvist, Phys. Rev. Lett. 76, 102 (1996).
- Dobson and Dinte (1996) J. F. Dobson and B. P. Dinte, Phys. Rev. Lett. 76, 1780 (1996).
- Dion et al. (2004) M. Dion, H. Rydberg, E. Schröder, D. C. Langreth, and B. I. Lundqvist, Phys. Rev. Lett. 92, 246401 (2004).
- von Lilienfeld et al. (2004) O. A. von Lilienfeld, I. Tavernelli, U. Rothlisberger, and D. Sebastiani, Phys. Rev. Lett. 93, 153004 (2004).
- Antony and Grimme (2006) J. Antony and S. Grimme, Phys. Chem. Chem. Phys. 8, 5287 (2006).
- Becke and Johnson (2007) A. D. Becke and E. R. Johnson, J. Chem. Phys. 127, 154108 (2007).
- Grimme et al. (2007) S. Grimme, J. Antony, T. Schwabe, and C. Mück-Lichtenfeld, Org. Biomol. Chem. 5, 741 (2007).
- Sato et al. (2007) T. Sato, T. Tsuneda, and K. Hirao, J. Chem. Phys. 126, 234114 (2007).
- Tkatchenko and Scheffler (2009) A. Tkatchenko and M. Scheffler, Phys. Rev. Lett. 102, 073005 (2009).
- Sato and Nakai (2010) T. Sato and H. Nakai, J. Chem. Phys. 131, 224104 (2010).
- Sato and Nakai (2010) T. Sato and H. Nakai, J. Chem. Phys. 133, 194101 (2010).
- Zhang and Yang (1998) Y. Zhang and W. Yang, Phys. Rev. Lett. 80, 890 (1998).
- Gulans et al. (2009) A. Gulans, M. J. Puska, and R. M. Nieminen, Phys. Rev. B 79, 201105(R) (2009).
- Kelkkanen et al. (2009) A. K. Kelkkanen, B. I. Lundqvist, and J. K. Nørskov, J. Chem. Phys. 131, 046102 (2009).
- Klimeš et al. (2010) J. Klimeš, D. R. Bowler, and A. Michaelides, J. Phys.: Cond. Matt. 22, 022201 (2010).
- Jurečka et al. (2006) P. Jurečka, J. Šponer, J. Černý, and P. Hobza, Phys. Chem. Chem. Phys. 8, 1985 (2006).
- Li et al. (2008) B. Li, A. Michaelides, and M. Scheffler, Surf. Sci. 602, L135 (2008).
- Santra et al. (2008) B. Santra, A. Michaelides, M. Fuchs, A. Tkatchenko, C. Filippi, and M. Scheffler, J. Chem. Phys. 129, 194111 (2008).
- Vydrov and Van Voorhis (2009) O. A. Vydrov and T. Van Voorhis, Phys. Rev. Lett. 103, 063004 (2009).
- Vydrov and Van Voorhis (2010a) O. A. Vydrov and T. Van Voorhis, Phys. Rev. A 81, 062708 (2010a).
- Lee et al. (2010) K. Lee, E. D. Murray, L. Kong, B. I. Lundqvist, and D. C. Langreth, Phys. Rev. B 82, 081101 (2010).
- Cooper (2010) V. R. Cooper, Phys. Rev. B 81, 161104 (2010).
- Vydrov and Van Voorhis (2010b) O. A. Vydrov and T. Van Voorhis, J. Chem. Phys. 133, 244103 (2010b).
- Staroverov et al. (2004) V. N. Staroverov, G. E. Scuseria, J. Tao, and J. P. Perdew, Phys. Rev. B 69, 075102 (2004).
- Lazić et al. (2005) P. Lazić, Ž. Crljen, R. Brako, and B. Gumhalter, Phys. Rev. B 72, 245407 (2005).
- Chakarova-Käck et al. (2006) S. D. Chakarova-Käck, E. Schröder, B. I. Lundqvist, and D. C. Langreth, Phys. Rev. Lett. 96, 146107 (2006).
- Sony et al. (2007) P. Sony, P. Puschnig, D. Nabok, and C. Ambrosch-Draxl, Phys. Rev. Lett. 99, 176401 (2007).
- Johnston et al. (2008) K. Johnston, J. Kleis, B. I. Lundqvist, and R. M. Nieminen, Phys. Rev. B 77, 121404 (2008).
- Yanagisawa et al. (2008) S. Yanagisawa, K. Lee, and Y. Morikawa, J. Chem. Phys. 128, 244704 (2008).
- Moses et al. (2009) P. G. Moses, J. J. Mortensen, B. I. Lundqvist, and J. K. Norskov, J. Chem. Phys. 130, 104709 (2009).
- Berland et al. (2009) K. Berland, T. L. Einstein, and P. Hyldgaard, Phys. Rev. B 80, 155431 (2009).
- Chen et al. (2010) H. Chen, G. A. Voth, and N. Agmon, J. Phys. Chem. B 114, 333 (2010).
- Carrasco et al. (2011) J. Carrasco, B. Santra, J. Klimeš, and A. Michaelides, Phys. Rev. Lett. 106, 026101 (2011).
- Feibelman (2008) P. J. Feibelman, Phys. Chem. Chem. Phys. 10, 4688 (2008).
- Friedel (1952) J. Friedel, Proc. Phys. Soc. B 65, 769 (1952).
- Rehr et al. (1975) J. J. Rehr, E. Zaremba, and W. Kohn, Phys. Rev. B 12, 2062 (1975).
- Richardson and Mahanty (1977) D. D. Richardson and J. Mahanty, J. Phys. C: Solid State Phys. 10, 3971 (1977).
- Upadhyaya and Wang (1979) J. C. Upadhyaya and S. Wang, Phys. Lett. 73A, 238 (1979).
- Tao et al. (2010) J. Tao, J. P. Perdew, and A. Ruzsinszky, Phys. Rev. B 81, 233102 (2010).
- Csonka et al. (2009) G. I. Csonka, J. P. Perdew, A. Ruzsinszky, P. H. T. Philipsen, S. Lebègue, J. Paier, O. A. Vydrov, and J. G. Ángyán, Phys. Rev. B 79, 155107 (2009).
- Murray et al. (2009) E. D. Murray, K. Lee, and D. C. Langeth, J. Chem. Theo. Comput. 5, 2754 (2009).
- Becke (1986) A. D. Becke, J. Chem. Phys. 85, 7184 (1986).
- Kresse and Hafner (1993) G. Kresse and J. Hafner, Phys. Rev. B 47, 558 (1993).
- Kresse and Furthmüller (1996) G. Kresse and J. Furthmüller, Comp. Mater. Sci. 6, 15 (1996).
- Román-Pérez and Soler (2009) G. Román-Pérez and J. M. Soler, Phys. Rev. Lett. 103, 096102 (2009).
- Blöchl (1994) P. E. Blöchl, Phys. Rev. B 50, 17953 (1994).
- Kresse and Joubert (1999) G. Kresse and J. Joubert, Phys. Rev. B 59, 1758 (1999).
- Paier et al. (2006) J. Paier, M. Marsman, K. Hummer, G. Kresse, I. C. Gerber, and J. G. Ángyán, J. Chem. Phys. 124, 154709 (2006).
- Haas et al. (2009) P. Haas, F. Tran, and P. Blaha, Phys. Rev. B 79, 085104 (2009).
- Harl et al. (2010) J. Harl, L. Schimka, and G. Kresse, Phys. Rev. B 81, 115126 (2010).
- Mattsson et al. (2008) A. E. Mattsson, R. Armiento, J. Paier, G. Kresse, J. M. Wills, and T. R. Mattsson, J. Chem. Phys. 128, 084714 (2008).
- Paier et al. (2005) J. Paier, R. Hirschl, M. Marsman, and G. Kresse, J. Chem. Phys. 122, 234102 (2005).
- Perdew et al. (2009) J. P. Perdew, A. Ruzsinszky, G. I. Csonka, L. A. Constantin, and J. Sun, Phys. Rev. Lett. 103, 026403 (2009).
- Armiento and Mattsson (2005) R. Armiento and A. E. Mattsson, Phys. Rev. B 72, 085108 (2005).
- Wu and Cohen (2006) Z. Wu and R. E. Cohen, Phys. Rev. B 73, 026403 (2006).
- Madsen (2007) G. K. H. Madsen, Phys. Rev. B 75, 195108 (2007).
- Perdew et al. (2008) J. P. Perdew, A. Ruzsinszky, G. I. Csonka, O. A. Vydrov, G. E. Scuseria, L. A. Constantin, X. Zhou, and K. Burke, Phys. Rev. Lett. 100, 136406 (2008).
- Langreth and Perdew (1975) D. C. Langreth and J. P. Perdew, Solid State Commun. 17, 1425 (1975).
- Gunnarsson and Lundqvist (1976) O. Gunnarsson and B. I. Lundqvist, Phys. Rev. B 13, 4274 (1976).
- Langreth and Perdew (1977) D. C. Langreth and J. P. Perdew, Phys. Rev. B 15, 2884 (1977).
- Schimka et al. (2011) L. Schimka, J. Harl, and G. Kresse, J. Chem. Phys. 134, 024116 (2011).
- Puzder et al. (2006) A. Puzder, M. Dion, and D. C. Langreth, J. Chem. Phys. 124, 164105 (2006).
- Ziambaras et al. (2007) E. Ziambaras, J. Kleis, E. Schröder, and P. Hyldgaard, Phys. Rev. B 76, 155425 (2007).
- von Lilienfeld and Tkatchenko (2010) O. A. von Lilienfeld and A. Tkatchenko, J. Chem. Phys. 132, 234109 (2010).
- Tran et al. (2007) F. Tran, R. Laskowski, P. Blaha, and K. Schwarz, Phys. Rev. B 75, 115131 (2007).
- Mattsson and Mattsson (2009) A. E. Mattsson and T. R. Mattsson, J. Chem. Theory Comput. 5, 887 (2009).
- (67) Although LDA is known to give shorter lattice constants, this is because of the exchange part, LDA correlation is underbinding.
- van Mourik and Gdanitz (2002) T. van Mourik and R. J. Gdanitz, J. Chem. Phys. 116, 9620 (2002).
- Harl and Kresse (2010) J. Harl and G. Kresse, Phys. Rev. Lett. 103, 056401 (2010).
- Pernal et al. (2009) K. Pernal, R. Podeszwa, K. Patkowski, and K. Szalewicz, Phys. Rev. Lett. 103, 263201 (2009).
- Vydrov et al. (2008) O. A. Vydrov, Q. Wu, and T. Van Voorhis, J. Chem. Phys. 129, 014106 (2008).
- Rościszewski et al. (1999) K. Rościszewski, B. Paulus, P. Fulde, and H. Stoll, Phys. Rev. B 60, 7905 (1999).
- Nolan et al. (2009) S. J. Nolan, M. J. Gillan, D. Alfè, N. L. Allan, and F. R. Manby, Phys. Rev. B 80, 165109 (2009).
- Tosoni and Sauer (2010) S. Tosoni and J. Sauer, Phys. Chem. Chem. Phys. 12, 14330 (2010).
- Grueneis et al. (2010) A. Grueneis, M. Marsman, and G. Kresse, J. Chem. Phys. 133, 074107 (2010).
- Jenness et al. (2010) G. R. Jenness, O. Karalti, and K. D. Jordan, Phys. Chem. Chem. Phys. 12, 6375 (2010).
- Santra et al. (2007) B. Santra, A. Michaelides, and M. Scheffler, J. Chem. Phys. 127, 184104 (2007).
- Podeszwa et al. (2010) R. Podeszwa, K. Patkowski, and K. Szalewicz, Phys. Chem. Chem. Phys. 12, 5974 (2010).
- Soler et al. (2002) J. M. Soler, E. Artacho, J. D. Gale, A. García, J. Junquera, P. Ordejón, and D. Sánchez-Portal, J. Phys.: Cond. Matt. 14, 2745 (2002).
- Artacho et al. (2008) E. Artacho, E. Anglada, O. Diéguez, J. D. Gale, A. García, J. Junquera, R. M. Martin, P. Ordejón, J. M. Pruneda, D. Sánchez-Portal, et al., J. Phys.: Cond. Matt. 20, 064208 (2008).