SN 2008gz most likely a normal type IIP event
Abstract
We present photometric and low-resolution spectroscopic investigation of a type II core-collapse supernova (SN) 2008gz, which occurred in a star forming arm and within a half-light radius (solar metallicity region) of a nearby spiral galaxy NGC 3672. The SN event was detected late, and a detailed investigation of its light curves and spectra spanning 200 days suggest that it is an event of type IIP similar to archetypal SNe 2004et and 1999em. However, in contrast to other events of its class, the SN 2008gz exhibits rarely observed magnitude drop of 1.5 over the period of a month during plateau to nebular phase. Using 0.21 mag of as a lower limit and a distance of 25.5 Mpc, we estimate synthesized 56Ni mass of M⊙ and a mid-plateau of mag. The photospheric velocity is observed to be higher than that was observed for SN 2004et at similar epochs, indicating explosion energy was comparable to or higher than SN 2004et. Similar trend was also seen for the expansion velocity of H-envelopes. By comparing its properties with other well studied events as well as by using a recent simulation of pre-SN models of Dessart, Livne & Waldman (2010), we infer an explosion energy range of erg and this coupled with the observed width of the forbidden [O i] 6300-6364Å line at 275 days after the explosion gives an upper limit for the main-sequence (non-rotating, solar metallicity) progenitor mass of 17 M⊙. Our narrow-band H observation, taken nearly 560 days after the explosion and the presence of an emission kink at zero velocity in the Doppler corrected spectra of SN indicate that the event took place in a low luminosity star forming H ii region.
keywords:
supernovae: general supernovae: individual: SN 2008gz galaxies: individual: NGC 36721 introduction
Core-collapse supernovae occur in late type galaxies and their locations are usually associated with the regions of high stellar surface brightness or recent/ongoing star formation, suggesting that they represent the end stages of massive stars ( 8 –10 M☉) (Anderson & James, 2009; Hakobyan et al., 2009). Observationally, these events are classified into H-rich type II SNe which show prominent H-lines in their optical spectra, and H-deficient type Ib/c SNe which don’t show the trace of H-lines. Ic events lack He-lines as well. Type II SNe constitute about 70% of all the core-collapse SNe (Cappellaro et al., 1999; Smith et al., 2009) and their light curves and spectra differ significantly. In type IIP, the optical light remains constant for about 100 days (called the plateau phase) and then decays exponentially. The spectra are featured due to strong P-cygni profiles, while in type IIL SNe, a linear decline in its optical light and strong emission lines are observed. Type IIn events show narrow emission lines (Filippenko, 1997; Smartt et al., 2009a).
Theoretically, the explosion mechanism consists of the collapse of the progenitor star’s Fe-core, formation of a shock wave, the ejection of stellar envelope and formation of a neutron star or a black hole. The shock wave generated through the reversal of core-collapse, breaks out the stellar surface of progenitor as a hot fireball flashes in X-ray and ultraviolet continuing from a few seconds to a few days. In H-rich events, the shock-heated expanding stellar envelope cools down, by recombination of H and sustains the plateau phase of IIP SNe, while the post-maxima/plateau light curves are powered by the radioactive decay of 56Co into 56Fe. Though the explosion mechanism is similar to these events, they differ largely in energetics, e.g. IIP SNe are observed to form a sequence from low-luminosity, low-velocity, Ni-poor events to bright, high-velocity, Ni-rich objects (Hamuy, 2003). Thus, a detailed investigation of individual core-collapse events is important for understanding the nature and environment of progenitors. They generally probe the star formation processes, galactic chemical evolution and constrain the stellar evolutionary models (Heger et al., 2003; Smartt, 2009b; Habergham, Anderson & James, 2010). Type IIP SNe also turned out to be good standardizable candles (Hamuy, 2002; Poznanski et al., 2009; Olivares et al., 2010).
The SN 2008gz event was discovered on November 5.83 UT, 2008 by Koichi Itagaki using a 0.6m telescope in the spiral galaxy NGC 3672 at an unfiltered magnitude of about 16.2. On November 7.84 and 8.84 UT, an independent discovery of this new transient was reported by R. Martin from Perth Observatory as a part of “Perth Automated Supernova Search Program” by using 0.6m Lowell Telescope. The red magnitude of this new object was about 15.5 (Nakano & Martin, 2008). On November 11.25 UT, Benetti et al. (2008) took the first spectra of this event with the 3.5m TNG (+ DOLORES; range 340-800 nm, resolution 1.0 nm) and showed that it is a type II supernova event and by using GELATO tool (Harutyunyan et al., 2008), they found that the spectrum of SN 2008gz resembles best with that of a II-peculiar event SN 1998A, taken at 62 days after explosion (Pastorello et al., 2005). Assuming the recession velocity of the host galaxy 1862 , they found the expansion velocity of hydrogen layer was about 6600 . An independent regular CCD photometric monitoring of SN 2008gz was carried out since November 10, 2008 by using 1m Sampurnanand Telescope at Nainital, India. We also collected spectra in optical () with 2m IUCAA, India; 3.6m NTT, Chile; 6m BTA, Russia; 3.6m TNG, Spain.
In this work, we present results of optical photometric and low-resolution spectroscopic investigation of SN 2008gz. We adopt time of explosion to be August 20.0, 2009 or JD 2454694.0 having uncertainty of a few days (see §2.2 for details). Hence the time of post/pre-explosion are rounded off to nearest day and they are referred with and signs respectively. Basic properties of SN 2008gz and its host galaxy NGC 3672 are given in Table 1. The paper is organized as follows. §2 and §3 present the photometric and spectroscopic observations and a brief description of light curves and spectra. In §4 we study evolution of some important line profiles, where as in §5, the velocity of the photosphere and the H-ejecta is estimated by using SYNOW code (Branch, Baron & Jeffery, 2001; Branch et al., 2002; Baron, 2005) that describes spectroscopic observations. Distance, extinction and the evolution of colour and bolometric luminosity are studied in §6 and §7 respectively. The amount of synthesized 56Ni mass, environment and energetics of the progenitor are estimated and discussed in §8. We also made a comparative study of this event with other type IIP SNe in §9. At last a summary is presented in §10.
| Parameters | Value | Ref.a |
| NGC 3672: | ||
| Type | SAc | 1 |
| RA (J2000) | 1 | |
| DEC (J2000) | 1 | |
| Abs. Magnitude | mag | 1 |
| Distance | Mpc | §6 |
| Scale | pc, kpc | |
| Distance modulus | ||
| Apparent radius | 1 | |
| Inclination angle | 1 | |
| Position angle | 1 | |
| Heliocentric Velocity | 1 | |
| SN 2008gz: | ||
| RA (J2000) | 2 | |
| DEC (J2000) | 2 | |
| Location | 13″ E, 7″ S | 2 |
| Deprojected radius | ( 2.81 kpc) | §8.2 |
| Explosion epoch (UT) | 20.0 August 2008 | §2.2 |
| (JD 2454694.0) | ||
| Discovery date (UT) | 5.83 November 2008 | 2 |
a (1) HyperLEDA - http://leda.univ-lyon1.fr; (2) Nakano & Martin (2008)
2 Broad band photometry
2.1 data
Initial pre-SN images (– 403d) of the host galaxy NGC 3672 at bands were obtained from Perth Observatory, as a part of supernova search program for another type Ia SN 2007bm, which occured in the same galaxy. Images were taken with 512 512 CCD camera mounted on a 0.6m Lowell Telescope, covering around square arcmin on the sky. The FWHM seeing was about 25.
SN 2008gz was observed at different epochs from different observatories around the world. The major part of monitoring was carried out in Johnson and Cousins bands from 1m Telescope (ST)111 We used a 2048 2048 CCD camera having a square pixel of 24 mounted at the f/13 Cassegrain focus of the telescope. Plate scale of the CCD chip is 0.38 arcsec per pixel, and the entire chip covers a field of 13 13 square arcmin on the sky. The gain and readout noise of the CCD camera are 10 per analog-to-digital unit and 5.3 respectively. All the observations were carried out in the binning mode of 22 pixel. at the Aryabhatta Research Institute of Observational Sciences (ARIES), Nainital, India. SN 2008gz was observed during 10 November 2008 (+87d) to 17 May 2009 (+275d). We could not detect SN in the observations of 19 November (+462d) in , of 13 February 2010 (+547d) in and of 14 February 2010 (+548d) in . In addition to 1m ST, observations of SN 2008gz at bands were also obtained on 21, 22, 24 and 25 March 2009, with IFOSC mounted on 2m IGO, IUCAA, India and on 17 May 2009 with EFOSC2 mounted on 3.6m NTT, ESO, Chile. The journal of observations is given in Table 2222Table 2 is only available in electronic form..
| UT Date | JD | Phase | Telescope | Seeing | Ellipticity | ||||
| (yy/mm/dd) | 2454000+ | (day) | (s) | (s) | (s) | (s) | (″) | ||
| 2007/07/09 | 290.94 | 403 | – | 240 | 180 | 180 | LT | 2.5 | 0.05 |
| 2008/11/10 | 781.48 | 87 | 2300 | 2300 | 2250 | 2250 | ST | 2.4 | 0.18 |
Photometric observations included acquisition of several exposures with exposure time varying from 100 to 300 s in different filters. Several bias and twilight flat frames were obtained for the CCD images. Bias subtraction, flat fielding, cosmic ray removal, alignment and determination of mean FWHM and ellipticity in all the object frames were done using the standard tasks available in the data reduction softwares IRAF 333IRAF stands for Image Reduction and Analysis Facility distributed by the National Optical Astronomy Observatories which is operated by the Association of Universities for research in Astronomy, Inc. under co-operative agreement with the National Science Foundation. and DAOPHOT444 DAOPHOT stands for Dominion Astrophysical Observatory Photometry. (Stetson, 1987, 1992). The FWHM seeing at band varied from 2″ to 4″, with a median value of around 25. About 10% of the images taken at large zenith distance had highly elongated PSF (ellipticity 0.2). For final photometry, we co-added the individual frames to increase the signal-to-noise ratio. The pre-processing steps for images taken from other than 1m ST were also performed in similar fashion.
| Star | ||||||
|---|---|---|---|---|---|---|
| ID | (h m s) | (° ′ ″) | (mag) | (mag) | (mag) | (mag) |
| 1 | 11 25 11.27 | -09 48 04.4 | 15.360.01 | 14.360.03 | 13.990.01 | 13.490.01 |
| 2 | 11 25 18.34 | -09 47 03.0 | 15.700.01 | 14.920.02 | 14.680.01 | 14.250.01 |
| 3 | 11 24 55.62 | -09 46 07.9 | 16.500.01 | 15.820.03 | 15.640.01 | 15.260.01 |
| 4 | 11 25 14.22 | -09 44 04.7 | 16.910.01 | 16.150.01 | 15.930.01 | 15.500.01 |
| 5 | 11 25 10.47 | -09 49 17.0 | 17.000.02 | 16.230.03 | 15.980.01 | 15.520.04 |
| 6 | 11 24 53.17 | -09 47 25.1 | 17.090.02 | 16.420.03 | 16.220.01 | 15.830.03 |
| 7 | 11 24 56.67 | -09 41 35.1 | 17.800.02 | 16.990.02 | 16.660.01 | 16.190.04 |
| 8 | 11 25 14.78 | -09 44 54.3 | 18.500.07 | 17.700.07 | 17.490.06 | 17.120.03 |
| 9 | 11 25 11.40 | -09 44 54.5 | 18.280.04 | 17.750.03 | 17.620.02 | 17.220.04 |
| 10 | 11 25 09.31 | -09 47 16.4 | 18.830.09 | 17.920.07 | 17.630.03 | 17.080.06 |
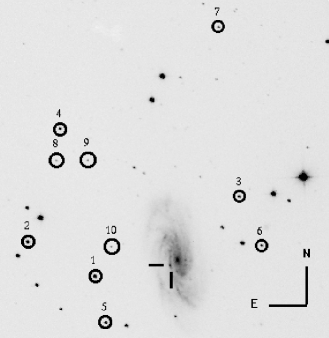
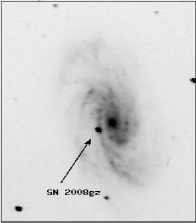
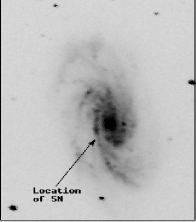
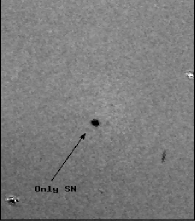
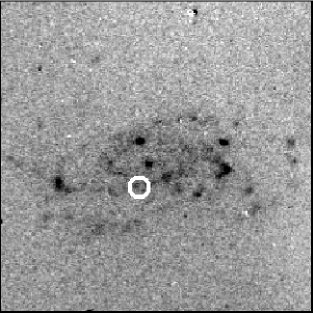
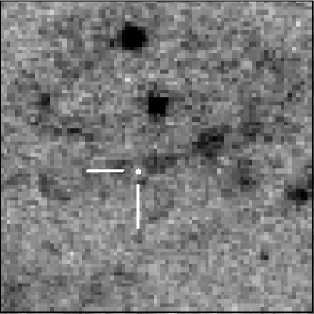
Fig. 1 shows the location of SN 2008gz in the galaxy NGC 3672. The SN flux is expected to have substantial contribution from the host galaxy background, due to its proximity to the galaxy centre, its location in a spiral arm and a high inclination angle (56.2°; Table 1) of the galaxy. At early phases, SN flux dominates the total flux, thus with a PSF-fitting method we were able to remove the galaxy contribution. At later epochs (e.g. end of plateau in case of type IIP events), galaxy flux may brighten the SN light curves by 0.5 to 1 mag depending on its location in the galaxy (Pastorello et al., 2005). We used ISIS555http://www2.iap.fr/users/alard/package.html (Alard & Lupton, 1998) to get galaxy template subtracted flux of supernova. As a template we used the images taken on 14 February 2010 (+548d) from 1m ST, India in good seeing conditions. We note that the galaxy subtraction using pre-SN (–403d) images taken from Perth Observatory, gave no SN contribution above noise level in our images recorded on 19 November 2009, 13 and 14 February 2010. In order to verify ISIS results, we also performed the galaxy template subtraction scheme independently using self-written scripts employing IRAF tasks which included alignment, PSF and intensity matching of the galaxy template and SN images, and subtraction of template from SN images. Fig. 2 shows images with and without template subtraction. PSF-fitting method was applied on the subtracted images. Our magnitude was found to be consistent with the ISIS ones having a typical scatter of 0.1 mag in ; this scatter is of the order of 0.05 mag in plateau phase (see Fig. 3666Figure 3 is only available in electronic form.).
In order to calibrate instrumental magnitudes of SN 2008gz, we observed Landolt (2009) standard fields SA92 and PG0231 in with 1m ST on 15 November 2008 under good night conditions (transparent sky, FWHM seeing in ). The data reduction of SN and Landolt fields were done using profile fitting technique and the instrumental magnitudes were converted into standard system following least-square linear regression procedures outlined in Stetson (1992). We used mean values of atmospheric extinction coefficients of the site viz. 0.28, 0.17, 0.11 and 0.07 mag per unit airmass for the , , and bands respectively (Kumar et al., 2000). A set of 13 stars having a colour range of and brightness range of were used to derive the following zero points and colour coefficients:
Here , , , are the standard magnitudes and , , , are corresponding instrumental magnitudes corrected for time and aperture. A typical scatter in the photometric solutions to the Landolt standard stars is found to be 0.03 mag for . Table 3 lists the calibrated magnitudes for a set of ten stable secondary standards in the SN field, while calibrated magnitudes of SN 2008gz are presented in Table 4. For SN, we quote ISIS derived errors ( uncertainty), which is consistent with the RMS scatter in the magnitude of standard stars determined from night-to-night repeatability over entire period ( 215d) of SN monitoring. Large errors in 2m IGO and 3.6m NTT data arises due to mismatch in the PSF and pixel scale.
2.2 Optical light curve
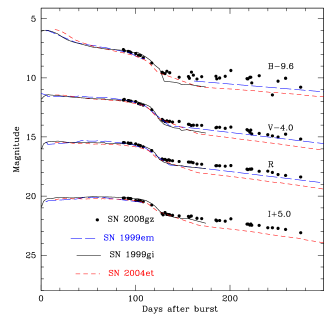
Fig. 4 shows light curves of SN 2008gz ranging from +87d to +275d since the time of explosion. We also present the light curves of other well studied nearby () type IIP SNe viz. 2004et (Sahu et al., 2006; Misra et al., 2007), 1999em (Elmhamdi et al., 2003a) and 1999gi (Leonard et al., 2002), scaled in time and magnitude to match the transition between plateau to nebular phases. It is seen that SN 2008gz was detected close to the end of its plateau phase and its light curve resembles well with the above three template IIP events and hence we could determine (and adopt) the time of inflection (plateau to nebular), of d, by adjusting the template light curves to get the best match to SN 2008gz data points. This derived plateau duration is typical for type II P events (Elmhamdi et al., 2003b) and it is also consistent with the fact that SN 2008gz was not visible around three months before the discovery date (November 5.83, 2008) at the level of unfiltered magnitude of 19.0 (Nakano & Martin, 2008). Further, similarities between bolometric tail luminosity of SN 2008gz (see §7) with that of SN 2004et and SN 1999em indicates that probably explosion happened about 82 days before the discovery date. Analysis of first spectrum of SN 2008gz (see §3.2) also revealed few similarities between the kinematical properties of its ejecta to that of SN 2004et observed nearly 80 days after the burst. We therefore adopt time of SN explosion to be days before the discovery date and this corresponds to burst time, of JD 2454694.0, however, we note that based on the first spectrum (November 11.25 UT, 2008) and its similarity with +62d spectrum of SN 1998A (Benetti et al., 2008) suggesting a time of explosion of nearly 56 days before the discovery date (corresponding to plateau phase of 90d) cannot be ruled out.
In the late plateau phase ( +90d) flatness behaviour in and decline trend in are clearly seen, which are similar to other IIP events. The magnitude drop of 1.5 mag from plateau phase ( 16 mag at +100d) to nebular phase (17.5 mag at +130d), is slightly lower than 2-3 mag drop for a typical IIP event (Olivares et al., 2010). This shallow decline which is seen in also, indicating production of large 56Ni mass (see §8.1). In contrary to this, very steep brightness decline at has also been observed, e.g. 4.5 mag for SN 2007od (Andrews et al., 2010). The nebular phase starts at +140d, and it roughly follows the decay slope of 56Co to 56Fe: 0.98 mag . A linear fit to the tail from +150d to +275d gives the following decline rates [in mag ]: , , , at , , , which is typical to the values found for IIP SNe. The flattening seen in band light curve, though non-conclusive due to large scatter of the measurements, has also been observed in other events, e.g. in 1999em (Elmhamdi et al., 2003a) and 1987A (Suntzeff et al., 1988) until +400d.
3 Low resolution spectroscopy
3.1 Data
Long-slit low resolution spectra ( 6 to 14 Å) in the optical range (0.33 - 1.0 ) were collected at eight epochs during +87d to +275d; five epochs from 2m IGO, and one epoch each from 3.5m TNG, 6m BTA and 3.6m NTT. Journal of spectroscopic observations are given in Table 5.
At 2m IGO, observations were carried out using IFOSC (IUCAA Faint Object Spectrograph and Camera) mounted at the cassegrain end of f/10 reflector (Gupta et al., 2002; Chakraborty, Das & Tandon, 2005). Slit spectra were recorded using EEV CCD camera with 13.5 pixel, having a gain of 1.8 per analog-to-digital unit, and readout noise of 6.3 . Grism 7 with peak sensitivity at 500 nm and a slit width of 15 were used. Calibration frames (bias, flats, arcs) and spectrophotometric flux standards were observed on each night. For SN, usually slits were placed across the spiral arm so as to make proper sky background and in one case at +170d, the galaxy centre was also observed. Spectroscopic data reduction was done under IRAF environment. Bias and flatfielding were performed on each frames. Cosmic ray rejection on each frame was done by using Laplacial kernel detection (van Dokkum, 2001). Images were coadded to improve the signal-to-noise ratio and one-dimensional spectra were extracted using apall task in IRAF which is based on optimal extraction algorithm by Horne (1986). Wavelength calibration were performed by using identify task and about 15-18 emission lines of He and Ar which were used to find a dispersion solution. Fifth order fits were used to achieve a typical RMS uncertainty of 0.1Å. The position of OI emission skyline at 5577Å was used to check the wavelength calibration and deviations were found between 0.5 to 1Å and this was corrected by linear shift in dispersion. The instrumental FWHM resolution of 2m IGO spectra as measured from O i 5577Å emission skyline was found to lie between 6Å to 10Å ( 322 - 510 ). Flux calibration was done using spectrophotometric fluxes from Hamuy et al. (1994) and assuming a mean extinction for the site. Synthetic magnitudes were estimated using spectra to verify the accuracy of flux calibration and it was found to be accurate within 0.05 mag.
Spectroscopic data reduction for DOLORES on 3.6m TNG, EFOSC2 on 3.6m NTT, and SCORPIO on 6m BTA were done in similar fashion and at around 6000Å it had a resolution of 10Å, 14Å and 12Å respectively.
3.2 Optical spectra

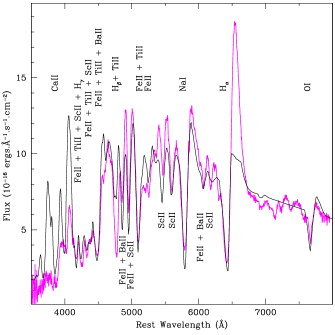
Fig. 5 and Fig. 6 show the rest frame spectra of SN 2008gz , corrected for recession velocity (1864 ) of the host galaxy NGC 3672. We identify all the spectral features as per previously published line identifications for IIP events (Leonard et al., 2002; Sahu et al., 2006). In Fig. 5, end of the plateau phase (+115d) and beginning of nebular phase (+140d) is clearly evident in the spectral evolution.
| UT Date | JD | Phasea | Telescopeb | Seeingc | ||||
|---|---|---|---|---|---|---|---|---|
| (yy/mm/dd) | 2454000+ | (day) | (mag) | (mag) | (mag) | (mag) | (″) | |
| 2008/11/10 | 781.47 | 87 | 17.2050.016 | 15.8710.012 | 15.4750.008 | 15.1680.015 | ST | 2.4 |
| 2008/11/11 | 782.49 | 88 | 17.3120.030 | 15.8190.014 | 15.4770.010 | 15.1640.013 | ST | 2.6 |
| 2008/11/15 | 786.47 | 92 | 17.3550.040 | 15.9180.019 | 15.5010.013 | 15.1890.017 | ST | 2.7 |
| 2008/11/16 | 787.47 | 93 | 17.3760.033 | 15.9200.017 | 15.5370.011 | 15.2100.014 | ST | 2.4 |
| 2008/11/17 | 788.48 | 94 | 17.4020.030 | 15.9570.017 | 15.5520.011 | 15.2070.016 | ST | 2.4 |
| 2008/11/18 | 789.46 | 95 | 17.4570.037 | 15.9660.021 | 15.5330.012 | 15.2190.015 | ST | 3.3 |
| 2008/11/23 | 794.47 | 100 | 17.5500.033 | 16.0020.020 | 15.5870.015 | 15.3730.019 | ST | 3.5 |
| 2008/11/26 | 797.47 | 103 | 17.6840.014 | 16.1820.008 | 15.6850.003 | 15.3730.005 | ST | 2.7 |
| 2008/11/28 | 799.45 | 105 | 17.7030.029 | 16.2280.018 | 15.7320.014 | 15.3970.021 | ST | 3.0 |
| 2008/12/01 | 802.49 | 108 | 17.9000.028 | 16.3110.017 | 15.8300.011 | 15.4750.017 | ST | 2.5 |
| 2008/12/10 | 811.49 | 117 | 18.3420.037 | 16.7020.027 | 16.1510.017 | 15.7610.026 | ST | 2.9 |
| 2008/12/21 | 822.49 | 128 | 19.1250.094 | 17.5190.047 | 16.8570.026 | 16.4800.040 | ST | 2.6 |
| 2008/12/22 | 823.46 | 129 | 19.1900.073 | 17.5970.043 | 16.9090.023 | 16.5830.029 | ST | 2.3 |
| 2008/12/24 | 825.53 | 131 | 19.2420.174 | 17.6950.058 | 16.8930.022 | 16.3930.026 | ST | 3.6 |
| 2008/12/26 | 827.52 | 133 | 19.0440.176 | 17.6380.036 | 16.9820.017 | 16.5460.024 | ST | 3.1 |
| 2008/12/28 | 829.44 | 135 | – | 17.7040.037 | 16.9280.020 | 16.5590.026 | ST | 2.7 |
| 2008/12/29 | 830.49 | 136 | 19.1650.085 | 17.6740.039 | 16.9760.021 | 16.5820.041 | ST | 3.2 |
| 2009/01/01 | 833.52 | 139 | – | 17.7380.047 | 17.0160.021 | 16.6230.030 | ST | 2.7 |
| 2009/01/08 | 840.48 | 146 | 19.5470.121 | 17.6840.043 | 17.0690.024 | 16.6710.049 | ST | 3.1 |
| 2009/01/18 | 850.36 | 156 | 19.4890.168 | 17.9200.082 | 17.1180.040 | 16.7170.055 | ST | 3.1 |
| 2009/01/19 | 851.32 | 157 | 19.6310.156 | 17.9410.068 | 17.1280.033 | 16.7790.061 | ST | 3.1 |
| 2009/01/21 | 853.48 | 159 | 19.1150.069 | 18.0270.078 | 17.1280.038 | 16.6880.049 | ST | 3.2 |
| 2009/01/23 | 855.51 | 161 | 19.3730.077 | 18.0000.102 | 17.1780.036 | – | ST | 3.1 |
| 2009/01/27 | 859.36 | 165 | 19.6990.096 | 18.0020.054 | 17.2790.029 | 16.8770.045 | ST | 2.2 |
| 2009/02/01 | 864.35 | 170 | 19.4980.093 | 18.0190.062 | 17.3050.032 | 16.9030.047 | ST | 2.5 |
| 2009/02/16 | 879.42 | 185 | 19.4610.096 | 18.2170.065 | 17.4340.032 | 17.0290.046 | ST | 2.4 |
| 2009/02/17 | 880.27 | 186 | 19.6840.095 | 18.1810.064 | 17.4200.030 | 17.0870.046 | ST | 2.9 |
| 2009/02/20 | 883.34 | 189 | 19.6090.124 | 18.1790.075 | 17.4340.039 | 17.0710.058 | ST | 3.2 |
| 2009/02/26 | 889.27 | 195 | 19.4670.113 | 18.2690.093 | 17.4680.045 | 17.1210.068 | ST | 3.6 |
| 2009/03/04 | 895.23 | 201 | 18.9760.118 | 18.1630.111 | 17.4170.052 | 16.9240.070 | ST | 3.0d |
| 2009/03/21 | 912.33 | 218 | 19.6650.877 | 18.3800.341 | 17.7200.125 | 17.3730.181 | IGO | 1.6 |
| 2009/03/22 | 913.24 | 219 | 19.6810.775 | 18.4410.335 | 17.7620.128 | 17.3660.196 | IGO | 1.6 |
| 2009/03/24 | 915.32 | 221 | 19.5520.712 | 18.6010.292 | 17.7140.104 | 17.4490.165 | IGO | 1.5 |
| 2009/03/25 | 916.30 | 222 | 19.5450.727 | 18.4160.320 | 17.7230.117 | 17.3620.171 | IGO | 1.4 |
| 2009/03/26 | 917.32 | 223 | 20.0290.188 | 18.7430.143 | 17.7100.057 | 17.4630.107 | ST | 3.5 |
| 2009/04/03 | 925.20 | 231 | 19.4140.372 | 18.7010.242 | 17.8990.083 | 17.4810.130 | ST | 2.8 |
| 2009/04/12 | 934.29 | 240 | – | 18.8070.257 | 17.8880.089 | 17.6800.124 | ST | 2.7 |
| 2009/04/17 | 939.23 | 245 | 21.0400.270 | 18.9090.132 | 18.0000.052 | 17.6800.080 | ST | 2.8 |
| 2009/04/23 | 945.16 | 251 | 19.8780.187 | 19.0050.165 | 18.1760.093 | 17.7300.145 | ST | 3.1 |
| 2009/05/01 | 953.15 | 259 | 19.6330.182 | 18.7600.199 | 18.2540.080 | 17.8220.109 | ST | 2.5 |
| 2009/05/17 | 969.11 | 275 | 20.3880.984 | 19.1730.556 | 18.3830.269 | 18.0990.281 | NTT | 0.9 |
a with reference to the explosion epoch JD 2454694.0
b ST : 1 m Sampurnanand Telescope, ARIES, India; IGO : 2 m IUCAA
Girawali Observatory, IUCAA, India; NTT : 3.6 m New Technology Telescope, ESO, Chile
c FWHM of the stellar PSF at band
d Flat field problem
The late plateau phase (+87d and +115d) spectra are marked by strong P-Cygni features of H, O i 7700Å, Na i D 5890, 5896Å, and singly ionised Sc, Ba, Ti, Fe atoms, while the +140d and later spectra show significant drop in the absorption strength of P-Cygni features. The spectra during +115d to +222d show the spectral evolution of the event from early to mid-nebular stage, while the last two spectra (+231d and +275d) are those typical shown during the late stages of a typical SNIIP. In Fig. 6, the +87d spectrum shows various atomic absorption lines over the weak continuum. These lines are mainly due to elements present in the SN ejecta along with some earth atmospheric molecular lines (marked with ) and absorption due Na i D of Milky Way and host galaxy. On the other hand, the +275d spectrum shows a typical nebular phase spectrum dominated by emission lines.
| UT Date | JD | Phasea | Range | Telescopeb | Grating | Slit width | Dispersion | Exposure | S/Nc |
|---|---|---|---|---|---|---|---|---|---|
| (yy/mm/dd/hh.hh) | 2454000+ | (days) | (gr mm-1) | (″) | (Å pix-1) | (s) | (pix-1) | ||
| 2008/11/11/06.049 | 781.88 | +87 | 0.340.80 | TNG | 500 | 1.5 | 2.5 | 1200 | 80 |
| 2008/12/08/23.346 | 809.46 | +115 | 0.380.68 | IGO | 600 | 1.5 | 1.4 | 2x1800 | 50 |
| 2009/01/03/00.333 | 834.52 | +140 | 0.380.68 | IGO | 600 | 1.5 | 1.4 | 2x1800 | 26 |
| 2009/02/01/22.208d | 864.40 | +170 | 0.380.68 | IGO | 600 | 1.5 | 1.4 | 2x1800 | 20 |
| 2009/02/02/21.400 | 865.40 | +171 | 0.380.68 | IGO | 600 | 1.5 | 1.4 | 3x1800 | 24 |
| 2009/03/22/18.303 | 913.27 | +218 | 0.380.68 | IGO | 600 | 1.5 | 1.4 | 1800 | 8 |
| 2009/03/25/19.673 | 916.33 | +222 | 0.380.68 | IGO | 600 | 1.5 | 1.4 | 1800 | 7 |
| 2009/04/03/22.643 | 924.50 | +231 | 0.611.00 | BTA | 550 | 2.1 | 3.5 | 3x900 | 70 |
| 2009/05/17/00.543 | 969.04 | +275 | 0.330.80 | NTT | 300 | 1.0 | 4.0 | 2700 | 16 |
| 2009/05/17/01.308 | 969.07 | +275 | 0.551.05 | NTT | 300 | 1.0 | 4.2 | 2700 | 24 |
a With reference to the burst time JD 2454694.0
b TNG : DOLORES on 3.5m Telescopio Nazionale Galileo, Italy; IGO : IFOSC on
2m IUCAA Girawali Observatory, India; BTA : SCORPIO on 6m Big Telescope Alt-azimuthal,
Special Astrophysical Observatory, Russia;
NTT : EFOSC2 on 3.6m New Technology Telescope, ESO, Chile.
c At 0.6
d Only center of galaxy observed
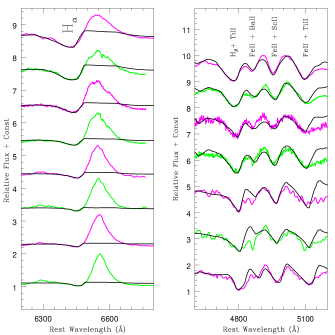
Temporal evolution of P-Cygni nature of H is clearly seen viz. the emission component becomes narrower with a decrease in depth of associated absorption component during the transition of SN from plateau to nebular phase. The FWHM of emission component of H decreases from at +87d to at d, indicating decrease in opacity and temperature of H i line emitting regions. For H, H and H, the emission components are crowded with numerous metal lines. In Fig. 6, we also see impression of an additional P-Cygni component in the absorption profile of H and H. This is speculated as a footprint of high velocity emitting shells in SN ejecta. Similar signatures were also noticed in type IIP SNe 1999em and 2004et (Leonard et al., 2002; Li et al., 2005; Sahu et al., 2006).
The spectrum, labeled with d shows a typical late nebular phase spectrum marked by emission dominated permitted lines of Ca ii 8498, 8542, 8662Å and Na i D as well as with the appearance of forbidden emission lines, i.e., [O i] 6300, 6364Å; [Fe ii] 7155Å and [Ca ii] 7291, 7324Å . These forbidden lines are not observed at Earth due to high density of gas. [Ca ii] is already seen in +87d spectrum, [O i] appears at +171d, while the [Fe ii] appears in +275d spectrum. Increasing strength of these forbidden lines indicate expansion and rarefaction of SN ejecta with time. The [Fe ii] line is also noticed by Pastorello et al. (2005) in +344d spectrum of SN 1998A and +346d spectrum of SN 1987A, whereas for low luminosity SN 1997D it was visible at +417d (Benetti et al., 2001). We determine relative strength of 2.06 for SN 2008gz, whereas for SNe 1999em and 1987A, values of this ratio are respectively 6.98 and 24.68 at around +400d (Elmhamdi et al., 2003a). This indicates that the physical conditions of [Fe ii] formation in SN 2008gz may be similar to that of SN 1999em rather than SN 1987A.

4 Temporal evolution of spectral lines
To further illustrate the nature of burst, we show in Fig. 7 (and describe below) the velocity profiles of H, H, Na i D, Ba ii 6142Å and [O i] 6300, 6364Å. The absorption dips and emission peaks due to SN are marked by downward and upward arrows respectively. For a spherically symmetric burst, the emission peak of P-Cygni profiles should be located at the rest wavelength of the corresponding line, while absorption dip will be blueshifted reflecting the instantaneous velocity of corresponding line emitting region. In our rest frame spectra, H emission peak is found to be slightly blue shifted by at +87d. Such blue shift in H emission peak at the early epochs was also observed for other type II SNe (i.e., 1987A (Hanuschik & Dachs, 1987), 1988A (Turatto et al., 1993), 1990K (Cappellaro et al., 1995), 1993J (Matheson et al., 2000), 1998A (Pastorello et al., 2005), 1999em (Elmhamdi et al., 2003a), 2005cs (Pastorello et al., 2009), 2007od (Andrews et al., 2010)). It is observed for few low luminosity type II as well, e.g., SN 1999br in their early phases (Pastorello et al., 2004). On the basis of SN 1987A velocity profile, Chugai (1988) explained this phenomenon as an effect of diffused reflection of resonance radiation by the expanding photosphere. For SN 1987A at the +85d this velocity was about a few hundred and hence comparable with SN 2008gz. On the other hand for SN 1998A and SN 1993J H emission peak velocity at comparable epoch were at least one order of magnitude higher than SN 2008gz. At later epoch (+275d) H emission peak velocity for SN 2008gz is about which is considerably different from SN 1987A, where redshifted velocity of was observed.

In most of our H profile, a narrow emission line (marked by ‘D’ in Fig. 7) is seen at zero velocity, which is probably due to underlying H ii region and this is consistent with presence of low-luminosity H ii region at SN location revealed by our H narrow band observation (§8.2). Such a feature is not seen in well observed nearby IIP SNe 2004et (Sahu et al., 2006) and 2004A (Gurugubelli et al., 2008), which occurred in the outskirts of their host galaxies.
Na i D 5892Å P-Cygni nature is prominent in the spectra at all epochs with emission peak located at zero velocity, indicating almost spherical distribution of Na ion in the ejected material. In high S/N spectra (+87d and +115d), two peculiar absorption dip in the SN Na i D emission profile is seen at (marked by B), and at (marked by C), respectively. These are identified as Na i D absorption respectively due to the interstellar matter in the host galaxy and the Milky Way (§6). In this regard, we note that due to highly inclined host galaxy (), true recession velocity for SN will be different from the adopted ones (1864 ), and as measured from Na i D absorption at SN location, it should differ by , however, considering, low dispersion spectra, this will not change any of our conclusions.
The absorption dips due to an s-process element Ba ii 6142 Å and for the element Sc ii 6248Å are clearly visible in +87d and +115d spectra, however, they disappeared in the +140d spectrum. This is similar to luminous type IIP SNe 2004et (Sahu et al., 2006) where these lines were prominent at +113d and barely observable at +163d and for 1999em (Elmhamdi et al., 2003a) it was visible up to +166d. In contrary to this, low luminosity IIP SNe 1997D, 2005cs and others (Turatto et al., 1998; Benetti et al., 2001; Pastorello et al., 2004), these features sustain comparatively for longer time and observable till +208d. Low luminous type IIP SNe expand with velocity, much slower than that of normal type IIP events. So, the Ba lines in low luminosity events sustain for longer time just because the ejecta takes more time to cool-down. For luminous type II-peculiar SNe 1987A and 1998A, these feature are seen even at later epochs beyond +300d. For SN 2008gz, probably Ba abundance was low and s-process was not so effective like low luminosity events.
Metastable [O i] 6300, 6364 Å lines start to appear at +171d, and its strength increases progressively in spectra at later epochs. A normalized profile for +275d is shown in Fig. 8777Figure 8 is only available in electronic form. which is nearly symmetric, indicating a spherically symmetric Oxygen ejecta. The average FWHM for [O i] lines is 2500 . Two component Gaussian fit results in ratio of , which is at deviation from their strength ratio of 3 expected from transitional probability for a rarefied gas at certain temperature. Smaller ratio for SN 2008gz may indicate higher opacity for 6300 Å in comparison to 6364Å. We however note that the ratio of is not always 3 for type IIP events. For the SN 1988A, Spyromilio (1991) showed that at initial epochs when optical depth of the ejecta is very high, value of , whereas at late phase, for optically thin ejecta this ratio approaches to 3.03.
Blueshift in [O i] lines, particularly at epochs later than +400d (i.e. in SNe 1999em and 1987A), is interpreted as an effective indicator of dust formation in the SN ejecta due to excessive extinction of redshifted wings of emission lines than the blueshifted ones (Lucy et al., 1991; Danziger et al., 1991). Between +300-400d, the observed blueshift in oxygen may be due to contamination from the Fe ii mutliplet at 6250Å. The reason of the blue-shift of the oxygen line at early epochs ( 200 day) is still not clear and several hypothesis have been done. In a recent work Taubenberger et al. (2009) described this as a result of residual opacity that remains in the inner ejecta. This seems to be the most likely explanation for observed blue-shift of oxygen line. Dust formation at an early epoch +300d is also reported for SN 2004et. For SN 2008gz we estimate a blueshift of 250 , in [O i] components at epoch of +275d (see Fig. 5 and 8), however due to absence of any other evidence, this is not enough to claim dust formation in the SN 2008gz ejecta.
5 Photospheric and H-envelope velocities of ejecta
We used multi-parametric resonance scattering code SYNOW (Branch, Baron & Jeffery, 2001; Branch et al., 2002; Baron, 2005) for modelling the spectra of SN 2008gz to iterpret spectral features and estimate velocities of layers at different epochs. The algorithm works on the assumptions of spherical symmetry; homologous expansion of layers (); sharp photosphere producing a black-body spectrum and associated at early stages with a shock wave. In photospheric phase, the spectral lines are formed by the shell above the thick photosphere, but in nebular phase all visible regions are optically thin (Branch, Baron & Jeffery, 2001). Each of these two phases of SN evolution can be explained with individual approximations and the modelling of observed spectra needed in different synthetic codes.
| UT Date | Phase | ||||||
|---|---|---|---|---|---|---|---|
| (yy/mm/dd/) | (days) | ||||||
| 2008/11/11 | +87 | ||||||
| 2008/12/08 | +115 | ||||||
| 2009/01/03 | +140 | ||||||
| 2009/02/02 | +171 | ||||||
| 2009/03/22 | +218 | ||||||
| 2009/03/25 | +222 | ||||||
| 2009/04/03 | +231 | — | — | — | |||
| 2009/05/17 | +275 |

Our main aim in modeling the spectral features is to estimate the velocities of the layers and that of pseudo-photosphere. It was also noted in Branch, Baron and Jeffery (2001) there is no sharp division between the photosphere and the nebular phases. We note the presence of absorption components in Iron and Hydrogen lines at the latest spectra, which can be explained as a result of the decreasing resonance scattering mechanism. Although the resonance scattering codes like SYNOW are not used for describing late time spectra (see for ex. Elmhamdi et al., 2006), we use it to describe only the absorption parts of line profiles. It is not our intention to fit the emission part of the line profiles because this procedure needs to make use of other assumptions and other codes.
A preliminary result of SYNOW fit on SN 2008gz is reported by Moskvitin et al. (2010). In Fig. 9, we present our model fit for +87d spectrum in detached case, i.e., assuming line forming shells of ionised gases moving ahead of the photosphere. Most of the spectral features (particularly absorption minima and the continuum) are produced well. All the identified spectral features are same as marked in Fig. 6. We tried out undetached cases (Sonbas, 2008) as well and also attempted changing density laws (exponential and power) and we found that it had very little effect while fitting the absorption minima. In order to obtain precise velocity measurements of hydrogen layers, we modeled the profiles of H, H and Fe ii independently (see Fig. 10) following , where is optical depth and is the e-fold velocity. We also incorporated Ti ii, Sc ii, and Ba ii ions to model multi-minima absorption features around H. For Fe ii lines, we noticed that velocities of various absorption features are similar or have insignificant differences and hence we used averaged Fe ii values to represent the photospheric velocity () (Branch, Baron & Jeffery, 2001; Elmhamdi et al., 2006). Estimations of photospheric and envelopes velocities of different layers are given in Table 6. Uncertainties in the estimates take into account the noise in the spectra.
We also estimated photospheric and H-envelope velocities using IRAF by directly locating the absorption minima and the same is shown in Fig. 11. The velocity for Fe ii 4924, 5018 and 5169 lines, range from 4000 at +87d to around 3000 at +275d. These values are similar to the values estimated above from SYNOW modelling. For H and H layers our values are consistently higher by about 1500 at all epochs than that derived from SYNOW. This discrepancy may arise due to contamination of true absorption minima by the emission component of P-Cygni profile of H and H and hence it is likely that the true blueshift would be overestimated while using absorption minima.
For SN 2008gz the H velocity at +87d is 6800 , while for SNe 2004et, it is 6000 (Sahu et al., 2006). H also shows higher expansion velocity at comparable epochs. Similarly the photospheric velocity at day +50 is 3700 , while it is 4000 at +87d for SN 2008gz. So, even by considering an overestimate of the plateau period about 25 days (i.e. for d), the photspheric and H-envelope velocity for SN 2008gz seem to have comparable or higher values than SN 2004et. The photospheric velocity is a good indicator of the explosion energy (see Dessart, Livne & Waldman, 2010) and hence SN 2008gz has explosion energy similar to that of SN 2004et, erg (Utrobin & Chugai, 2009) or higher. Utrobin (2007) obtains an explosion energy of erg for SN 1999em, which has comparatively lower expansion velocity than to SN 2004et at similar epochs.
6 Distance and extinction of SN 2008gz

Spectrum of the nuclear region of the host galaxy taken on +170d (see Fig. 12888Fig. 12 is available only in electronic form.) was used to estimate , the heliocentric velocity. Employing five nebular emission lines and prominent absorption features and using the 5577 Å skyline as a reference wavelength, we obtain of This is in agreement with 18 other radio and optical measurements of of NGC 3672 (in range of 1400 to 2000 ) listed in HyperLEDA999http://leda.univ-lyon1.fr/. The Combined measurement gives a mean of and it corresponds to a corrected (Local Group infall into Virgo) distance of Mpc101010The cosmological model with H0 = 70 km.s-1.Mpc-1, = 0.3 and = 0.7 is assumed throughout the paper and the uncertainty corresponds to a local cosmic thermal velocity of 208 (Terry, Paturel & Ekholm, 2002).. NED111111http://nedwww.ipac.caltech.edu/ lists four distance measurements based on H i Tully-Fisher relation, with a mean of Mpc, which is in agreement with the above kinematic estimate, we therefore, adopt uncertainty weighted distance of Mpc for SN 2008gz.
| UT Date | Phase | EW (MW) | EW(host) |
|---|---|---|---|
| (yy/mm/dd/) | (days) | Å | Å |
| 2008/11/11 | +87 | ||
| 2008/12/08 | +115 | ||
| 2009/02/02 | +171 | – | |
| Weighted EW |
The Galactic reddening in the direction of SN 2008gz as derived from the 100 all sky dust extinction map of Schlegel et al. (1998) is estimated as = mag. Additionally, we could also determine reddening in the direction of SN 2008gz from equivalent widths of Na i D absorption lines present in the spectra of SN 2008gz (+87d and +115d) and the centre of the host galaxy (see Fig. 13). D1 (5889.95Å) and D2(5895.92Å) component of Na i D is not resolved in +87d spectra and it is seen as narrow absorption features overlaid on the broad P-Cygni emission wings of Na i D due to SN. In rest wavelength plot the host galaxy contribution is seen at , while the Galactic contribution is at . In +115d spectrum, both components of Na i D are resolved. Intriguingly, the Galactic component appear to split into two – a stronger component at (due to Milky Way ISM) and a weaker component at , possibly due to inter-galactic medium. In the +170d spectra, the Galactic Na i D absorption appear as a single component. Estimated total Na i D equivalent widths (EW) are reported in Table 7. Quoted errors in EW are photon-noise dominated RMS uncertainty derived following Vollmann & Eversberg (2006, see their Eq. 6). It is seen that the EW contribution due to host (Å) is smaller in comparison with the total Galactic contribution (Å).
It is known that the EWs of interstellar absorption bands is well correlated with the reddening estimated from the tail of SNIa colour curves (Barbon et al., 1990; Richmond et al., 1994) and by employing empirical relations established by Turatto, Benetti & Cappellaro (2003), (where EW is in Å)121212In Turatto, Benetti & Cappellaro (2003) there are two relations one is with low slope and other with a high slope. In this work we have considered the lower slope, because it is well sampled and matches with the previous works in this direction (Barbon et al., 1990)., we obtain Galactic contribution as mag and host galaxy as mag. The Galactic derived in this way is larger than that derived from Schlegel map. Considering the normal extinction law (R 3.1) and Schlegel value of 0.041 for the Milky Way; the EW (host/Galactic) ratio would suggest a slightly lower reddening in the host ( 0.01 mag). However the host galaxy value of 0.03 mag may not be ruled out in case of a different dust to gas ratio for the host.
For this work, we will adopt a conservative value of = mag, obtained by adding Galactic (Schlegel) and host galaxy (Na i D) contribution. This corresponds to visual extinction () of by assuming ratio of total-to-selective extinction (Cardelli et al., 1989).
7 Temporal Evolution of colour and bolometric luminosity


Fig. 14 shows reddening corrected colour evolution of SN 2008gz. For comparison, we also show reddening corrected colour curve of SN 1987A (Suntzeff & Bouchet, 1990), SN 1999em (Elmhamdi et al., 2003a) and SN 2004et (Sahu et al., 2006), for of 0.15, 0.10, and 0.41 mag and explosion epochs of JD 2446849.82, JD 2451480.5 and JD 2453275.5 respectively. Though the colour curves of SN 2008gz have large scatter but overall nature of its temporal evolution is prominent. SN 2008gz follows general trend of colour evolution i.e. a steep and rapid decrease from blue (high temperature) to red (low temperatures) colours similar to SNe 2004et and 1999em. becomes redder from 1.2 mag at +87d to about 1.7 mag at +140d and it follows trend similar to SNe 2004et and 1999em. The overall trend in colour evolution of SN 2008gz between end of plateau and middle of the tail is similar to that of peculiar type II SN 1987A. In nebular phase, turns blue rather rapidly, and this arises due to suspected flattening in light and a shallow decay in , and bands. The colour is found to be consistently bluer than for other IIP SNe. For and , the increment is quite shallow during the transition from plateau to nebular phase. This is in contrary to the colour evolution of low luminosity type II-peculiar SNe 1997D and 1999eu, where a steep rise and excess in colour has been noticed (Pastorello et al., 2004; Misra et al., 2007).
Bolometric luminosity is essential to estimate total optical radiant energy in the explosion and also at the tail phase it is a good estimator of radioactive 56Ni synthesized in the explosion. To a good approximation, the integration of extinction corrected flux in at a given epoch gives a meaningful estimate of bolometric luminosity. The extinction corrected magnitudes were converted into fluxes using zeropoints given by Bessell, Castelli & Plez (1998) and the total flux is obtained by interpolating and integrating fluxes between 0.4 to 0.85 . Fig. 15 shows percentage flux contribution in different passbands and the overall trend is found to be similar to that of SN 1987A. From plateau (+87d) to nebular (+140d) phase, the flux contribution declines from 15 to 10% at , from 25 to 20% at , while it ascends from 36 to 42% at , from 22 to 30% at . In nebular phase (until +270d), the flux contributions remain constant. For nearby SNe 1987A and 2004et, large ( 40%) flux contribution in and bands are observed at initial epochs, which reduces to a few percent by +60d. Though, towrads later epochs, when SN ejecta becomes optically thin, a little enhancement (about 5%) in and bands is also noticeable (Misra et al., 2007). Therefore, for SN 2008gz, we have constructed bolometric light curve after making a constant (5%) contribution from band over the period of our observation. No correction for flux contributions in the ultraviolet and near-infrared region were made as they become significant respectively in early and late phases of the light curve evolution.
Fig. 16 shows the bolometric nature of SN 2008gz along with other type II events. Different behavior of these events is clearly evident and it provides constraint on the synthesized radioactive 56Ni as well as explosion energy of SNe. Tail luminosity of SN 2008gz is similar to SN 2004et, while the plateau luminosity is about 0.2 dex fainter. Explosion parameters for SN 2008gz are estimated in next sections.
8 Physical Parameters
8.1 Amount of ejected radioactive Nickel
The nebular phase light curve of type II SNe is mainly governed by the radioactive decay of 56Ni to 56Co to 56Fe having half-life of 6.1 and 111.26 days respectively and hence the tail luminosity is directly proportional to the amount of 56Ni synthesized by explosive burning of Si and O during shock breakout (Arnett, 1980, 1996).
By using tail luminosity, 56Ni mass can be derived following the method described by Hamuy (2003) applied under the assumption that all the -rays emitted during the radioactive decay make the ejecta thermalised. For SN 2008gz using the band magnitude at +200d, corrected for extinction ( mag; §6), a bolometric correction of mag (Hamuy, 2001) during nebular phase, and a distance modulus of , we derive tail luminosity of and this, for the plateau duration of 115 days, results in Ni mass M⊙.
We can estimate the mass of 56Ni by a direct comparison with that of SN 1987A for which it is accurately determined as 0.075M⊙. We note that the temporal evolution of flux contribution in different bands for SN 2008gz is comparable with that for SN 1987A (§7) and consequently we can safely assume that at a comparable epoch the ratio of their luminosities is equal to the ratio of synthesized 56Ni mass. SN 2008gz attains the deep nebular phase beyond 150 days after the burst. The last observation was also performed nearly at +275 day. Hence, the mean ratio between tail bolometric luminosity of SN 2008gz ( 150275) and that of SN 1987A is about 0.539. This implies that for SN 2008gz ejected 56Ni mass [0.5390.075] 0.041M⊙.
By taking a sample of ten IIP SNe, Elmhamdi et al. (2003b) show that the steepness of V-band light curve slope (defined as S=d/dt) at the inflection time () is anti-correlated with 56Ni mass (). For SN 2008gz we have well sampled transition phase and get a value of , mag d-1 (see Fig. 17131313Fig. 17 is only available in electronic form.) which corresponds to M⊙. Considering the uncertain values of extinction towards SN 2008gz , we note that for SNe 2004A and 2003gd, Hendry et al. (2006) finds that the Elmhamdi et al. (2003b) scheme gives somewhat lower values. Further, based on plateau luminosity, a linear correlation, found by Elmhamdi et al. (2003b) provides a value of 56Ni mass as 0.051M⊙ for of at +87d (). Taking average of above four estimates, we get the amount of produced 56Ni mass M⊙ . For estimation of other physical quantities we assume that above amount of 56Ni was produced by SN 2008gz. Though we would like to state that adopting smaller plateau duration (§2.2) will reduce the amount of ejected radioactive 56Ni which will further propagate in determination of progenitor properties (§8.3).
8.2 Environment of the progenitor
Constraints on the nature of progenitors of core-collapse SNe are derived from the studies of environments in which they occur. For example, by correlating the position of explosion sites with that of the sites of recent star formation as traced by H line emission, it is found (see e.g. James & Anderson, 2006; Kelly, Krishner & Pahre, 2008; Anderson & James, 2008) that core-collapse events are excellent tracer of star formation, and type Ib/c are more likely to be associated with regions of high surface brightness or high H emission than type II SNe. Anderson & James (2009) found that type IIP events are likely to be more centrally concentrated than other II-sub types. SN 2008gz occurred in spiral arms of the host galaxy at a deprojected galactocentric distance of 2.8 kpc (within half light radius) and the oxygen abundance ([O/H]=12+log) of the galactic ISM at the position of SN is estimated as 8.6 (derived from the O/H- relation proposed by Pilyugin, Vílchez & Contini (2004)), which is close to the solar abundance [O/H] of 8.65 (Asplund et al., 2009).
In order to further investigate the level of H emission level, we observed NGC 3672 in narrow-band H-line ( = 6551Å) and H-red ( = 6650Å) having FWHM of 83Å and 79Å respectively. We used 2k CCD camera mounted with 1m ST, Nainital on 18 February 2010 (+560 d). A total exposure of 1 hr in each H-line and H-red filters were taken along with several bias and sky flats. Raw images were corrected for bias and flats using IRAF. FWHM of stellar PSF (seeing) varied from 18 to 22. Images were combined to improve signal-to-noise ratio and the continuum subtraction was done using ISIS. Our narrow-band filter-set were not customized for extra-galactic work, and we expected H-red to contain emission line fluxes, as at the redshifted wavelength (Å at H ) of NGC 3672 , the H-red filter had a transmission of 25%, 40% and 80% respectively for N ii 6548Å , H and N ii 6589Å. We could verify this by subtracting H-line frame from the broad-band and frames of SN taken on 14 February 2010, which gave no residual, while H-red frame showed residuals. Fig. 18 shows the continuum subtracted image of SN 2008gz showing contributions from H +N ii emissions. A close up view of SN location is also shown. The sky is at level of 0 while the peak flux is around 22 counts. Five prominent regions of H emission having peak counts above 15 are clearly apparent. SN 2008gz position is at a level of 8 counts, and hence it belongs to a low-luminosity H ii regions. This is also evident from the early epoch spectra, in which an emission peak (not so prominent) of zero velocity is seen.
8.3 Properties of progenitor star
Accurate estimates of explosion parameters require detailed hydrodynamical modeling of the optical light curves, though the analytical relations (based on a few well modeled IIP events) correlating the physical parameters explosion energy, pre-SN radius and total ejected mass on the one hand and the observable quantities, plateau duration, mid-plateau V-band magnitude () and mid-plateau photospheric velocity () on the other hand are proposed to exit (see e.g. Popov, 1993; Litvinova & Nadyozhin, 1985; Nadyozhin, 2003). For SN 2008gz , we can only provide an approximation of these observables. The estimates of and can be made by using the 56Ni mass estimate and by employing following empirical relations derived (by minimizing least squares) from the data given in Hamuy (2003, see their Fig. 3 and 4).
For 0.05 0.01 M⊙, we derive ( mag and 4503 km s-1. This value of absolute magnitude is consistent with those obtained from the first photometric V point (§9). These estimates, along with a plateau duration of 115 days provides (Litvinova & Nadyozhin, 1985) burst energy erg, ejected mass M⊙ and pre-SN radius R⊙. The explosion energy derived in this way is consistent with the one expected from photospheric velocity (see §5), however, the ejecta mass is larger in comparison to the typical progenitor mass range (8.5-16.5M⊙) estimate derived from pre-explosion SN images (Smartt et al., 2009a) and this may arise due to uncertainty in above measured parameters.
Dessart, Livne & Waldman (2010) demonstrate that by employing the explosion energy estimate, the observed line width of [O i] and artificially generated radiation hydrodynamic simulations of core-collapse SNe, it is possible to put an upper limit on the main-sequence mass of the progenitor. For SN 2008gz, the Oxygen ejecta velocity of (HWHM of [O i] profile, see §4) (which is slightly higher than observed for SNe 2004et and 1999em at around +330 d) and assuming an explosion energy of erg s-1 provide a main-sequence mass of 15 (12) respectively for non-rotating (rotating) pre-SN models while assuming an ejecta velocity of 1500for [O i] gives an upper limit of 17(13) M⊙, which is consistent with that derived using pre-explosion images (Smartt et al., 2009a).
9 Comparison with other core collapse supernovae
A detailed investigation of SN 2008gz indicates that it is a normal type IIP event showing photometric and spectroscopic evolutions similar to archetypal SNe 2004et and 1999em. SN 2008gz occurred in a highly inclined () host galaxy, within deprojected galactocentric radius of (Table 1) implying solar metallicity region similar to SNe 1999em and 2005cs, though its explosion and other properties were found to be similar to SN 2004et, which occurred in the outskirt of its host galaxy. Our narrow-band H photometry indicates that SN 2008gz was associated with a star forming low luminosity H ii region of the galaxy. Thus, the metallicty appear to have little effect on the explosion properties of core-collapse SNe.
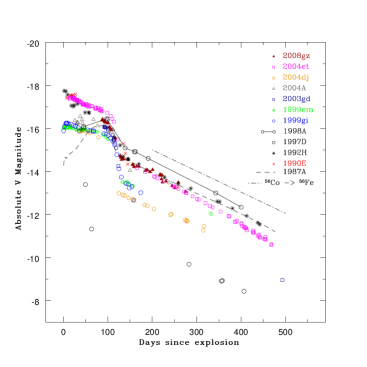
In Fig. 19 we show absolute V-band light curve of well studied core-collapse events collected from literature (see Misra et al., 2007, for references). The plateau luminosity ()141414We estimate the value of mid plateau as mag, by considering an average decline rate of 0.006 mag d-1 during the plateau phase of SNe 1999em and 2004et, we found that the mid-plateau magnitude of SN 2008gz was 0.2 mag brighter than that determined at +87d (§8.1). We assume of 0.214 mag. of SN 2008gz is at the similar level as of peculiar SNe 1987A, 1998A and it lies in between to the brighter end of IIP SNe 1990E, 1992H, 2004et ( mag) and the fainter end SN 1997D ( mag). This shows that SN 2008gz is a normal event, both in energetics and nickel production. These values of plateau luminosity for IIP SNe are lower than mag which was predicted using theoretical models calculated by Höflich (2001) for IIP SNe based on wide range of parameters (explosion energy, metallicity, mass loss of progenitor).
SN 2008gz showed rarely observed 1.5 mag drop at from plateau to nebular phase and it had tail luminosity comparable (or higher) to SNe 2004et resulting in the synthesised 56Ni mass in range M⊙. Large tail luminosity of SN 1998A indicates that the thermalization process for 1998A was more efficient than SN 2008gz. Colour evolution of SN 2008gz has a similar trend like normal IIP and peculiar SNe 1987A and 1998A. Expansion velocity of the SN 2008gz ejecta was comparable to SN 2004et or higher, implying explosion energy of erg. Our calculation for progenitor mass (§8.3) of SN 2008gz favours the mass range of M⊙ (i.e., SNe 1999em, 1999gi, 2004dj, 2004et) than to the lower mass range of M⊙ (i.e., SNe 1997D, 2004A, 2005cs). This progenitor mass grouping is also favoured on the basis of radio luminosity (Chevalier et al., 2006). As an alternative scenario, SN 2008gz can be characterized as a peculiar event. Lack of data in first 1-2 months after the explosion and spectral similarity with SN 1998A (Benetti et al., 2008) also indicates toward the possibility that SN 2008gz is a peculiar type II event. Figure 20 shows a comparison of SN 2008gz spectrum with SN 2004et and SN 1998A at comparable epoch. There are many similarities between spectral features of SN 2008gz and SN 1998A. On the other hand, low rates of peculiar type II SN, similarity in late light curve of SN 2008gz with type IIP events and similarity of some particular spectral features, like high velocity H line (§4) of this event with that of SNe 2004et and 1999em also indicates that SN 2008gz would be a normal type IIP event.

10 summary
We present photometric and low resolution spectroscopic observations of a supernova event SN 2008gz which occurred in an spiral arm and within half-light radius of a nearby (25 Mpc) galaxy NGC 3672. As the event was buried the galaxy light, we used template subtract technique to estimate the apparent magnitude of the event. We monitored the event for a period of 200 days. We summarize our results as follows.
-
1.
Photometric and spectral nature of the event is found similar to normal type IIP SNe 2004et and 1999em. The event was discovered by about 82 days after the burst and it has a plateau phase lasted days. We monitored the SN evolution from +87d to +275d.
-
2.
We estimate photospheric and H-envelop velocity by using both direct measurements of the absorption minimna of H i and Fe ii lines and SYNOW modelling of the spectra. Here both values agree well within uncertainties. We estimate the photospheric velocity of 4000 at +87d, which is higher than that observed for well studied SN 2004et at similar epochs indicating explosion energy comparable to or higher than 2004et. Similar trend was also seen for the expansion velocity of H-envelopes.
-
3.
Using pre-SN models of Dessart, Livne & Waldman (2010) and also by comparing explosion energies (derived by using hydrodynamical models) of well studied IIP SNe, we find that the SN 2008gz had explosion energy of erg.s-1. This estimation, coupled with the observed width of the forbidden [O i] line gives an upper limit for the main-sequence progenitor mass of 17M⊙.
-
4.
SN2008gz exhibits rarely observed drop of 1.5 mag within 30 days in V-band from plateau to nebular phase, this is higher than the typically observed fall of 2-3 mag in normal IIP SNe. Adopting AV = 0.21 mag, we could estimate mass of 56Ni synthesized during the explosion as M⊙.
-
5.
Our H observation taken about 560 days after the explosion indicates that the event took place in a low luminosity star forming arms, very close to a H ii region. The emission kink of this H ii region is also seen in H line near zero velocity of the Doppler corrected spectra of SN.
Acknowledgments
We are thankful to the reviewer Stefano Valenti for his valuable comments, which have enriched the manuscript. We thank all the observers at Aryabhatta Research Institute of Observational Sciences (ARIES) who provided their valuable time and support for the observations of this event. We are thankful to the observing staffs of 2-m IGO, 3.6-m TNG, 3.6-m NTT and 6-m BTA for their kind cooperation in observation of SN 2008GZ. We also express our thanks to the observing staffs of Perth observatory for their kind support for this research work. This work was supported by the grant RNP 2.1.1.3483 of the Federal Agency of Education of Russia. Timur A. Fatkhullin and Alexander S. Moskvitin were supported by the grant of the President of the Russian Federation (MK-405.2010.2). This work is partially based on observations made with the Italian Telescopio Nazionale Galileo (TNG) operated on the island of La Palma by the Fundación Galileo Galilei of the INAF (Istituto Nazionale di Astrofisica) at the Spanish Observatorio del Roque de los Muchachos of the Instituto de Astrofisica de Canarias. It is also partially based on observations collected at the European Southern Observatory, Chile under the program 083.D-0970(A). Stefano Benetti and Milena F Bufano are partially supported by the PRIN-INAF 2009 with the project “Supernovae Variety and Nucleosynthesis Yields” This research has made use of data obtained through the High Energy Astrophysics Science Archive Research Center Online Service, provided by the NASA/Goddard Space Flight Center. We are indebted to the Indo-Russian (DST-RFBR) project No. RUSP-836 (RFBR-08-02:91314) for the completion of this research work.
References
- Alard & Lupton (1998) Alard C., Lupton R.H., 1998, ApJ, 503, 325
- Anderson & James (2008) Anderson J.P., James P.A., 2008, MNRAS, 390, 1527
- Anderson & James (2009) Anderson J.P., James P.A., 2009, MNRAS, 399, 559
- Andrews et al. (2010) Andrews J.E. et al., 2010, ApJ, 715, 541
- Arnett (1980) Arnett W.D., 1980, ApJ, 237, 541
- Arnett (1996) Arnett W.D., 1996, Supernovae and Nucleosynthesis. Princeton University Press, Princeton, New Jersey, USA
- Asplund et al. (2009) Asplund M., Grevesse N, Sauval A.J., Scott, P., 2009, ARA&A47, 481
- Barbon et al. (1990) Barbon R., Benetti S., Rosino L., Cappellaro E., Turatto M., 1990, A&A, 237, 79
- Baron (2005) Baron E., et al., 2005, ASPC 342, 351
- Benetti et al. (2001) Benetti S. et al., 2001, MNRAS, 322, 361
- Benetti et al. (2008) Benetti S., Boschin W., Harutyunyan H., 2008, Cent. Bur. Electron. Telegrams, 1568, 1
- Bessell, Castelli & Plez (1998) Bessell M.S., Castelli F., Plez B., 1998, A&A, 333, 231
- Branch, Baron & Jeffery (2001) Branch D., Baron E., Jeffery, D.J., 2001, in Supernovae and Gamma-Ray Bursters, edited by K. Weiler., Lecture Notes in Physics 598, 47 (arXiv:astro-ph/0111573)
- Branch et al. (2002) Branch D. et al., 2002, ApJ, 566, 1005
- Cappellaro et al. (1995) Cappellaro E., Danziger I.J., della Valle M., Gouiffes C., Turatto M., 1995, A&A, 293, 723
- Cappellaro et al. (1999) Cappellaro E., Evans R., Turatto M., 1999, A&A, 351, 459
- Cardelli et al. (1989) Cardelli J.A., Clayton G.C., Mathis J.S., 1989, ApJ, 345, 245
- Chakraborty, Das & Tandon (2005) Chakraborty P., Das H.K., Tandon S.N., 2005, Bull. Astron. Soc. India, 33, 1-23
- Chevalier et al. (2006) Chevalier R.A., Fransson C., Nymark T.K., 2006, ApJ, 641, 1029
- Chugai (1988) Chugai N., 1988, Sov. Astron. Lett., 14, 334
- Chugai (1991) Chugai N., 1991, Sov. Astron., 35, 171
- Danziger et al. (1991) Danziger I.J., Lucy L.B., Bouchet P., Gouiffes G., 1991, in Woosely S. E., eds, Supernovae, New York, Springer, p. 69
- Dessart, Livne & Waldman (2010) Dessart L., Livne E., Waldman R., MNRAS, in press (arXiv:astro-ph/1006.2268)
- Elmhamdi et al. (2003a) Elmhamdi A. et al., 2003, MNRAS, 338, 939
- Elmhamdi et al. (2003b) Elmhamdi A., Chugai N.N., Danziger. I.J., 2003, A&A, 404, 1077
- Elmhamdi et al. (2006) Elmhamdi A., et al., 2006, A&A, 450, 305
- Filippenko (1997) Filippenko A.V., 1997, ARA&A, 35, 309
- Fisher (2000) Fisher A., 2000, Ph D thesis, University of Oklahoma
- Gezari et al. (2008) Gezari S., Dessart L., Basa S., 2008, ApJ, 683, L131
- Gupta et al. (2002) Gupta R. et al., 2002, Bull. Astron. Soc. India, 30, 785
- Gurugubelli et al. (2008) Gurugubelli U.K., Sahu D.K., Anupama G.C., Chakradhari N.K., 2008, Bull. Astron. Soc. India, 36, 79
- Habergham, Anderson & James (2010) Habergham, S.M., Anderson, J.P., James P.A., 2010, ApJ, 717, 342
- Hakobyan et al. (2009) Hakobyan A.A., Mamon G.A., Petrosian A.R., Kunth D., Turatto M., 2009, A&A, 508, 1259
- Hamuy (2001) Hamuy M., 2001, PhD thesis, University of Arizona
- Hamuy (2002) Hamuy M., Pinto P. A., 2002, ApJ, 566, 63
- Hamuy (2003) Hamuy M., 2003, ApJ, 582, 905
- Hamuy et al. (1994) Hamuy M., Suntzeff N.B., Heathcote S.R., Walker A.R., Gigoux P., Phillips M. M., 1994, PASP106, 566
- Hanuschik & Dachs (1987) Hanuschik R.W., Dachs J., 1987, A&A, 182, L29
- Heger et al. (2003) Heger A, Fryer C.L., Woosley S.E. et al., 2003, ApJ, 591, 288
- Hendry et al. (2006) Hendry M.A. et al., 2006, MNRAS, 369, 1303
- Höflich (1988) Höflich P., 1988, PASP, 7, 434
- Höflich (2001) Höflich P., Straniero O., Limongi M., Dominguez I., Chieffi A., 2001, Rev. Mexicana Astron. Astrofis., 10, 157
- Horne (1986) Horne K., 1986, PASP, 98, 609
- Harutyunyan et al. (2008) Harutyunyan A.H., Pfahler P., Pastorello A. et al., 2008, A&A, 488, 383
- James & Anderson (2006) James P.A., Anderson J.P., 2006, A&A, 453, 57
- Kelly, Krishner & Pahre (2008) Kelly P.L., Krishner R.P., Pahre P., 2008, ApJ, 687, 1201
- Kumar et al. (2000) Kumar B., Sagar R., Rautela B.S., Srivastava J.B., Srivastava R.K., 2000, Bull. Astron. Soc. India, 28,675
- Landolt (2009) Landolt A.R., 2009, AJ, 137, 4186
- Leonard et al. (2002) Leonard D.C., Filippenko A.V., Gates E.L., 2002, PASP, 114, 35
- Li et al. (2005) Li W., Van Dyk S.D., Filippenko, A.V., Cuillandre J.-C, 2005, PASP, 117, 121
- Litvinova & Nadyozhin (1985) Litvinova I.Y., Nadyozhin D.K., 1985, Sov. Astron., 11, 145L
- Lucy et al. (1991) Lucy L.B., Danziger I.J., Gouiffes G., Bouchet P., 1991, in Woosely S.E., eds, Supernovae, New York, Springer, p.82
- Matheson et al. (2000) Matheson T., Filippenko A.V., Barth A.J. et al., 2000, AJ, 120, 1487
- Misra et al. (2007) Misra K., Dave P., Poonam C., Bhattacharya D. et al., 2007, MNRAS, 381, 280
- Moskvitin et al. (2010) Moskvitin A.S., Fatkhullin T.A., Sokolov V.V., Komarova V.N., Drake A.J., Roy R., Tsvetkov, D. Yu., 2010, Astrophysical Bulletin, 65, 230237 (arXiv:astro-ph/1008.0773),
- Nadyozhin (2003) Nadyozhin D.K., 2003, MNRAS, 346, 97
- Nakano & Martin (2008) Nakano S., Martin R., 2008, Cent. Bur. Electron. Telegrams, 1566, 1
- Olivares et al. (2010) Olivares E.F. et al., 2010, ApJ, 715, 833O
- Pastorello et al. (2004) Pastorello A., Zampieri L., Turatto, M. et al., 2004, MNRAS, 347, 74
- Pastorello et al. (2005) Pastorello A. et al. 2005, MNRAS, 360, 950
- Pastorello et al. (2009) Pastorello A., Valenti S., Zampieri L. et al., 2009, MNRAS, 394, 2266
- Pilyugin, Vílchez & Contini (2004) Pilyugin L.S., Vílchez J.M., Contini T., 2004, A&A, 425, 849
- Poznanski et al. (2009) Poznanski D. et al., 2009, ApJ, 694, 1067
- Popov (1993) Popov D.V., 1993, ApJ, 414, 712
- Richmond et al. (1994) Richmond M. W., Treffers R. R., Filippenko A. V., Paik Y., Leibundgut B., Schulman E., Cox C. V., 1994, AJ, 107, 1022
- Sahu et al. (2006) Sahu D.K., Anupama G.C., Srividya S., Muneer S., 2006, MNRAS, 372, 1315
- Schlegel et al. (1998) Schlegel D.J., Finkbeiner D.P., Davis M., 1998, ApJ, 500, 525
- Smartt et al. (2009a) Smartt S.J., Eldridge, J.J., Crockett R.M. & Maund J.R., 2009a, MNRAS, 395, 1409
- Smartt (2009b) Smartt S.J., 2009b, ARA&A, 47, 63
- Smith et al. (2009) Smith N., Weidong Li., Filippenko A.V. & Chornock R., 2009, (arXiv:astro-ph/1006.3899)
- Spyromilio (1991) Spyromilio J., 1991, MNRAS, 253, 25
- Sonbas (2008) Sonbas E., et al., 2008, Astrophysical Bulletin, 63, 228
- Stetson (1987) Stetson P.B., 1987, PASP, 99, 191
- Stetson (1992) Stetson P.B., 1992, J. R. Astron. Soc. Canada, 86,71
- Suntzeff et al. (1988) Suntzeff N.B., Hamuy M., Martin G., Gomez A., Gonzalez R., 1988, AJ, 97, 1864
- Suntzeff & Bouchet (1990) Suntzeff N.B., Bouchet P., 1990, AJ, 99, 650
- Taubenberger et al. (2009) Taubenberger S., Valenti S., Benetti S., et al., 2009, MNRAS, 397, 677
- Terry, Paturel & Ekholm (2002) Terry J.N., Paturel G., Ekholm T., 2002, A&A, 393, 57
- Turatto et al. (1993) Turatto M., Cappellaro E., Benetti S., Danziger I.J., 1993, MNRAS, 265, 471
- Turatto et al. (1998) Turatto M., Mazzali P.A., Young T.R. et al., 1998, ApJ, 498, L129
- Turatto, Benetti & Cappellaro (2003) Turatto M., Benetti S., Cappellaro E., 2003, From Twilight to Highlight : The Physics of Supernovae, 200
- Utrobin (2007) Utrobin V.P., 2007, A&A, 461,233
- Utrobin & Chugai (2009) Utrobin V.P., Chugai N.N., 2009, A&A, 506, 829
- van Dokkum (2001) van Dokkum P.G., 2001, PASP, 113, 1420
- Vollmann & Eversberg (2006) Vollmann K., Eversberg T., 2006, Astron. Nachr., 327, No. 9, 862
| UT Date | JD | Phasea | Telescopeb | Seeingc | Ellipticityd | ||||
|---|---|---|---|---|---|---|---|---|---|
| (yy/mm/dd) | 2454000+ | (day) | (s) | (s) | (s) | (s) | (″) | ||
| 2007/07/09 | 290.94 | 403 | – | 240 | 180 | 180 | LT | 2.5 | 0.05 |
| 2008/11/10 | 781.48 | 87 | 2300 | 2300 | 2250 | 2250 | ST | 2.4 | 0.18 |
| 2008/11/11 | 782.50 | 88 | 3300 | 300 | 2250 | 2250 | ST | 2.6 | 0.33 |
| 2008/11/15 | 786.47 | 92 | 250, 300 | 250, 300 | 250, 300 | 250, 300 | ST | 2.7 | 0.11 |
| 2008/11/16 | 787.47 | 93 | 2300 | 2300 | 250, 300 | 250, 300 | ST | 2.4 | 0.13 |
| 2008/11/17 | 788.48 | 94 | 2300 | 2300 | 2300 | 2300 | ST | 2.4 | 0.10 |
| 2008/11/18 | 789.46 | 95 | 2300 | 2300 | 2300 | 2250 | ST | 3.3 | 0.11 |
| 2008/11/23 | 794.47 | 100 | 2300 | 2300 | 2300 | 2300 | ST | 3.5 | 0.05 |
| 2008/11/26 | 797.47 | 103 | 240 | 150 | 60 | 60 | ST | 2.7 | 0.05 |
| 2008/11/28 | 799.45 | 105 | 2300 | 2300 | 2300 | 2300 | ST | 3.0 | 0.13 |
| 2008/12/01 | 802.49 | 108 | 2300 | 2300 | 2300 | 2300 | ST | 2.5 | 0.18 |
| 2008/12/10 | 811.49 | 117 | 2300 | 2300 | 2300 | 2300 | ST | 2.9 | 0.21 |
| 2008/12/21 | 822.49 | 128 | 2300 | 2300 | 2300 | 2300 | ST | 2.6 | 0.14 |
| 2008/12/22 | 823.46 | 129 | 2300 | 2300 | 2300 | 2300 | ST | 2.3 | 0.20 |
| 2008/12/24 | 825.51 | 131 | 300 | 300 | 300 | 250 | ST | 3.6 | 0.19 |
| 2008/12/26 | 827.52 | 133 | 2300 | 300 | 300 | 300 | ST | 3.1 | 0.24 |
| 2008/12/28 | 829.45 | 135 | – | 300 | 300 | 300 | ST | 2.7 | 0.09 |
| 2008/12/29 | 830.49 | 136 | 2300 | 300 | 300 | 2300 | ST | 3.2 | 0.05 |
| 2009/01/01 | 833.51 | 139 | – | 300 | 300 | 300 | ST | 2.7 | 0.12 |
| 2009/01/08 | 840.48 | 146 | 2300 | 300 | 300 | 2300 | ST | 3.1 | 0.25 |
| 2009/01/18 | 850.36 | 156 | 2300 | 2300 | 2300 | 2300 | ST | 3.1 | 0.16 |
| 2009/01/19 | 851.32 | 157 | 3300 | 2300 | 2300 | 2300 | ST | 3.1 | 0.11 |
| 2009/01/21 | 853.32 | 159 | 2300 | 2300 | 2300 | 2300 | ST | 3.2 | 0.08 |
| 2009/01/23 | 855.51 | 161 | 2300 | 2300 | 2300 | ST | 3.1 | 0.36 | |
| 2009/01/27 | 859.36 | 165 | 2300 | 2300 | 2300 | 2300 | ST | 2.2 | 0.18 |
| 2009/02/01 | 864.35 | 170 | 2300 | 2300 | 2300 | 2300 | ST | 2.5 | 0.11 |
| 2009/02/16 | 879.42 | 185 | 2200 | 2200 | 2250 | 2250 | ST | 2.4 | 0.42 |
| 2009/02/17 | 880.27 | 186 | 2250 | 2250 | 2200 | 2200 | ST | 2.9 | 0.17 |
| 2009/02/20 | 883.34 | 189 | 2300 | 2300 | 2300 | 2300 | ST | 3.2 | 0.24 |
| 2009/02/26 | 889.27 | 195 | 2300 | 3300 | 2300 | 2300 | ST | 3.6 | 0.14 |
| 2009/03/04 | 895.23 | 201 | 2300 | 2300 | 2300 | 2300 | ST | 3.0 | 0.18 |
| 2009/03/21 | 912.33 | 218 | 1200 | 600 | 300 | 300 | IGO | 1.6 | 0.10 |
| 2009/03/22 | 913.24 | 219 | 1200 | 600 | 300 | 300 | IGO | 1.6 | 0.13 |
| 2009/03/24 | 915.31 | 221 | 1200 | 600 | 300 | 300 | IGO | 1.5 | 0.03 |
| 2009/03/25 | 916.30 | 222 | 1200 | 600 | 300 | 300 | IGO | 1.4 | 0.05 |
| 2009/03/26 | 917.32 | 223 | 2300 | 2300 | 2300 | 2300 | ST | 3.5 | 0.14 |
| 2009/04/03 | 925.20 | 231 | 2300 | 2300 | 2300 | 3300 | ST | 2.8 | 0.24 |
| 2009/04/12 | 934.28 | 240 | – | 2300 | 2300 | 2300 | ST | 2.7 | 0.43 |
| 2009/04/17 | 939.23 | 245 | 2300 | 2250 | 2300 | 2250 | ST | 2.8 | 0.16 |
| 2009/04/23 | 945.16 | 251 | 3300 | 2300 | 2300 | 2250 | ST | 3.1 | 0.16 |
| 2009/05/01 | 953.15 | 259 | 2300 | 2300 | 300 | 300 | ST | 2.5 | 0.38 |
| 2009/05/17 | 969.11 | 275 | 3120 | 360 | 60 | 60 | NTT | 0.9 | 0.08 |
| 2009/11/19 | 1155.94 | 462 | 2250 | – | – | – | ST | – | – |
| 2010/02/13 | 1241.34 | 547 | – | 3300 | 3300 | 3300 | ST | 2.5 | 0.13 |
| 2010/02/14 | 1242.35 | 548 | 4300 | 2300 | 2300 | 2300 | ST | 2.1 | 0.12 |
a With reference to the time of explosion JD 2454694.0.
b LT : 0.6 m Lowell Telescope, Perth Observatory, UK;
ST : 1 m Sampurnanand Telescope, ARIES, India; IGO : 2 m IUCAA
Girawali Observatory, India; NTT : 3.6 m New Technology Telescope, ESO, Chile
c FWHM of stellar PSF at band
d Ellipticity is estimated using imexamine task of IRAF


