Characteristics of solar-like oscillations of clusters simulated by stellar population synthesis
Abstract
Using a stellar population-synthesis method, we studied the distributions of and of simulated clusters with various ages and metallicities. Except for the confirmed peak (RC peak) of of red-clump (RC) stars, i.e. core-helium burning stars, there are a gap and a main sequence (MS) peak in the distributions of and of young clusters. The gap corresponds mainly to the Hertzsprung gap phase of evolution. The RC peak is caused by the fact that the radius of many RC stars near the zero-age horizontal branch concentrates in a certain range. The MS peak also results from the fact that many MS stars which are located in a certain mass range have an approximate radius in the early phase of MS. The MS peak barely exists in the simulated clusters with age 1.0 Gyr. The location of the MS peak moves to a lower frequency with increasing age or metallicity, which may be applied to constrain the age and metallicity of young clusters. For the simulated clusters with Z = 0.02, the frequency of the location of the dominant RC peak increases with age when age 1.2 Gyr, and then decreases with age when age 1.2 Gyr; but it scarcely varies when age 2.4 Gyr. This is relative to the degeneracy of the hydrogen-exhausted core at the time of helium ignition. In addition, the RC peak is not sensitive to the metallicity, especially for the clusters with age 2.4 Gyr. Asteroseismical observation for clusters with age 2.4 Gyr may aid in testing the theory of the degeneracy of the hydrogen-exhausted core. Moreover, for the clusters with 1.1 1.3 , there are a MS gap and a peak on the left of the MS gap in the distributions of and , which may be applied to constrain the central hydrogen abundance of stars in the MS gap and the peak.
keywords:
stars: evolution; open clusters and associations: general; stars: oscillations1 Introduction
Each low-degree p-mode of solar-like oscillations carries unique information about the stellar interior. Thus asteroseismology has the capability to probe the interior of stars and to determine the fundamental parameters of individual stars (Ulrich, 1986; Gough, 1987; Christensen-Dalsgaard, 2002; Eggenberger & Carrier, 2006; Yang & Meng, 2010). However, it is more difficult to extract solid estimates of individual frequencies than to extract the mean large frequency separation () and the frequency of maximum seismic amplitude (). Fortunately, the and also allow us to determine the fundamental parameters of stars (mass and radius) to within a few percent (Kjeldsen & Bedding, 1995; Stello et al., 2009a, b). Moreover, the property of frequency separations has been studied by many investigators (Ulrich, 1986; Gough, 1987; Gabriel, 1989; Roxburgh & Vorontsov, 2000; Yang & Bi, 2007; Yang & Meng, 2009). Asteroseismic parameters and will be the primary parameters for asteroseismology. Using the data observed by the COnvection ROtation and planetary Transits (CoRoT) (Baglin et al., 2006), Hekker et al. (2009) and Mosser et al. (2010) extracted the and of more than 900 red giant stars. By making use of the and , Kallinger et al. (2010) and Mosser et al. (2010) derived information on the mass and radius of the oscillating stars. In addition, the distributions of the and have been applied to test stellar population synthesis models (Miglio et al., 2009; Yang, Meng & Li, 2010) and physical processes such as mass loss and binary interactions (Yang, Meng & Li, 2010). Asteroseismology has significantly advanced the theory of stellar structure and evolution.
Since stars in a cluster are believed to have uniform age and chemical compositions, research on solar-like oscillations in cluster stars as a uniform ensemble will strengthen our ability to constrain stellar models and improve our understanding of stellar evolution and interior physical processes (Stello et al., 2010b; Gilliland et al., 2010). This potential has led to many attempts to detect solar-like oscillations in clusters (Gilliland et al., 1993; Gilliland, 2008; Edmonds & Gilliland, 1996; Stello et al., 2007; Frandsen et al., 2007; Stello & Gilliland, 2009). Strong evidence for the excess power of oscillations has been found in the red giants of a few clusters, such as open cluster M67 (Stello et al., 2007), globular cluster 47 Tucanae (Edmonds & Gilliland, 1996) and NGC 6397 (Stello & Gilliland, 2009), but oscillation frequencies were not claimed by these authors. Thanks to the Kepler mission (Koch et al., 2010), there are four open clusters in the Kepler field of view, NGC 6791, NGC 6811, NGC 6866 and NGC 6819 (Gilliland et al., 2010), which span a range in metallicity and age enclosing solar values. Solar-like oscillations have been clearly detected by Kepler Mission in a large sample of red giants in the cluster NGC 6819 (Stello et al., 2010a). The values of and for the cluster stars were extracted firstly by Stello et al. (2010a). In future observations, oscillations in subgiants, i.e. Hertzsprung gap stars, and main sequence (MS) stars in these clusters could be measured by the Kepler Mission (Stello et al., 2010a; Gilliland et al., 2010; Stello et al., 2010b). Moreover, the PLAnetary Transits and Oscillations of stars mission (PLATO) (Roxburgh et al., 2007; Catala, 2009) will monitor more than 100,000 bright ( 11) stars of all spectral types, which can provide a large sample of stellar oscillations. Having seismic parameters among a large sample of cluster stars at various stages of evolution will allow us to have independent constraints on the cluster age and test the various physical processes that govern stellar evolution (Gilliland et al., 2010). Because the observational accuracy for and is very high (for example, the uncertainty of CoRoT is about 0.75 Hz for of giant stars (Mosser et al., 2010)) and seismic data do not suffer from uncertainties in distance or extinction and reddening, asteroseismology could thus provide more stringent constraints on the cluster age than classical approaches.
In this paper, by making use of a stellar population-synthesis method, we studied the characteristics of distributions of the and of clusters with various metallicities and different ages. We used the Hurley rapid evolution codes (Hurley, Pols & Tout, 2000; Hurley, Tout & Pols, 2002) to construct stellar models for stellar population synthesis, and we used Eggleton’s stellar evolution code (Eggleton, 1971, 1972, 1973), as updated by Han, Podsiadlowski & Eggleton (1994) and Pols et al. (1995, 1998), to obtain the details of a model, such as the central hydrogen abundance. The Hurley codes can rapidly reproduce stellar models computed by using the Eggleton’s stellar evolution code. The equation of state of Eggleton, Faulkner & Flannery (1973) as modified by Pols et al. (1995), OPAL (Rogers & Iglesias, 1992) and Alexander & Ferguson (1994) opacity tables, and standard mixing-length theory are used in the Eggleton’s code. The value of the mixing-length parameter and convective overshooting parameter (Pols et al., 1998) is set as 2.0 and 0.12, respectively. However, element diffusion for helium and metals is not taken into account. In addition, the theoretical and were calculated by using scaling equations (Brown et al., 1991; Kjeldsen & Bedding, 1995)
| (1) |
and
| (2) |
The accuracy of these estimates is good to within 5% for a star given mass, radius and effective temperature (Stello et al., 2009a).
The paper is organized as follows. We show our stellar population-synthesis method in section 2. We present the results in section 3 and discuss and summarize them in section 4.
2 Stellar population synthesis
To simulate the distributions of and of clusters with different metallicities and various ages, we have performed detailed Monte Carlo simulations for a binary-star stellar population (BSP). The basic assumptions for the simulations are as follows. The lognormal initial mass function (IMF) of Chabrier (2001) is adopted. Firstly, we generate the mass of the primary, , according to the IMF. For simplicity, the ratio () of the mass of the secondary to that of the primary and eccentricity (e) are assumed to be a uniform distribution within 0-1. The mass of the secondary star is then determined by . We assume that all stars are members of binary systems and that the distribution of separations is constant in for wide binaries and falls off smoothly at close separation:
| (3) |
where , , and . This distribution implies that the number of wide binary systems per logarithmic interval is equal, and that approximately 50% of the stellar systems are binary systems with orbital periods less than 100 yr (Han, Podsiadlowski & Eggleton, 1995). With these assumptions, we calculated the evolutions of 5 binaries with between 0.8 and 5.0 to obtain their mass, radius and effective temperature. The and of these stars were calculated using equations (1) and (2).
3 Calculation results
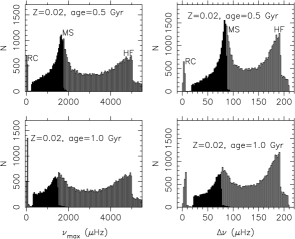
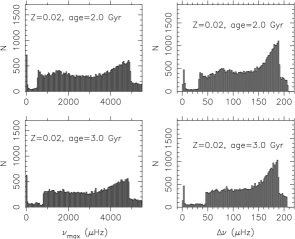
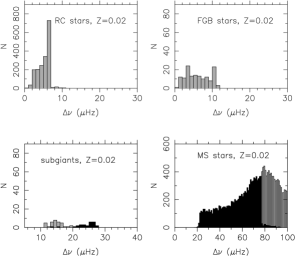
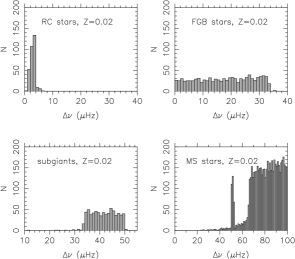
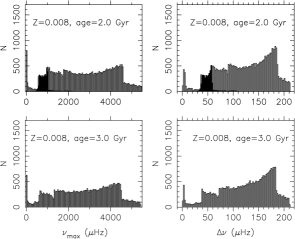
Figure 1 shows the histograms of and of simulated clusters with the same metallicity (0.02) but different ages. Stars hotter than the red edge of the instability strip (Cunha, 2002) are generally not expected to exhibit solar-like oscillations. The red edge locates roughly between 6500K and 7000K in our models. The characteristics of theoretical acoustic modes of these stars were studied by Audard & Provost (1994) and Stello et al. (2009a). They showed that the theoretical large separation of these stars could be obtained from their mean density with an uncertainty of about 10 per cent. Some stars on the left of the red edge may oscillate as rapidly oscillating Ap (roAp) stars (Cunha, 2002; Balona et al., 2010). A pattern of nearly equally spaced frequencies and low frequencies may exist in these stars (Balona et al., 2010). In our sample, these stars occur mainly in clusters with age 2.0 Gyr and are not discarded. However, in order to distinguish them from stars expected to exhibit solar-like oscillations, they are shown in black in Figs. 1, 2, 6, 7 and 8. Moreover, the histograms of of red-clump (RC) stars, i.e. core-helium-burning stars, first giant branch (FGB) stars, subgiants and MS stars of the clusters with age = 1.0 and 5.0 Gyr are plotted in Figs. 2 and 3, respectively.
3.1 Gaps
Figure 1 shows that the distributions of and of young clusters are obviously different from those of old clusters. A notable characteristic of the distributions is that there is a gap (RC-MS gap) between the histogram of RC stars and that of MS stars. This gap becomes wider with increasing age. It nearly disappears when age 5 Gyr.
In spite of this fact, there are many stars hotter than the red edge of the instability strip. For the cluster with age = 0.5 Gyr, the RC-MS gap is located in the range about 6-18 Hz for and about 80-240 Hz for . For the cluster with age = 1.0 Gyr, Fig. 2 shows that the values of are basically located in the range about 1-10 Hz for RC stars and FGB stars, and in the range about 10-30 Hz for subgiants, while the values are mostly larger than 20 Hz for MS stars. In addition, the number of subgiants is very small in this cluster, which leads to the appearance of the gap between about 10 and 20 Hz. For the cluster with age = 5.0 Gyr, Fig. 3 shows that the values of are almost uniformly distributed in the range of about 1-34 Hz for FGB stars and that of about 34-50 Hz for subgiants, and that the values are mostly larger than 50 Hz for MS stars. However, the of RC stars is almost concentrated in a narrow range of 1-6 Hz. Thus, although the number of RC stars is less than that of FGB stars and that of subgiants (see Fig. 4), the RC-MS gap still exists in the distribution of . It becomes wider in comparison with that in the cluster with age = 1.0 Gyr. However, Fig. 1 shows that the RC-MS gap of clusters with age 2.0 Gyr can be affected by the stars hotter than the red edge of the instability strip. If these stars are discarded, the RC-MS gap should be significantly enlarged. But for the clusters with age 2.0 Gyr, the distributions of and are not affected by these stars.
The stars located in the RC-MS gap are primarily subgiants for young clusters, but the stars located in the gap are mainly subgiants and FGB stars, with a small number of RC stars and of MS stars for ‘middle-age’ clusters. The number of subgiants and FGB stars increases with age, which results in the gradual disappearance of this gap with increasing age. The mass of stars in an old cluster is less than that of the stars in the same evolutionary stage of a younger cluster, which is partly due to a more significant mass-loss for old stars, especially for the RC stars. In addition, except the RC stars, for stars in the same evolutionary phase generally the lower the mass, the higher the mean density, i.e. the larger the . Thus with regard to the values of of subgiants, FGB stars on the bottom of a FGB and the MS stars at the end of a MS increase with increasing age. But the values of of RC stars remain in the range of about 1-10 Hz. Consequently, the RC-MS gap becomes wider with increasing age.
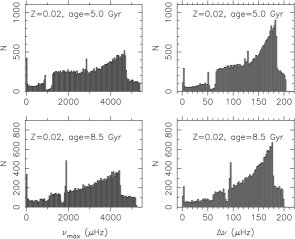

Moreover, Fig. 3 reveals clearly that another gap (MS gap) exists in the histogram of MS stars. For the cluster with age = 5 Gyr, this gap is located in the range 53-65 Hz for and 920-1200 Hz for . Our calculations show that the location of this MS gap changes with age and that it mainly appears in clusters with age 4.5 Gyr. This MS gap corresponds to the hydrogen-exhausted phase gap, or MS hook (Hurley, Pols & Tout, 2000). For stars with 1.1 , their core is convective. Owing to mixing in the core there is a sudden depletion of fuel over a large region, which leads to a rapid contraction of the core and expansion of the radius on a thermal time-scale (Hurley, Pols & Tout, 2000). This causes the appearance of the MS hook in the Hertzsprung-Russell diagram and the MS gap in the distributions of and .
There are some sharp edges in the distributions of and in Figs. 1 and 2. For example, the edge between the histogram of of MS stars and that of subgiants in the cluster with age = 3.0 Gyr in Fig. 1 and the edge of distribution of RC stars in Fig. 2. For the cluster with Z = 0.02 and age = 3.0 Gyr, stars with 1.45 are MS stars, while most stars with 1.45 have evolved into the MS hook or a later stage. For stars with 1.45 , the time spent in the MS hook is a thermal time-scale, which is far less than the time of hydrogen burning. Thus the number of stars in the MS hook are few in our sample. In addition, the radius of these stars expands very rapidly in the MS-hook stage, i.e. their mean density decreases very fast, which leads to a dispersion of their in a wide range of 20-46 Hz. Therefore, there is a sharp edge between the histogram of of MS stars and that of subgiants. For a RC star, its mean density is highest when it is on zero-age horizontal branch (ZAHB). The evolution of a star from the top of FGB to ZAHB is very rapid. For the cluster with Z = 0.02 and age = 1.0 Gyr, the mass of RC stars is located almost solely in the range 2.1-2.3 , while stars with lower mass are mainly in the FGB or an earlier stage. The stars with mass between 2.1 and 2.2 are very close to ZAHB. The values of of these stars are concentrated in the range 6.0-7.0 Hz. Hence, the distribution of of RC stars has a sharp edge.
Fig. 4 represents the evolution of fractions of subgiants, FGB and RC stars in a cluster. Our calculations show that the fractions of FGB and RC stars are scarcely affected by metallicity. In clusters with age 1 Gyr, more than 90 per cent of red giants (including only FGB and RC stars) are RC stars. But over 80 per cent of red giants are FGB stars in clusters with age 8.0 Gyr. However, the fraction of RC stars is approximately equal to that of FGB stars in clusters with age 2.5 Gyr, which is caused by the fact that for low mass stars the time spent ascending the FGB is basically comparable with that of the core helium-burning of the more massive stars in these clusters.
3.2 Peaks
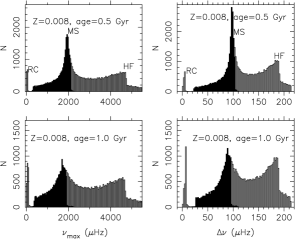
Except for the gaps, Fig. 1 shows that there are three peaks in the distributions of and of young clusters. One is at ‘low’ frequencies (labeled RC peak), one is at ‘middle’ frequencies (labeled MS peak), and another is at ‘high’ frequencies (labeled HF peak). Figs. 2 and 3 display clearly that the RC peak derives mainly from RC stars, and that the MS peak is from MS stars. The HF peak derives also from MS stars and is caused by IMF. For MS stars with the same age and metallicity, the lower the mass, the higher the mean density, i.e. the larger the and . In addition, according to IMF, the lower the stellar mass, the more the number of stars. Thus there is a peak at ‘high’ frequencies. In our models, the HF peak is caused by the stars with 0.8 , which is the lower limit of the initial mass of the primary star in a primordial binary system. Because the mean density, i.e. the , of a MS star decreases with age, the location of the HF peak moves to a lower frequency with increasing age. The HF and RC peaks exist in clusters with different ages. However, the MS peak barely appears in young clusters with age 1 Gyr; and it disperses gradually with increasing age.
A RC peak had been observed by CoRoT (Hekker et al., 2009). When age 2.0 Gyr, the dominant RC peak is located approximately between 2.5 and 4 Hz, which is not sensitive to age. However, when age 2 Gyr, the location of the dominant RC peak is sensitive to age. For example, the dominant peak is located at about 3.5-4.5 Hz for the cluster with age = 0.5 Gyr, whereas it is located at about 6-7 Hz for the cluster with age = 1.0 Gyr. Moreover, our calculations show that the dominant RC peak of the cluster with age 1.2 Gyr is located at approximately 7-8 Hz, which is higher than the values of other clusters. The RC peak is caused by the fact that the radius of many RC stars near the ZAHB concentrates in a certain range. For example, the mass of RC stars of the simulated cluster with Z =0.02 and age = 1.0 Gyr is almost uniformly distributed in the range 2.13-2.28 . However, most of these stars have a radius in the range 9.3-10.5 , which results in a concentration of in the range of about 6-7 Hz.
In stars more massive than about 2.0 (this value can be affected by the convective overshooting parameter ), helium-burning temperatures are reached at the center before electrons become degenerate there (Hurley, Pols & Tout, 2000). For these stars, when they reach the ‘ZAHB’, their mean densities decrease with increasing mass, just like ZAMS. However, for stars with 2.0 , electrons in the hydrogen-exhausted core are highly degenerate before helium ignition occurs. The radius of these stars on the ZAHB depends mainly on the mass of the hydrogen-exhausted core at the time of helium ignition and on the mass of the overlying envelope. The mean density of these stars on the ZAHB does not depend simply on the total mass, but it is usually less than the mean density of stars with 2.0 . Thus a ZAHB star with 2.0 has the highest mean density. Furthermore, for stars with 2.0 the temperature and density distributions in the core are almost unique functions of the core mass (Iben, 1974). For stars with 1.6 , when they reach the ZAHB, their radius and the mass of their envelopes decrease with the decrease in the total mass, but the core mass is approximately equal. Their mean densities are approximately equal too, which leads to a similar value of for these stars on the ZAHB. The mass of many ZAHB stars in the cluster with Z = 0.02 and age 1.2 Gyr is about 2.0 , hence the frequency of the dominant RC peak of this cluster is larger than that of other clusters. The mass of RC stars in clusters with Z = 0.02 and age 2.4 Gyr is less than 1.6 , so that the locations of the dominant RC peaks of these clusters are almost same. The asteroseismical observation for red giant stars of clusters with age 2.4 Gyr may provide a help to test the theory of the degeneracy of hydrogen-exhausted core. Differing from the MS peak that exists only in young clusters, the RC peak exists in almost all clusters. This is because the RC stars near the ZAHB exist in clusters with different ages in our simulations.
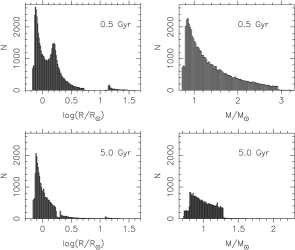
The histograms of the radius and mass of clusters with age = 0.5 and 5.0 Gyr are shown in Fig. 5. The distributions of the mass have only one peak, at about 0.8 , which is caused by IMF. However, the distributions of the radius are similar to those of and . There are three peaks in radius distribution of the cluster with age = 0.5 Gyr. The ‘low-radius’ peak corresponds to the HF peak of , the ‘middle-radius’ peak to the MS peak of , and the ‘high-radius’ peak to the RC peak of . However, when age = 5 Gyr, there is no ‘middle-radius’ peak in the distribution of the radius and also no MS peak in the distribution of . This clearly shows that the MS peak is caused by the fact that many young MS stars have approximately the same radii, and the distribution of is more sensitive to the distribution of the radius than to that of the mass.
Moreover, Fig. 5 shows that both the ‘low-mass’ peak and ‘low-radius’ peak are significant for the cluster with Z = 0.02 and age = 0.5 Gyr. They correspond to the HF peaks. However, Fig. 1 shows that the MS peaks of and are more significant than the HF peaks. This is because the of ‘low-mass’ stars decreases more quickly with increasing mass than that of ‘middle-mass’ stars in the cluster. For example, when the mass of a star with Z = 0.02 increases from 0.8 to 0.9 , its radius increases from approximately 0.727 to 0.806 at 0.5 Gyr, which leads to a decrease of about 17.5 Hz in the of that star. However, when the mass of a star increases from 1.55 to 1.65 , its radius increases from 1.566 to 1.644 , which results in a decrease of about only 3.5 Hz in the of that star. Thus, although the number of stars with mass between 0.8 and 0.9 is about twice as much as that of stars with mass between 1.55 and 1.65 , the interval of of the former is 5 times as wide as that of the latter. Therefore the MS peaks are more significant than the HF peaks.
Using Eggleton’s stellar evolution code, we calculated the evolutions of stars with Z = 0.02 and mass between 1.55 and 1.65 . Our calculations show that these stars have an approximate radius between 1.465 and 1.492 at the age of about 40 Myr, which leads to almost the same mean density, i.e. almost the same . However, the mean density of a MS star decreases with age. Since a high mass star evolves faster than a lower mass star, the mean density of a star with = 1.65 decreases faster than that of a star with = 1.55 . Thus the of stars with mass between 1.55 and 1.65 disperses gradually with increasing age. For example, the difference in between these two models is about 3.5 Hz at the age of 0.5 Gyr, but it is about 8 Hz at the age of 1.0 Gyr. Thus a MS peak exists only in young clusters. It moves toward a low frequency and disperses gradually with increasing age.
Figs. 1 and 3 show that there is another peak on the left of the MS gap for the cluster with age = 5.0 Gyr. For stars with 1.3 , when their central convection ceases, the central hydrogen is not exhausted. The lower the mass, the more the remaining hydrogen. Thus these stars can stay between the MS hook and Hertzsprung gap for a long time, which leads to the presence of a peak or bump between the RC-MS gap and the MS gap. For the cluster with Z = 0.02 and age = 7.0 Gy, the peak can become a bump. For stars with 1.3 , when the central convection ceases, the central hydrogen is almost exhausted. After the MS hook, they evolve rapidly into the Hertzsprung gap. In addition, the higher the mass, the shorter the thermal time-scale. Therefore the number of stars in the MS gap of a ‘young’ cluster is less than that in the MS gap of an ‘old’ cluster, and there is no the peak between the MS gap and RC-MS gap in ‘young’ clusters. The MS hook takes place after the central hydrogen abundance of stars decreases to about 0.05. The central hydrogen abundance of stars in the MS gap is about 0.05-0.001, but that of stars in the peak on the left of the MS gap is less than 0.001. For clusters with 1.3 , the central hydrogen abundance of most stars in the lower boundary of the histogram of the of MS stars should be about 0.05. Thus the asteroseismical observation for turn-off stars of ‘middle-age’ clusters is very important for testing theories of stellar evolution and stellar population synthesis.
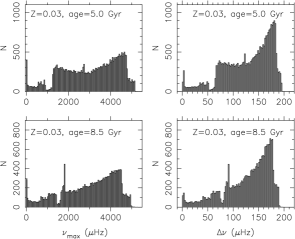
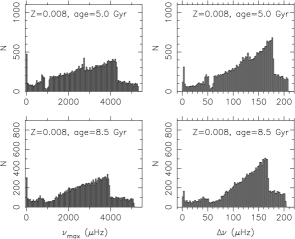
Moreover, Figs. 1 and 6 show that there is a sharp peak in the distributions of the and of MS stars of clusters with age = 5.0 and 8.5 Gyr. When age increases from 5.0 to 8.5 Gyr for clusters with Z = 0.02, the location of the sharp peak moves from about 2860 to around 1920 Hz for and shifts from about 130 to around 95 Hz for . These peaks also exist in the distributions of and of the cluster with Z = 0.008 and age = 7.0 Gyr. These sharp peaks are derived from the models with mass between approximately 1.02 and 1.04 for all clusters. The mean density of the models decreases with age. Thus, the locations of the sharp peaks move from a high frequency to a lower one. Using Eggleton’s stellar evolution code, we performed detailed model calculations. We did not find any particularity in the evolutions of the models with mass between 1.02 and 1.04 . Comparing evolutionary tracks computed using Eggleton’s code with those computed using the Hurley code, we find that the Hurley code cannot reproduce exactly the evolutionary tracks of late phases of the MS of the models with mass between 1.02 and 1.04 . Nor can it reproduce well the mean densities of the models. According to the Hurley code, the mean densities are almost equal, which leads to the appearance of the sharp peaks. In fact, the mean densities of the models as given by Eggleton’s code are not equal. In any case, the sharp peaks that appear in the application of the Hurley code are artefacts. Because the Hurley code fails to reproduce well the mean densities of these models, it in effect places the models one on top of another in the and plots. Nonetheless, the Hurley code can reproduce well the mean density as well as the evolutionary tracks of early phases of the MS of the models with mass between about 1.02 and 1.04 . Thus the sharp peaks do not appear in the distributions of and of clusters with age 3.0 Gyr.
3.3 Effect of metallicity on peak locations
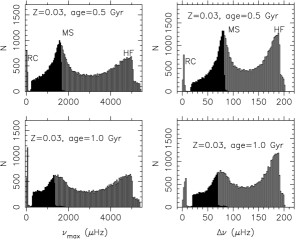
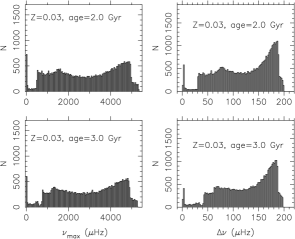
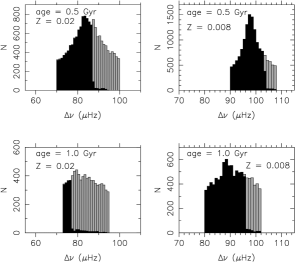
The distributions of and of clusters with Z = 0.03 and 0.008 are shown in Figs. 6 and 7, respectively. For young clusters, these distributions have similar characteristics: a gap and three peaks. Figs. 1, 6 and 7 show that the distributions of and are obviously affected by metallicity. In spite of the fact that there are many stars hotter than the red edge of the instability strip, Fig. 8 shows that the location of the dominant MS peak is sensitive not only to age, but also to metallicity. When age increases from 0.5 Gyr to 1.0 Gyr, the frequency of the peak location decreases from 83 Hz to 79 Hz for clusters with Z = 0.02, but decreases from 98 Hz to 88 Hz for clusters with Z = 0.008. However, the location of dominant RC peak is not sensitive to metallicity. For example, for clusters with age = 1.0 Gyr, the peak location shifts only 1 Hz when the metallicity decreases from 0.03 to 0.008. In young clusters with age 2.0 Gyr, there are many stars hotter than the red edge of the instability strip. In a survey of solar-like oscillations, these stars may be discarded. The location of the MS peak would then be affected. For the cluster with Z = 0.008 and age = 0.5 Gyr, the MS peak is mainly composed of such stars; so there should exist no MS peak in the distribution of solar-like oscillation frequencies. For clusters with Z 0.02, however, the stars hotter than the red edge of the instability strip are located mainly on the left of the dominant MS peaks of and . Hence a MS peak may exist in these clusters. The asteroseismical observation of young clusters with a high metallicity, especially for MS stars, may aid in determining the age and metallicity of these clusters.
4 Discussions and Conclusions
In our simulations, we calculated the evolutions of 5 binaries for a cluster. However, even though the number of initial models decreases to 2000 binaries, our results are not affected. Stars hotter than the red edge of the instability strip are not discarded in our models, but they have been shown in black. For all clusters with age 2.0 Gyr except the one with Z = 0.008, the distributions of and are not affected by these stars. Although these stars are not expected to exhibit solar-like oscillations, they may exhibit other kinds of oscillation.
The evolutions of wide binary stars are similar to those of single stars. Strong binary interactions, such as mass transfer and mass accretion, can lead to either a decrease or increase in the mass of such binary stars. The and values of these stars can obviously be changed. Thus for a specific binary system, the effect of binary interactions on oscillations is significant. On the one hand, however, the fraction of these interactive binary stars in our samples is very small. On the other hand, the effect of mass loss of some stars on the distributions of and can be partly counteracted by that of mass accretion of other stars. Therefore, the effect of binary interactions on the distributions of and is not significant. We also calculated the BSP using Salpeter (1955) IMF and other assumptions for , and , such as , and = constant (Hurley, Tout & Pols, 2002), and single-star stellar population. Our calculations show that results are similar. Thus the assumptions concerning the BSP can not significantly affect the distributions of and for the fraction of interactive binary stars is not significantly enhanced.
The OPAL (Rogers & Iglesias, 1992) used in the Eggleton code is out of date. However, Chen & Tout (2007) show that the effect of the differences between OPAL (Rogers & Iglesias, 1992) and OPAL (Iglesias & Rogers, 1996) on the evolutions of low-mass stars is negligible. Element diffusion for helium and metals is very important in the evolution of solar-type stars, especially for asteroseismology. However, this effect cannot be considered in the Hurley code. If this effect is considered, our results may be affected. The distributions of and of RC stars can be affected by the mixing-length parameter (Yang, Meng & Li, 2010). Moreover, the distributions can be affected by the overshooting parameter . The RC peak moves to a lower frequency when the increases.
For the simulated clusters with a given age, the lower the metallicity, the lower the mass of stars in the same evolutionary phase. Thus the locations of the RC and MS peaks move to a higher frequency when metallicity decreases. Furthermore, the radius of MS stars is more sensitive to the initial metallicity than the radius of RC stats; so the MS peak is more sensitive than RC peak to the metallicity.
The age of the open clusters NGC 6866, NGC 6811, NGC 6819 and NGC 6791 is approximately 0.4, 1.0, 2.5 and 8.5 Gyr (Stello et al., 2010b), respectively. The fraction of FGB and RC stars in a cluster is scarcely affected by metallicity. According to our calculations, about 90 per cent of red giants of NGC 6866 and NGC 6811 could be RC stars, but about 80 per cent of red giants of NGC 6791 could be FGB stars. In cluster NGC 6819, the fraction of RC stars could be approximately equal to that of FGB stars. For the cluster NGC 6791, because the values of the of most FGB stars are larger than those of RC stars, most FGB stars could be distinguished by asteroseismical observation. The MS peak of might be observed at about 85-95 Hz in NGC 6866, and the dominant peak of RC stars could be located between 6 and 8 Hz for NGC 6811.
For young clusters, there are three peaks and a gap in the distributions of and . The gap corresponds to the Hertzsprung gap in the Hertzsprung-Russell diagram. The MS peak exists only in ‘young-age’ clusters. The dominant MS peak moves to a lower frequency with increasing age or metallicity. Stars hotter than the red edge of the instability strip are almost all located on the left of the dominant MS peak for clusters with Z 0.02. In addition, for clusters with 1.1 1.3 , there are a MS gap and a peak on the left of the MS gap in the distributions of and . The RC peak is caused by the fact that the radius of many RC stars near the ZAHB concentrates in a certain range; and the MS peak is caused by the fact that the radius of many young MS stars with mass in a certain range concentrates in a certain range. In other words, in a cluster, the mean density of many RC stars is approximately the same, which leads to the RC peak; the mean density of many young MS stars with mass in a certain range is approximately the same, which leads to the MS peak. For clusters with Z = 0.02, the frequency of location of the dominant RC peak increases with age when age 1.2 Gyr. It then decreases with age when age 1.2 Gyr, but it scarcely varies when age 2.4 Gyr. The helium core of stars with 2.0 is non-degenerate, but that of stars with 2.0 is degenerate at the time of helium ignition, which results in the fact that the change of the RC peak with age is different. The dominant peak of RC stars of the cluster with 2.0 is located at the highest frequency. The asteroseismical observation for clusters with age 2.4 Gyr may aid in testing the theory of the degeneracy of hydrogen-exhausted core.
Acknowledgments
We thank the anonymous referee for his/her helpful comments and Daniel Kister for his help. This work was supported by China Postdoctoral Science Foundation funded project 20100480222, the Ministry of Science and Technology of the People’s republic of China through grant 2007CB815406, the NSFC though grants 10773003, 10933002, 10963001, 11003003, and project of the fundamental and frontier research of Henan province under grant no. 102300410223.
References
- Alexander & Ferguson (1994) Alexander D. R., Ferguson J. W., 1994, ApJ, 437, 879
- Audard & Provost (1994) Audard N., Provost J., 1994, A&A, 282, 73
- Baglin et al. (2006) Baglin A. et al., 2006, in ESA Special Publication, Vol. 1306, ESA Special Publication, ed. M. Fridlund, A. Baglin, J. Lochard and L. Conroy, p.33
- Balona et al. (2010) Balona L. A. et al., 2010, MNRAS, 410, 517
- Brown et al. (1991) Brown T. M., Gilliland R. L., Noyes R. W., Ramsey L. W., 1991, ApJ, 368, 599
- Catala (2009) Catala C., 2009, Comm. in Astroseismology, 158, 330
- Chabrier (2001) Chabrier G., 2001, ApJ, 554, 1274
- Chen & Tout (2007) Chen X., Tout C.A., 2007, ChJAA, 7, 245
- Christensen-Dalsgaard (2002) Christensen-Dalsgaard J., 2002, Reviews of Modern Physics, 74, 1073
- Cunha (2002) Cunha M. S., 2002, MNRAS, 333, 47
- Edmonds & Gilliland (1996) Edmonds P. D., Gilliland R., 1996, ApJ, 464, L157
- Eggenberger & Carrier (2006) Eggenberger P., Carrier F., 2006, A&A, 449, 293
- Eggleton (1971) Eggleton P. P., 1971, MNRAS, 151, 351
- Eggleton (1972) Eggleton P. P., 1972, MNRAS, 156, 361
- Eggleton (1973) Eggleton P. P., 1973, MNRAS, 163, 279
- Eggleton, Faulkner & Flannery (1973) Eggleton P. P., Faulkner J., Flannery B. P., 1973, A&A, 23, 325
- Frandsen et al. (2007) Frandsen S. et al., 2007, A&A, 475, 991
- Gabriel (1989) Gabriel M., 1989, A&A, 226, 278
- Gilliland et al. (1993) Gilliland R. L. et al., 1993, AJ, 106, 2441
- Gilliland (2008) Gilliland R. L., 2008, ApJ, 136, 566
- Gilliland et al. (2010) Gilliland R. L. et al., 2010, PASP, 122, 131
- Gough (1987) Gough D. O., 1987, Nature, 326, 257
- Han, Podsiadlowski & Eggleton (1994) Han Z., Podsiadlowski P., Eggleton P. P., 1994, MNRAS, 270, 121
- Han, Podsiadlowski & Eggleton (1995) Han Z., Podsiadlowski P., Eggleton P. P., 1995, MNRAS, 272, 800
- Hekker et al. (2009) Hekker S. et al., 2009, A&A, 506, 465
- Hurley, Pols & Tout (2000) Hurley J. R., Pols O. R., Tout C. A., 2000, MNRAS, 315, 543
- Hurley, Tout & Pols (2002) Hurley J. R., Tout C. A., Pols O. R., 2002, MNRAS, 329, 897
- Iben (1974) Iben I, Jr., 1974, ARA&A, 12, 215
- Iglesias & Rogers (1996) Iglesias C. A., Rogers F. J., 1996, ApJ, 464, 943
- Kallinger et al. (2010) Kallinger T. et al., 2010, A&A, 509, 77
- Kjeldsen & Bedding (1995) Kjeldsen H., Bedding T. R., 1995, A&A, 293, 87
- Koch et al. (2010) Koch D. G. et al., 2010, ApJ, 713, L79
- Miglio et al. (2009) Miglio A. et al., 2009, A&A, 503, L21
- Mosser et al. (2010) Mosser B. et al., 2010, A&A, 517, 22
- Pols et al. (1995) Pols O. R., Tout C. A., Eggleton P. P., Han Z., 1995, MNRAS, 274, 964
- Pols et al. (1998) Pols O. R., Schroder K. P., Hurley J. R. Tout C. A., Eggleton P. P., 1998, MNRAS, 298, 525
- Rogers & Iglesias (1992) Rogers F. J., Iglesias C. A., 1992, ApJS, 79, 507
- Roxburgh & Vorontsov (2000) Roxburgh I. W., Vorontsov S. V., 2000, MNRAS, 317, 141
- Roxburgh et al. (2007) Roxburgh Ian et al., 2007, Comm. in Astroseismology, 150, 357
- Salpeter (1955) Salpeter E. E., 1955, ApJ, 121, 161
- Stello et al. (2007) Stello D. et al., 2007, MNRAS, 377, 584
- Stello & Gilliland (2009) Stello D., Gilliland R. L., 2009, ApJ, 700, 949
- Stello et al. (2009a) Stello D., Chaplin W. J., Basu S., Elsworth Y., Bedding T. R., 2009a, MNRAS, 400, L80
- Stello et al. (2009b) Stello D. et al., 2009b, ApJ, 700, 1589
- Stello et al. (2010a) Stello D. et al., 2010a, ApJ, 713, L182
- Stello et al. (2010b) Stello D. et al., 2010b, AN, 331, 985
- Yang & Bi (2007) Yang W., Bi S., 2007, A&A, 472, 571
- Yang & Meng (2009) Yang W., Meng X., 2009, PASJ, 61, 1399
- Yang & Meng (2010) Yang W., Meng X., 2010, New Astron., 15, 367
- Yang, Meng & Li (2010) Yang W., Meng X., Li Z., 2010, MNRAS, 409, 873
- Ulrich (1986) Ulrich R. K., 1986, ApJ, 306, L37