Multilevel Analysis of Oscillation Motions in Active Regions of the Sun
Abstract
The nature of the three-minute and five-minute oscillations observed in sunspots is considered to be an effect of propagation of magnetohydrodynamic (MHD) waves from the photosphere to the solar corona. However, the real modes of these waves and the nature of the filters that result in rather narrow frequency bands of these modes are still far from being generally accepted in spite of a large amount of observational material obtained in a wide range of wave bands of observations. The significance of this field of research is based on the hope that local seismology can be used to find the structure of the solar atmosphere in magnetic tubes of sunspots. We expect that substantial progress can be achieved by simultaneous observations of the sunspot oscillations in different layers of the solar atmosphere in order to gain information on propagating waves. In this study we used a new method that combines the results of an oscillation study made in optical and radio observations. The optical spectral measurements in photospheric and chromospheric lines of the line-of-sight velocity were carried out at the Sayan Solar Observatory. The radio maps of the Sun were obtained with the Nobeyama Radioheliograph at 1.76 cm. Radio sources associated with the sunspots were analyzed to study the oscillation processes in the chromosphere–corona transition region in the layer with magnetic field G. A high level of instability of the oscillations in the optical and radio data was found. We used a wavelet analysis for the spectra. The best similarities of the spectra of oscillations obtained by the two methods were detected in the three-minute oscillations inside the sunspot umbra for the dates when the active regions were situated near the center of the solar disk. A comparison of the wavelet spectra for optical and radio observations showed a time delay of about 50 seconds of the radio results with respect to optical ones. This implies a MHD wave traveling upward inside the umbral magnetic tube of the sunspot. For the five-minute oscillations the similarity in spectral details could be found only for optical oscillations at the chromospheric level in the umbra region or very close to it. The time delays seem to be similar. Besides three-minute and five-minute ones, oscillations with longer periods (8 and 15 minutes) were detected in optical and radio records. Their nature still requires further observational and theoretical study though for even a preliminary discussion.
keywords:
Oscillations, Solar; Radio Emission, Active Regions; Sunspots, Velocity; Waves, Magnetohydrodynamic1 Introduction
S-Introduction
The study of oscillatory motions is one of the most significant methods of plasma structure analysis of the solar atmosphere (Beckers and Schultz, 1972; Bhatnagar, Livingston and Harvey, 1972; Zhugzhda and Dzhalilov, 1982; Staude, 1999; Zhugzhda, Balthasar, and Staude, 2000). Currently investigations are carried out in different wavelength ranges from radio to EUV and X-rays, which are based on ground and cosmic observations. Because the structuring of the plasma is directly connected with such fundamental astrophysical problems as accumulation and release of energy, its investigation with this quickly developing method is essential for progress in understanding the physics of coronal heating and the origin of flares. Quasi-periodic oscillations (QPO) are recorded in practically all wavelength ranges and in all structures of the solar atmosphere and show up at isolated frequencies with periods from fractions of a minute to hours or even days [Bogdan (2000), Fludra (2001), Gelfreikh et al. (2006)]. Most of these oscillations are of an unstable nature: both amplitude and frequency vary with time and the oscillations are often seen as packets of about a dozen periods. Wavelet analysis is a more appropriate tool than the traditional spectral Fourier analysis.
The observed QPOs are caused by magneto-hydrodynamic waves of different kinds. They include oscillations of the local closed resonance structures as well as global ones, and effects of MHD wave propagation of different types. In the latter case an explanation for the appearance of some isolated periods requires filtering on the way to the region where the observed emission is generated. The choice of an adequate theory for interpreting these observations includes several essentially complicated problems that do not have an adequate solution at present, and involves models of both the solar atmosphere and the layers below the solar surface.
Though many types of QPOs, especially above sunspots, have been studied for decades (Lites, 1992; Lites et al., 1998; Bogdan, 2000; Bogdan and Judge, 2006), their nature and fine structure are not yet satisfactorily understood. One of the reasons is directly related to the problems of satisfactory and reliable methods of observations. For many years the investigations of the sunspot-associated oscillations were conducted only by optical methods that represented the phenomena at the level of the photosphere and chromosphere. Modern techniques of observations from space facilitate the study of the oscillations in the corona and transition region. However, the magnetic tube of a sunspot does not appear in these pictures as it could be if followed on a lower level of optical identifications. Progress in those studies was achieved with radio mapping of the sun at microwaves. On the radio maps the sunspots are clearly seen as bright highly polarized small radio sources generated by thermal cyclotron emission of coronal electrons at lower harmonics of their gyrofrequency; magnetic field of thousands of Gauss is needed for the effect [Gelfreikh and Lubyshev (1979), Nindos et al. (1996), Nindos et al. (2002)].
For the analysis of the three-dimensional structure of the QPOs one needs parallel observations in several wavelength ranges. For a realization of this program, however, it is necessary to make simultaneous observations of same object. New results of such observational programs are the main topic of the present paper.
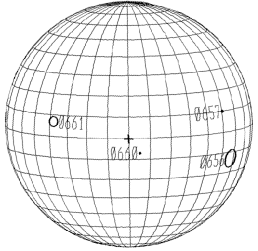
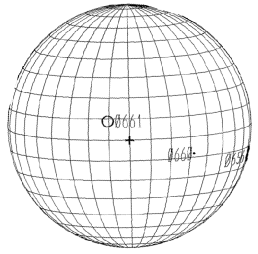
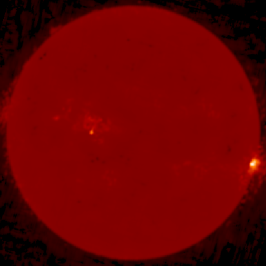
We have analyzed the active region NOAA 10661 in August 2004 from the Sayan Solar Observatory [Kobanov, Kolobov, and Makarchik (2006)] and simultaneous radio measurements of the same AR at wavelength cm found from radio maps of the Nobeyama Radioheliograph (similar to \openciteGelfreikh99; \openciteShibasaki01a; \openciteShibasaki01b). The magnetic field at the photosphere was measured in the line Fe i 6569 Å and line-of-sight (LOS) velocities in the chromosphere registered in H line. Radio maps with 10 – 15 arcsec resolution, both in intensity and circular polarization, clearly showed the structure of the analyzed AR with compact bright sources above large sunspots. The comparison of observational data was carried out with a wavelet spectral analysis made for sunspot details and other structures registered in optical observations and sunspot-associated brightness found from the radio maps.
Both optical and radio wavelet spectra show many identical structures. The differences are also discussed. The degree of similarity of the two types of observation vary with the position of the AR on the solar disk. Future directions of the development of the illustrated method of the solar physics are discussed.
2 Optical Observations
S-optical_observations
Optical observations were carried out with the horizontal solar telescope of the Sayan Solar Observatory of the Institute of Solar-Terrestrial Physics of the Siberian Division of the Russian Academy of Sciences (Kobanov and Makarchik, 2004a; Kobanov and Makarchik, 2004b). The line-of-sight (LOS) velocity and longitude component of the magnetic field (using line Fe i 6559 Å, g=1.4) at the photosphere and the LOS velocity in the chromospheric H line were obtained. The slit of the spectrograph was east – west directed, crossing the center of the sunspot. The spatial resolution was about one arcsec along the spectrograph slit. The instrumental shifts of the spectrum were determined using an H2O telluric line near H. These shifts were subtracted from the calculated signals. In order to eliminate aliasing, the time between expositions was shorter than the duration of an exposition.
We used a Dove prism installed just in front of the slit. The prism was usually rotated so that the slit was parallel to the east-west direction on the sunspot image.
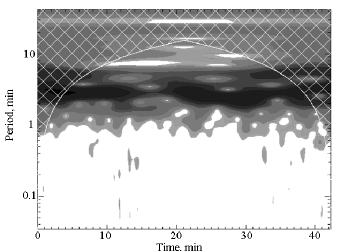
The duration of one set of observations was about one hour with a cadence of a few seconds. While analyzing the observations we used wavelet spectra with Morlet functions of the sixth order as a base function (see \openciteTorrence98, \openciteKobanov06). We use the 95% confidence level (2 ) as criterion of reliability of the oscillations.
Table \irefT-ar presents the main parameters of the optical observations used in this study.
| Date | Coordinates | Time of observations |
|---|---|---|
| UT | ||
| 2004–Aug–15 | (N 07,E 58) | 04:04:00 – 05:04:00 |
| 2004–Aug–16 | (N 07,E 46) | 00:58:00 – 01:41:00 |
| 2004–Aug–18 | (N 07,E 20) | 01:01:00 – 01:43:00 |
T-ar
3 Radio Observations
S-radio_observations
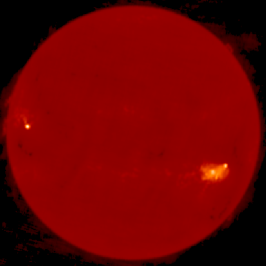
Nobeyama Radioheliograph (Nakajima et al., 1994) observations at 1.76 cm were used to study the same sunspots. Radio maps of the whole disk were constructed for the dates of observations with the temporal interval of ten seconds between the maps and ten seconds averaging. We constructed intensity and circular polarization maps. Bearing in mind that the sunspot-associated sources generated by thermal gyroresonance emission at the third harmonic of the electron gyrofrequency are the most sensitive to oscillation processes, we studied only those cases where such sources were present. The identification of the nature of a source is based on its high brightness temperature and strong polarization. The 2D spatial resolution of the radio maps was about 10 – 15 arcsec.
For the wavelet analysis we used the same method as for the analysis of optical data. We used wavelet spectra with Morlet functions of the sixth order and the 95% confidence level as criterion of reliability of the oscillations. Wave-trains of three-minute oscillations lasted more than 10 minutes. It is an additional argument for the reality of the oscillations. Moreover, we calculated the cross-wavelet transform and wavelet coherency between optical and radio time series (Figure \irefcross_wavelet). Obviously the wave-trains of the optical and radio data agree well. Consequently this is certainly not a noise.
4 Comparison of Oscillations in Radio and Optical in the Frequency Range of 3 – 5 mHz
S-comparison
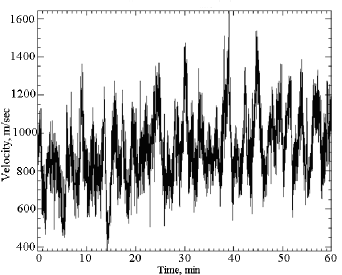
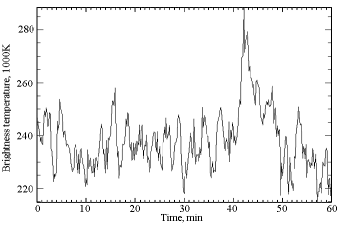
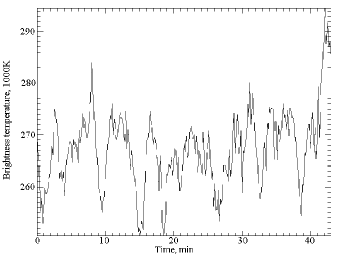
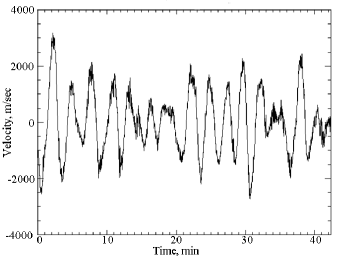
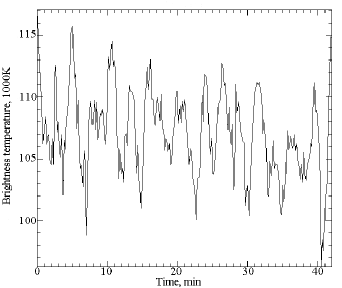
We used simultaneous observations of the temporal variations of sunspots in the optical and radio wavelength range covering periods from one to ten minutes. We measured the chromospheric LOS velocity by optical observations in the H line. At 1.76 cm radio wavelength the brightness of a radio source above a sunspot measures oscillations of the temperature inside the layer with a magnetic field of close to 2000 G. The comparison of the oscillations at different levels of the solar atmosphere can help us to find a physical interpretation of the observed phenomena.
a b
c d
e f
a b
c d
e f
a b
c d
e f
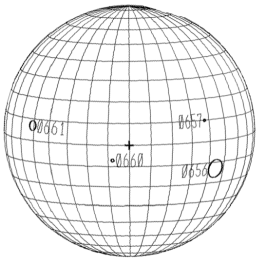
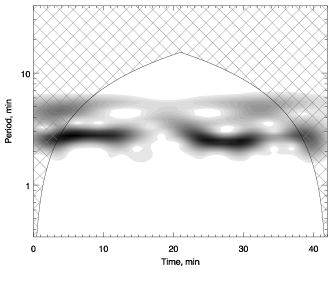
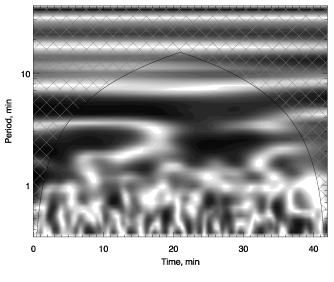
In spite of essential differences of the two methods of analysis, the comparison of the spectra of the radio and optical observations presents the possibility to study the appearance of the same oscillation process at two levels in the solar atmosphere. The identification of the oscillation mode is based on a comparison of the frequency and amplitude variations revealed by the wavelet transformation of the time series. In Figures \irefF-aug15– \irefF-aug18 the samples of this comparison are presented for three series of observations for AR661 (2004 August 15, 16, and 18).
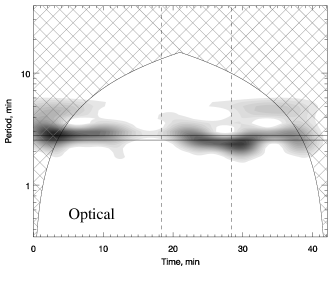
On 2004 August 18 the AR was situated near the center of the solar disk (at approximately 0.2 solar radius, see Figure \irefF-aug18). Here one can easily see an apparent similarity of the wavelet spectra obtained from optical and radio observations. For the other two days this is not the case. The difference is quite obvious and probably related to the position of the AR on the disk. The point is that the chromospheric LOS velocity can be easily measured when the AR is located close to the solar center. Then it reflects the motion of a wave toward the higher regions of the solar atmosphere. Therefore the radio emission at the base of the solar corona is affected by this motion. On the other hand, when the AR is far from the center of the solar disk, optical methods are mostly relevant for the study of oscillation modes across the magnetic tube of a sunspot, which are not clearly visible at the CCTR measured by radio methods. Some other possible reasons for the discrepancy will be discussed later. One should also bear in mind that our sets of observations lasted to 40 – 60 minutes, which is sufficiently long to study the instability of the three minute oscillations, but provides only limited possibilities for studying much longer periods.
For a number of cases our analysis confirmed that radio and optical spectra of oscillations agree better when the AR is located near the center of the solar disk. This peculiarity is typical for the three-minute and five-minute oscillations. It reflects MHD waves propagating along the magnetic tube of a sunspot. When the sunspot is situated near the center of the solar disk (the magnetic tube is directed toward the observer), we expect the absence of the emission at harmonics of the gyrofrequency. Accordingly there is no radiation at the very center of the sunspot, but farther out there is radiation, which is ring-shaped and turns into a horseshoe-shape away from the center of the solar disk [Gelfreikh and Lubyshev (1979), Nindos et al. (1996)]. The emission is generated at the side of the sunspot’s umbra where the magnetic field strength may still reach 2000 G. These differences may be caused by the above mentioned limitations in the radio image of sunspots and the limitations of the optical data, which measure only the longitude component of the velocity and only along the slit of the spectrograph.
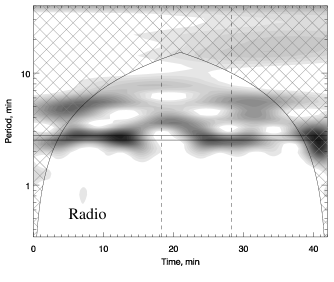
It is well known that most of oscillation processes observed in sunspots are unstable with a low level of the quality of oscillations. Both frequency and amplitude of oscillations vary with time. Many of the observed wave trains are only of a few periods length. To study the spectra, we used a wavelet transform. At the same time this instability opens a new approach to compare the parameters of the oscillations in two wavelength ranges, comparing not only the frequency, but also the coherence. Figure \irefF-aug18 gives a sample of the behavior. The identity in the length of trains and their oscillation periods prove that we register oscillations in the magnetic structure of a sunspot at the levels of the chromosphere and corona.
A detailed comparison of the wavelet radio and optical spectra (Figures \irefF-comparison – \irefcrosscorr) shows two trains of the three-minute oscillations with similar lengths and their periods. Figure \irefcross_wavelet depicts the cross-wavelet transform
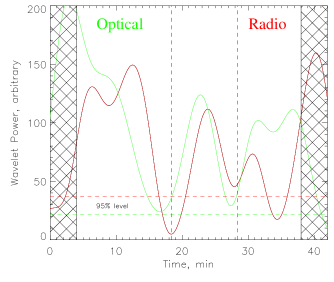
where and are wavelet transforms of time series and , is the time, is the scale of the wavelet, “” signifies the complex conjugate, and wavelet coherency (Torrence and Compo, 1998; Torrence and Webster, 1999) between optical and radio time series. Figure \irefcrosscorr shows the cross-correlation between power curves constructed by averaging wavelet power across frequencies 6.0 – 6.5 mHz (165 – 155 sec). To calculate the cross-correlation, we used the method proposed in \openciteBloomfield04 (figure 2 on page 939). It is quite evident that there is a shift in time between them. The radio oscillations happen some seconds after the optical. This result agrees well with the generally accepted idea that the three-minute oscillations show an MHD wave spreading upward in the corona [Lites (1992), Kobanov and Makarchik (2004a), Bogdan and Judge (2006)], its frequency is a result of filtration in a lower photospheric region. In our case the propagation velocity of these waves can be found from the observations at the level of the chromosphere and is equal to 60 km s-1 [Kobanov, Kolobov, and Makarchik (2006)]. The actual velocity may be even higher (bearing in mind the limitations of the method employed). Therefore the delay of 45 sec is interpreted as the time of propagation of the MHD wave from the chromosphere to the corona and suggests that the height of the CCTR is approximately 2700 km.
Concerning the horizontal phase velocity (60 km s-1) measured by us in a sunspot umbra, it is necessary to note that observations by Hinode (Nagashima et al., 2007) have also given similar results (about 50 km s-1). Within the scope of the “visual pattern” scenario the acoustic waves traveling upward with a velocity of about 10 km s-1 can cause this effect (\openciteKobanov08; see also \openciteBloomfield07).
a b
a b

c d
Space–time variations of the oscillations of LOS velocity are shown for three-minute oscillations (Figure \irefF-comparisona) and five-minute oscillations (Figure \irefF-comparisonb). Variations of the spectra are also presented in Figure \irefF-comparison (Radio – left and optical – right). The borders of the umbra and penumbra are marked by vertical lines in Figures \irefF-comparisona and b. The three-minute oscillations present three trains; all of them are within the umbra region, although in different positions. They are also present in the wavelet spectra in both radio and optical data. For five-minute oscillations we see five trains in optical picture, but only some of them can be identified with the radio spectra. The first in time train is definitely measured by the optical and radio method. It covers most part of the umbra region. About 2 – 3 minutes delay is observed in the radio fluctuation. The wave train at 30 minutes was identified in the radio spectra. In the optical observations the oscillations are registered in the penumbra region. This comparison is not obvious. The last five-minute oscillation train is measured only in the center of the sunspot. This region does not produce radio emission when observed at the center of the solar disk, possibly resulting in the observed peculiarity.
5 Low-Frequency Oscillations in Sunspots
S-Low-frequency
In contrast with the situation of the 3 – 5 minute oscillations, longer periods of 8 – 30 minutes are rarely reported. Nevertheless, one can confirm the presence of long-periodic motions in the penumbra [Lites (1992), Brisken and Zirin (1997)] or nearby [Kobanov (2000), Rouppe van der Voort (2003)]. It is worth mentioning that because of the concentration of low-frequency modes of oscillations at the outer regions of sunspots in optical observations, we find an apparent decrease of the frequency of running penumbral waves (RPW) from the center of a spot to outside.
Rimmele (1995) and Kobanov and Makarchik (2003) connected the 10 – 15 minutes oscillations with variations of the Evershed velocity. Studies of oscillations with frequencies of 1 – 1.5 mHz (periods of 11 – 17 minutes) made from space [Nagashima et al. (2007)] have shown the presence of oscillations even at the inner region of a penumbra in the intensity of the G band. The active region was a single round sunspot. The increased power of the above oscillations had the form of a ring surrounding the umbra.
We had 42-minutes of radio data simultaneous with the optical observations, which was long enough to find 8-minute and 16-minute oscillations, although without a detailed analysis of their stability. Long-period oscillations in the radio sources above sunspots are already known [Gelfreikh et al. (2006)].
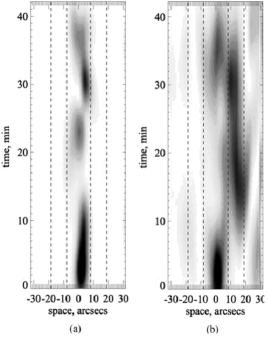
Results of the optical observations, including the distribution of oscillations across the spot, are illustrated in Figure \irefF-diagram. We can see that both the 8- and the 16-minute oscillations with a H Doppler velocity are more clearly visible outside the spot umbra, where the magnetic field is inclined in the direction of the observer. However, the strength of the field is evidently still powerful enough ( G) to produce radio emission. But because of the insufficient duration of the optical series the estimate of the time delay of the radio oscillations with respect to the optical ones are hardly reliable.
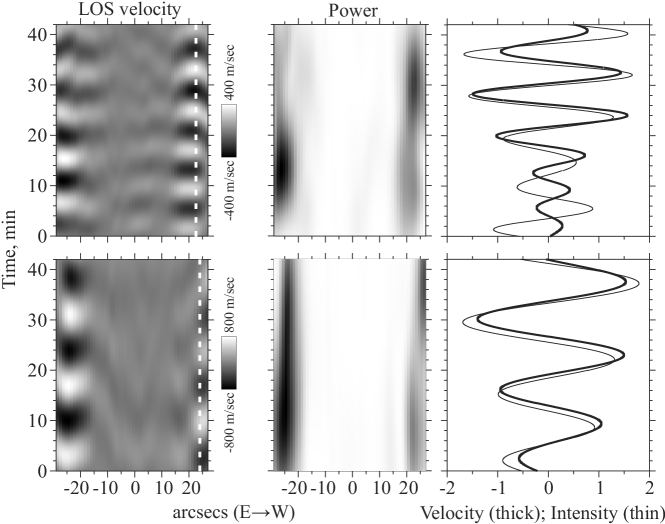
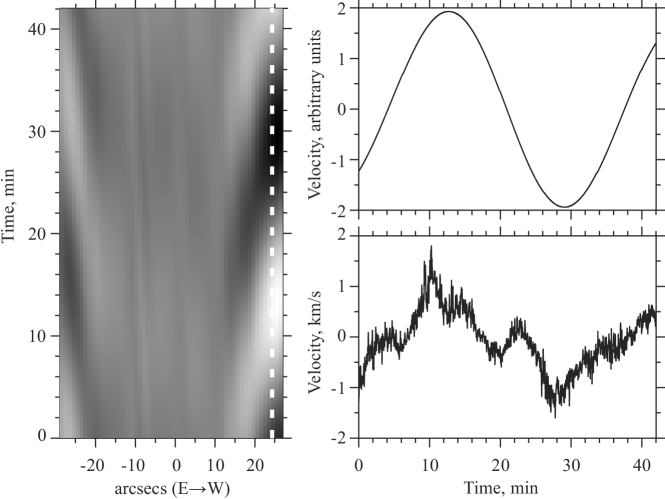
Low-frequency oscillations (1 – 2 mHz) in the Doppler velocity of the NOAA 661 were 22 – 25 arcsec from the center of the spot, at the east and west directions along the slit of the spectrograph, measured at the outer side of the penumbra of the sunspot. Figure \irefF-diagram presents the space–time diagrams of the Doppler velocity along the slit for the periods of 8.4 and 15 minutes. For the 15-minute oscillations the declination of the strips in the diagrams shows the propagating waves. In the eastern and western parts of the region the horizontal component of the motion is directed from the east to the west. For the 8.4 minute oscillations diagram the east part of the oscillations shows less inclined strips toward the horizontal direction than those in the west position, possibly because of standing waves. For the eight-minute oscillations the direction of horizontal propagation in the western part is inverse to the eastern one and coincides with the direction of Evershed effect in the chromosphere. The phase velocity estimate (horizontal component) gave the value of 30 – 50 km s-1. It is interesting that the intensity oscillations are practically in phase with the Doppler velocity oscillations. It is common knowledge that the phase lag between velocity and intensity is a quarter-period for the acoustic oscillations.
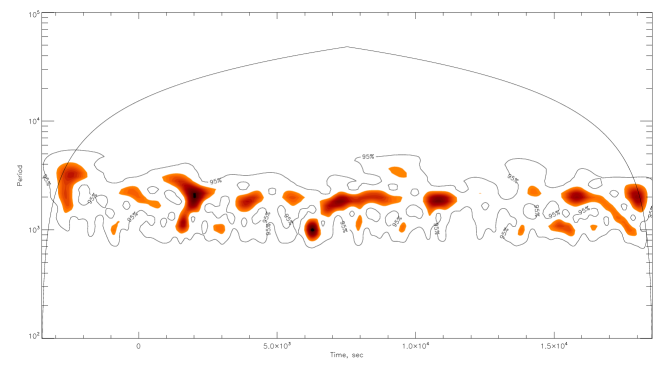
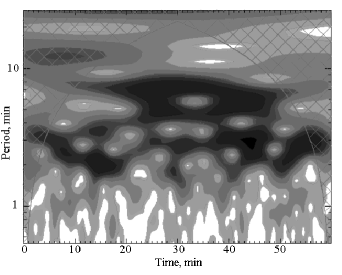
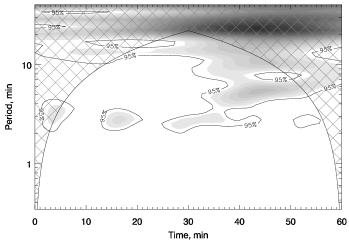
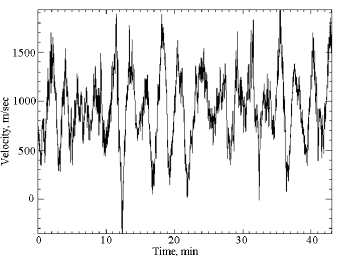
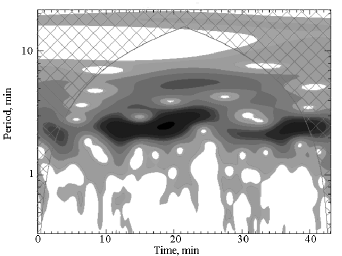
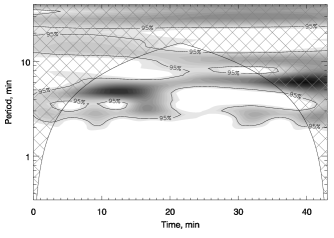
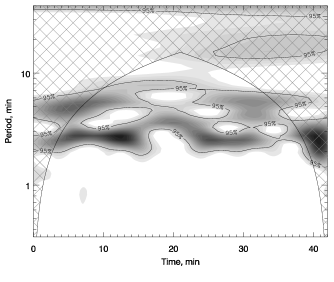
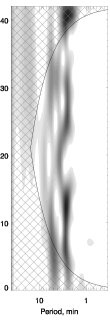
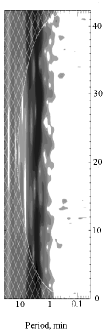
However, to obtain more conclusive information on the longer period oscillations we needed to analyze a longer period of observations, which was available at the radio observations at Nobeyama. The wavelet analysis of these observations is presented in Figure \irefF-wavelet. In these spectra one can clearly see the oscillations with periods of 15 – 16 and 30 – 32 minutes. Both modes are essentially non-stationary with minor variations of the amplitude and the period. An essential peculiarity of the quasi-periodic process is the strong similarity of the variations of parameters for both modes. The 30-minute oscillations happen with a delay of several minutes with respect to the 15-minute oscillations. Although the ratio of the frequencies of the two modes is not exactly equal to 2 (about 1.9), the similarity of the temporal variations of the two modes lead us to the conclusion that the 16-minute oscillations are the harmonic of the 30 – 32-minute oscillations. The delay in oscillations of the 30-minute mode may be the result of the propagation dispersion of the modes from the region of their simultaneous generation (owing to the difference in phase velocities of the MHD waves). The duration of the analyzed optical observations does not allow us to study the 32-minute wave. Nevertheless, the oscillations with this typical temporal variation is clearly registered (see Figure \irefF-long).
6 Discussion
S-Discussion
The above analysis of quasi-periodic oscillations measured at the chromospheric level in the H line and radio confirms the oscillations with periods from 160 to 200 seconds above sunspots in the lower corona [Brynildsen et al. (2002)]. They are certainly the counterpart of the three-minute oscillations studied by optical methods for several decades [Lites (1992)]. These oscillations at the level of the chromosphere observed in the H line were clearly shown. Their theory was developed by many authors [Zhugzhda and Dzhalilov (1982), Staude (1999), Zhugzhda, Balthasar, and Staude (2000)]. First they were considered to be oscillations of a magnetic tube resonator of sunspots limited by the CCTR and some surface below. Later developments in observations and in theory related them to propagating MHD waves that were filtered in frequency in some lower under-photospheric layer. The solution of the problem is far from clear.
To our knowledge, we present here for the first time the study of these MHD waves based on simultaneous optical and radio observations, which refer to coronal and chromospheric levels of the solar atmosphere. We investigated the sunspot oscillations at different levels of the solar atmosphere with a wavelet analysis for the physical type of oscillations measured in radio and optical wavelengths. We expected and measured some time delays of the radio emission resulting from the sunspots assumed propagation of the disturbance (MHD waves, probably) from the chromosphere to corona. These time delays were found to be about 50 seconds for the three-minute oscillations and a bit longer (about three minutes) for the five-minute oscillations.
In all cases of our analysis the position of the AR near the center of the solar disk resulted in a higher degree of similarity of the observed oscillation parameters found from the radio and optical methods. This situation looks natural if one takes into account that we compared velocity oscillations at photospheric and chromospheric levels (optical data) with oscillations at the CCTR or lower corona (radio observations). In optical observations the oscillations are more effectively seen at the longitude component of the velocity. When the AR is near the center of the disk, the optical observations show waves directed toward the upper layers of the solar atmosphere, where the registered radio emission above the sunspot is generated. However, in this case the central part of the magnetic tube of the sunspot is beyond the scope of the analysis because no emission at the harmonics of the gyro-frequency is then generated. At the edge of the umbra the magnetic fields are weaker and radio emission is generated at lower heights, possibly with a higher temperature gradient. Then the radio source normally has a ring structure reflecting the upper limit of the umbra region [Gelfreikh and Lubyshev (1979)]. For a radio source at a significant distance from the center of the solar disk the radio emission may be measured at the stronger central part of the sunspot umbra with a higher source temperature of the radio emission, but the optical observation of the LOS velocity presents effects mostly in a different direction of the wave propagation.
One important reason for the discrepancy of the radio and optical analysis of the observations is connected with the fact that in the optical data we analyzed only a one-dimensional scan of the spot, while in radio it was the sum of the radio emission along a ring or horseshoe structure. One cannot expect a strong symmetry in the oscillation process (see also some results shown above). The result is certainly an important factor for the differences between wavelet spectra in radio and optical observations. Besides the reasons of a methodical nature discussed above, the real differences in the oscillation processes and their spectra could be essentially caused by differences in plasma and magnetic structures. That different sunspots may show quite different spectra of oscillations, was found and illustrated before at the same wavelength [Gelfreikh et al. (2006)].
Longer oscillations in sunspots are also known, though in a much lower stage of analysis. Therefore we also explored this direction. For the radio data we could use observational data of the Nobeyama Radioheliograph of several hours length. In this case we detected clearly visible periods of oscillations, though of low coherence, slightly longer than 15 and 30 minutes. The obvious similarity of variations of amplitude and periods lead us to the conclusion about the common origin of these modes. The 15-minute mode may possibly be the harmonic of the longer one. In the present case we had only 42 minutes of observations of the same sunspot in the optical and radio ranges. The 15 – 16 minute oscillations are well measured. The 32-minute variation was also found. A detailed similarity of these oscillations at the chromosphere (optical) and the corona (radio) is impossible to determine from our data, in contrast to the results of our analysis of the three- and five-minute oscillations for the same sunspot. The 15-minute variations in the optical measurements are stronger in the penumbra region, although they are also present in the center of the umbra. Further studies with a longer duration of the optical measurements should be organized to solve the above uncertainties of the data comparisons. As the eight-minute oscillations in the chromosphere, their absence in the radio spectra possibly requires further analysis with special filtration to achieve higher sensitivity.
7 Conclusion
S-Conclusion
This work illustrates the recent progress in a new approach of studying oscillations of active regions, and sunspots especially, by comparing the parameters of the observed oscillations at different levels of the solar atmosphere. The value of the radio astronomical observations made with the Nobeyama Radioheliograph enables us to measure the temporal variations of the plasma parameters inside the sunspot magnetic tube at the basis of the corona. The regular daily observations cover more than 15 years with practically any desirable cadence. The comparison of these observations with those of the chromospheric velocity in H resulted in some new estimates of the 3D structures and dynamics of the oscillations in a sunspot.
It is generally accepted that MHD waves play an important role in the transfer and release of nonthermal energy in the solar atmosphere, therefore the QPOs present an interesting approach in analyzing the parameters of the plasma structures and their stability in the solar atmosphere. Knowledge of their properties is essential in the development of realistic theories of such fundamental processes as heating the corona, an accumulation and release of the energy in flares, CMEs, and similar processes, typical for our Sun and other stars. We showed the usefulness of developing and applying the necessary efforts in similar directions, covering the wide range of analyzed periods of oscillations and longer time intervals of analysis. The physical interpretation of the results requires more theoretical and modeling analysis.
Acknowledgements
This work is supported by RFBR grants 08–02–91860-RS-a, 06–02–16838 and 10-02-00153-a, and also grants by the Program of Support for Scientific Schools of the Russian Federation (NSh–6110.2008.2 and Nsh–2258.2008.2) and the Federal Agency for Science and Innovation (State Contract 02.740.11.0576). We are grateful to the anonymous referee for important remarks, which helped us to improve the paper.
Data used here from Mees Solar Observatory, University of Hawaii, are produced with the support of NASA grant NNG06GE13G.
Wavelet software was provided by C. Torrence and G. Compo, and is available at URL: http://paos.colorado.edu/research/wavelets/
References
- Beckers and Schultz (1972) Beckers, J.M., Schultz, R.B.: 1972, Sol. Phys. 27, 61.
- Bhatnagar, Livingston and Harvey (1972) Bhatnagar, A., Livingston, W.C., Harvey, J.W.: 1972, Sol. Phys. 27, 80.
- Bloomfield et al. (2004) Bloomfield, D.S., McAteer, R.T.J., Mathioudakis, M., Williams, D.R., and Keenan, F.P.: 2004, ApJ 604, 936.
- Bloomfield, Lagg, and Solanki (2007) Bloomfield, D.S., Lagg, A., Solanki, S.K.: 2007, ApJ 671, 1005.
- Brisken and Zirin (1997) Brisken, W.F., Zirin, H.: 1997, ApJ 478, 814.
- Bogdan (2000) Bogdan, T.J.: 2000, Sol. Phys. 192, 373.
- Bogdan and Judge (2006) Bogdan, T.J., Judge, P.G.: 2006, Phil. Trans. R. Soc. A. 364, 313.
- Brynildsen et al. (2002) Brynildsen, N., Maltby, P., Fredvik, T., Kjeldseth-Moe, O.: 2002, Sol. Phys. 207, 259.
- Gelfreikh and Lubyshev (1979) Gelfreikh, G.B., Lubyshev, B.I.: 1979, Soviet Ast. 23, 316.
- Gelfreikh et al. (1999) Gelfreikh, G.B., Grechnev, V.V., Kosugi, T., Shibasaki, K.: 1999, Sol. Phys. 185, 177.
- Gelfreikh et al. (2006) Gelfreikh, G.B., Nagovitsyn, Yu.A., Nagovitsyna, E.Yu.: 2006, PASJ 58, 29.
- Fludra (2001) Fludra, A.: 2001, A&A 368, 639.
- Kobanov (2000) Kobanov, N.I.: 2000, Sol. Phys. 196, 120.
- Kobanov and Makarchik (2003) Kobanov, N.I., Makarchik, D.V.: 2003, In: Pevtsov, A.A., Uitenbroek, H. (eds.), Current theoretical models and high resolution solar observations: preparing for ATST CS-286, Astron. Soc. Pas., San Francisco, 251.
- Kobanov and Makarchik (2004a) Kobanov, N.I., Makarchik, D.V.: 2004a, A&A 424, 671.
- Kobanov and Makarchik (2004b) Kobanov, N.I., Makarchik, D.V.: 2004b, Astron. Rep. 48, 954.
- Kobanov, Kolobov, and Makarchik (2006) Kobanov, N.I., Kolobov, D.I., Makarchik, D.V.: 2006, Sol. Phys. 238, 231.
- Kobanov, Kolobov, and Chupin (2008) Kobanov, N.I., Kolobov, D.I., Chupin, S.A.: 2008, Astron. Let. 34, 133.
- Lites (1992) Lites B.W.: 1992, In: Thomas, J.H., Weiss, N.O. (eds.), Sunspots: Theory and Observations, Kluwer, Dordrecht, 261.
- Lites et al. (1998) Lites, B.W., Thomas, J.H., Bogdan, T.J., Cally, P.S.: 1998, ApJ 497, 464.
- Nagashima et al. (2007) Nagashima, K., Sekii, T., Kosovichev, A.G., Shibahashi, H., Tsuneta, S., Ichimoto, K., Katsukawa, Y., Lites, B., Nagata, S., Shimizu, T., Shine, R.A., Suematsu, Y., Tarbell, T.D., Title, A.M.: 2007, PASJ 59, 631.
- Nakajima et al. (1994) Nakajima, H., Nishio, M., Enome, S., Shibasaki, K., Takano, T., Hanaoka, Y., Torii, C., Sekiguchi, H., Bushimata, T., Kawashima, S., Shinohara, N., Irimajiri, Y., Koshiishi, H., Kosugi, T., Shiomi, Y., Sawa, M., Kai, K.: 1994, Proc. IEEE 82, 705.
- Nindos et al. (1996) Nindos, A., Alissandrakis, C.E., Gelfreikh, G.B., Kundu, M.R., Dere, K.P., Korzhavin, A.N., Bogod, V.M.: 1996, Sol. Phys. 166, 55.
- Nindos et al. (2002) Nindos, A., Alissandrakis, C.E., Gelfreikh, G.B., Bogod, V.M., Gontikakis, C.: 2002, A&A 386, 386.
- Rimmele (1995) Rimmele, T.R.: 1995, ApJ 445, 511.
- Rouppe van der Voort (2003) Rouppe van der Voort, L.H.M.: 2003, A&A 397, 757.
- Shibasaki (2001a) Shibasaki, K.: 2001a, ApJ 550, 1113.
- Shibasaki (2001b) Shibasaki, K.: 2001b, ApJ 557, 326.
- Staude (1999) Staude, J.: 1999, In: Schmieder, B., Hofman, A., Staude J. (eds.), 3rd Advances in Solar Physics Euroconference: Magnetic Fields and Oscillations CS-184, Astron. Soc. Pas., San Francisco, 113.
- Torrence and Compo (1998) Torrence, C., Compo G.P.: 1998, Bull. Am. Meteo. Soc. 79, 61.
- Torrence and Webster (1999) Torrence, C., Webster P.J.: 1999, J. Climate 12, 2679.
- Zhugzhda and Dzhalilov (1982) Zhugzhda, Y.D., Dzhalilov, N.S.: 1982, ApJ 112, 16.
- Zhugzhda, Balthasar, and Staude (2000) Zhugzhda, Y.D., Balthasar, H., Staude, J.: 2000, ApJ 355, 347.