The large-scale diffuse radio emission in A781
Abstract
Context. A781 belongs to a complex system characterized by extended X-ray emissions that may form part of line of clusters of galaxies along a filament.
Aims. The aim of this work is to investigate the possible presence of extended, diffuse synchrotron radio emission connected to the intra-cluster medium of A781.
Methods. We studied the radio continuum emission and the spectral index properties in proximity of the A781 by analyzing archival Very Large Array observations at 1400 and 325 MHz.
Results. The main cluster of the system is permeated by diffuse low-surface brightness radio emission which is classified, being located close to the center, as a radio halo. The diffuse emission presents the typical extension and radio power of the other halos known in the literature. Interestingly, the radio halo appears to be linked to a peripheral patch previously found in the literature. The spectrum of this peripheral emission shows a radial steepening which may confirm that this source is indeed a cluster relic.
Key Words.:
Galaxies:cluster:general – Galaxies:cluster:individual:A781 – Magnetic fields – (Cosmology:) large-scale structure of Universe1 Introduction
An ever increasing number of galaxy clusters exhibits at its center a Mpc-scale synchrotron radio halo. These elusive sources are characterized by a low-surface brightness (Jy/arcsec2 at 1400 MHz) and steep-spectrum 111, with =spectral index (). They represent one of the best evidence for the presence of relativistic electrons and magnetic fields in the intra-cluster medium.
In the last decade several projects aimed to detect new radio halos have been performed (e.g. Giovannini et al. 1999, Giovannini & Feretti 2000, Kempner & Sarazin 2001, Govoni et al. 2001a, Bacchi et al. 2003, Venturi et al. 2007, Venturi et al. 2008, van Weeren et al. 2009, Rudnick & Lemmerman 2009, Giovannini et al. 2009). The investigation on the physical properties of radio halos and their hosting environments have improved our knowledge and led to the formulation of possible scenarios of their formation, which are still matter of debate (e.g. Brunetti et al. 2009, Enßlin et al. 2010). The radio halo morphology is often very similar to the X-ray emitting thermal intra-cluster medium (e.g. Govoni et al. 2001b, Feretti et al. 2001, Giacintucci et al. 2005). Furthermore, radio halos are preferentially found in clusters showing evidence of merger activity (e.g. Buote 2001, Schuecker et al. 2001, Govoni et al. 2004, Cassano et al. 2010), suggesting a connection between the origin of radio halos and gravitational processes of cluster formation, although a one-to-one association between merging clusters and radio halos is not supported by present observations. It is thus fundamental in this context to better investigate the radio emission from merging and X-ray luminous galaxy clusters.
As part of an ongoing program aimed to investigate in complex X-ray cluster systems the presence of halo emission, we recently found (Murgia et al. 2010) the first example of a double radio halo in the close pair of galaxy clusters A399 and A401. Motivated by the above discovery, we analyzed archival Very Large Array (VLA) radio observations of A781. This is an exceptional system, since combined X-ray and weak-lensing analysis (Wittman et al. 2006, Sehgal et al. 2008) indicate that A781 is really a complex of several clusters.
In this work we show how this system appears at the radio wavelengths. The paper is organized as follows: In Sect. 2 we describe the properties of the cluster. In Sect. 3 we present the radio observations, and the data reduction. In Sect. 4 we show the results of the total intensity and spectral index images and finally, in Sect. 5 we draw the conclusions.
Throughout this paper we assume a CDM cosmology with , , and . At the distance of A781 (z=0.3004, Geller et al. 2010), 1′′ corresponds to 4.4 kpc.
2 The A781 system
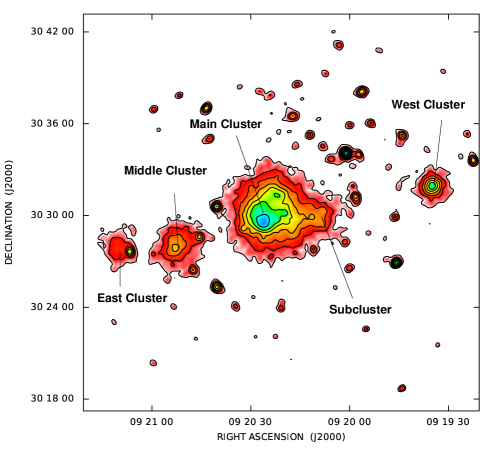
A781 belongs to a complex system characterized by extended X-ray sources that may form part of line of clusters along a filament (e.g. Jeltema et al. 2005). The X-ray surface brightness distribution of the system is shown in Fig. 1, where we present an image in the 0.212 keV band obtained with a recent XMM-Newton (MOS1+MOS2) exposure time of 80 ksec (Obs. id: 0401170101). As previously pointed out by Sehgal et al. (2008), the X-ray image reveals that A781 consists of a large main (“Main”) cluster connected to a sub-cluster. In addition, two smaller clusters to its east (“Middle” and “East”), and one to its west (“West”) are in seen at a relatively small separation on the sky. The X-ray and weak-lensing analysis by Sehgal et al. (2008) suggests that the “Main” cluster may be undergoing a merger with the “Subcluster” to southwest, while the other clusters are rather relaxed. We note that the redshift of the “Middle” cluster (z=0.2915) is quite similar to that of the “Main” cluster (z=0.3004). On the other hand, the “East” and the “West” clusters have different redshifts (z=0.4265 and z=0.4273 respectively; Geller et al. 2010), therefore they are not related to the main cluster of the system.
The A781 system was observed with the Giant Metrewave Radio Telescope at 610 MHz by Venturi et al. (2008). An interesting peripheral patch of diffuse emission, with no obvious optical counterpart, peaking at R.A.(J2000)=09h20m32.2s Decl.(J2000)=30∘27′34.2′′ has been detected, and the authors suggested that it might be a relic source, but no hint of radio halo emission was found.
The presence of diffuse cluster-scale radio emission close to the “Main” cluster X-ray centroid, indicative of a radio halo, was suggested by Rudnick & Lemmerman (2009), by reprocessing radio images from the Westerbork Northern Sky Survey (WENSS, Rengelink et al. 1997) at 327 MHz.
3 VLA observations and data reduction
| Source | R.A. | Decl. | Frequency | Bandwidth | Conf. | Time | Date | Program |
| (J2000) | (J2000) | (MHz) | (MHz) | (minutes) | ||||
| A781 | 09 20 23.7 | 30 31 09.0 | 1365/1435 | 73.125 | A | 30 | 1994 April 19 | AB699 |
| 09 20 22.6 | 30 31 20.6 | 1452/1502 | 25 | C | 8 | 1984 May 4 | AO048 | |
| 09 20 23.7 | 30 31 09.0 | 1365/1435 | 73.125 | D | 15 | 1995 March 15 | AM469 | |
| 09 14 36.0 | 29 44 52.0 | 327.5/321.6 | 640.048 | B | 49 | 2005 May 21 | AD509 | |
| 09 14 36.0 | 29 44 52.0 | 327.5/321.6 | 640.048 | C | 183, 17 | 2005 Sept. 29, Oct. 3 | AD509 | |
| 09 14 36.0 | 29 44 52.0 | 327.5/321.6 | 640.048 | D | 88, 96, 20 | 2005 Dec. 4, 9, 12 | AD509 | |
| Col. 1: Source; Col. 2,3: Pointing position (R.A., Decl.); Col. 4: Observing frequency; Col. 5: Observing Bandwidth; | ||||||||
| Col. 6: VLA configuration; Col. 7: Time on source; Col. 8: Dates of observation; Col. 9: VLA program. | ||||||||
Because of the peculiar X-ray morphology of this complex system and previous radio results, we investigated the radio continuum emission in proximity of the A781 system at 1400 and 325 MHz. The details of the radio observations are given in Table 1. Calibration and imaging were performed with the NRAO Astronomical Image Processing System (AIPS) package.
3.1 Observations at 1400 MHz
We analyzed archival VLA observations at 1400 MHz in A, C, and D configuration. The data were calibrated in phase and amplitude. Data editing has been made in order to excise radio frequency interferences (RFI). In the A and D configuration the observations were done in spectral line mode therefore, the data were calibrated in bandpass and the data editing was done channel by channel. Surface brightness images were produced following the standard procedures: Fourier-Transform, Clean, and Restore implemented in the AIPS task IMAGR. We used the Multi-scale CLEAN (see e.g. Greisen et al. 2009), an extension of the classical Clean algorithm, implemented in the task IMAGR. We averaged the 2 IFs (and the 7 channels in the D and A configuration) together in the gridding process under IMAGR. Self-calibration (phase) was performed to increase the dynamic range and sensitivity of the radio images.
A polarization sensitive image has been produced by using the C configuration data-set (the spectral line mode of the A and D configuration is not suitable for this purpose).
3.2 Observations at 325 MHz
There are no pointed low frequency VLA observations of A781. However, the cluster falls within the field of view (at a distance of 1.5° from the pointing) of the project AD509, which consists of archival observations at 325 MHz in B, C, and D configuration. The data were collected in spectral line mode with a total bandwidth of 3.1 MHz, subdivided into 64 spectral channels. The flux density scale and the bandpass were calibrated by using 3C48 (3C147 in B configuration). The source 0909+428 was used as phase calibrator. Task FLGIT was applied to automatically remove data with strong RFI (about 20-30% of the data were typically flagged). The data was averaged to 10 channels (with a width of 0.3 MHz), keeping the effects of bandwidth smearing under control. Low-level residual RFI were carefully removed from the 10 channels data-set by visually inspection and finally the data were extracted with task SPLIT and imaged. We processed the data-sets separately applying several cycles of imaging and self-calibration, to remove residual phase variations. All the data-sets were then combined together with task DBCON and we performed a final self-calibration run. The area was imaged in facets (Cornwell & Perley 1992) of slightly overlapping fields in order to account for the non-coplanarity of the incoming wavefront within the large primary beam of . The deconvolution was performed with a Multi-scale CLEAN.
4 Results
We analyze the results of the VLA observations with a particular emphasis on the analysis of the radio properties of the large-scale diffuse cluster emission.
4.1 Cluster radio emission at 1400 MHz
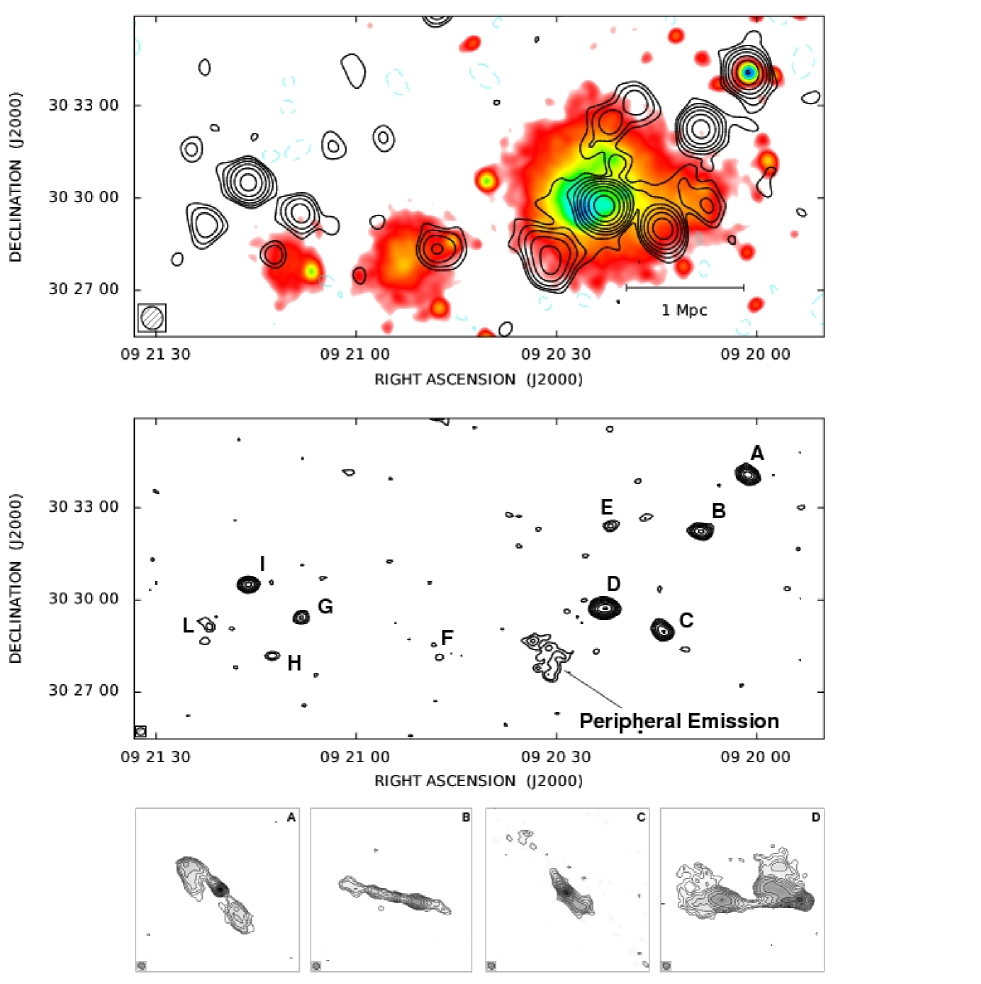
The radio iso-contours at 1400 MHz of the ”Main”, “Middle” and “East” cluster of the system are shown in the top panel of Fig. 2. This image has been obtained with the VLA in D configuration and has a FWHM beam of 41.6′′44.8′′. In order to compare radio and X-ray cluster emission, the radio iso-contours are overlaid on the XMM-Newton image presented in Fig. 1. We find that the central region of the “Main” cluster is permeated by diffuse low-surface brightness emission which we classified as a radio halo. The radio halo appears to be linked to the brighter peripheral patch previously found by Venturi et al. (2008). In addition, the diffuse radio emission of the “Main” cluster is elongated toward the “Subcluster”. As measured from the 3- radio isophote, the overall diffuse emission has an angular extension of about 7′ ( Mpc at the cluster distance).
To separate the diffuse radio emission from discrete sources we produced images at higher resolution. In the middle panel of Fig. 2 we present the radio iso-contours of A781, taken with the VLA in C configuration. This image has a FWHM beam of 13.2′′16.5′′. Although the relatively high resolution of this image is not particularly suitable to detect diffuse cluster emission, the peripheral patch of diffuse emission is clearly visible in the C array data-set too. The discrete sources are labelled in the figure and their position and flux densities are given in Table 2. All of them show an optical counterpart in the Sloan Digital Sky Survey (see bottom left panel of Fig. 3). The only exception is source B, which may be a background radio galaxy. Source D, which is located about 50′′ west to the X-ray peak of the “Main” cluster, is the brightest radio source in the field. Its fractional polarization is 3%. The other discrete sources embedded in the halo have a fractional polarization below the 3- noise level. The peripheral diffuse emission appears unpolarized too and given that its surface brightness is 0.5 mJy beam-1, and the sensitivity (1-) of the linear polarization image is 0.08 mJy beam-1, we can just set a loose 3- upper limit to the fractional polarization of 48%, consistent with the values found for other relic sources.
The image obtained with the VLA in A configuration has a FWHM beam of 1.2′′1.4′′ and, in agreement with the C array configuration, confirms that just a few discrete sources are present in the field. Among the discrete sources, those labelled with A, B, C and D (shown in the bottom panel of Fig. 2) are extended. While A, C, and D show the typical morphology of “head-tail” radio sources in cluster, source B shows a straight “naked-jet” morphology.
The total flux density in the region of the “Main” and “Subcluster” is 1194 mJy. By subtracting the flux density of the embedded discrete sources C, D, and E as derived in the C configuration data-set (see Table 2), a flux density of 365 mJy appears to be associated with the low brightness diffuse emission. This flux density value corresponds to a radio power W Hz-1. A781 is part of the ROSAT Brightest Cluster sample by Ebeling et al. (1998). Its X-ray luminosity in the 0.1-2.4 keV band is erg/sec. The radio power , the radio largest linear size (), and the X-ray luminosity (), are in agreement with the and relations known for the other halos in clusters. The peripheral patch alone has a flux density 15.50.5 mJy. Thus, if we consider the radio halo separated by the peripheral patch it results in a flux density of 20.55 mJy. This value correspond to a radio power W Hz-1 , still in agreement with the and relations known in the literature (see e.g. Giovannini et al. 2009).
The flux densities were calculated, after the primary beam correction, by integrating the total intensity surface brightness, down to the 3 level. However, we note that the residual flux density associated with the diffuse cluster emission must be interpreted with caution because of a possible variation in the discrete sources flux density, the slightly different frequency of the two data-sets, and any absolute calibration error between the two data-sets could cause in an under or over subtraction of flux. In addition, due to the short exposure time of the archival observations, some diffuse emission could be missed. Therefore, a deep follow-up investigation would be necessary to ensure to recover all the radio flux and to unambiguously separate the emission of the diffuse emission from that of the unrelated discrete sources.
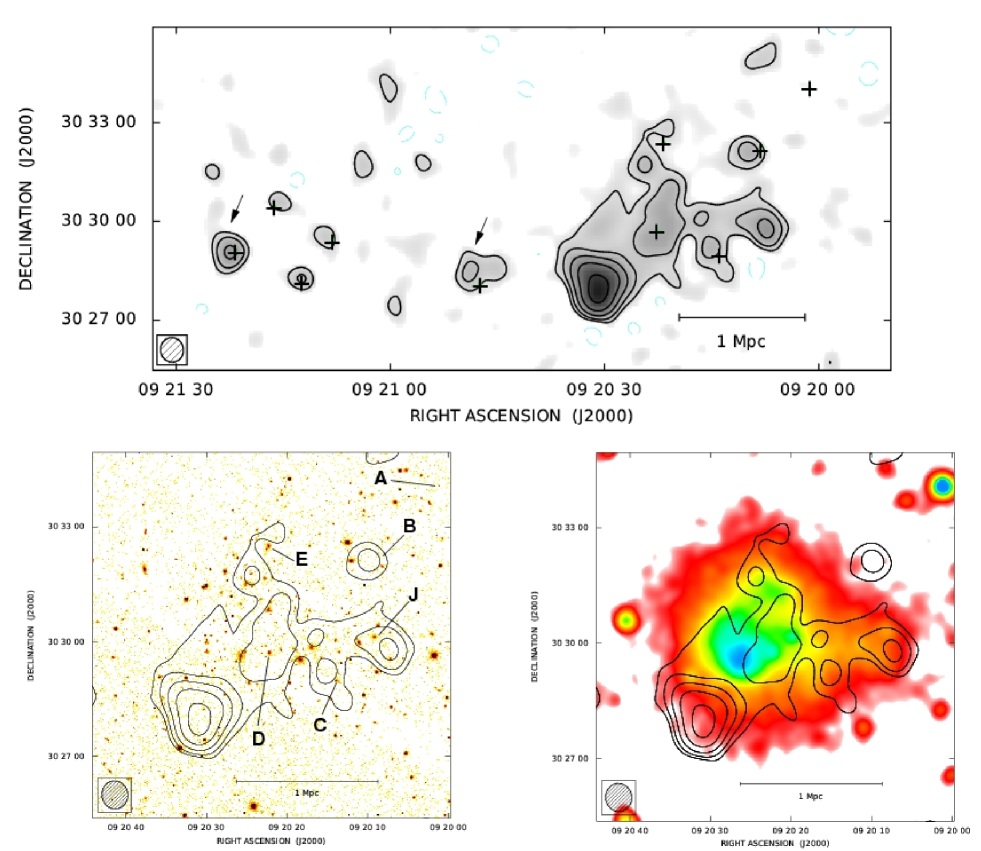
To ensure that the large-scale diffuse emission is not due to the blending of discrete sources, we present the total intensity radio contours at 1400 MHz with the VLA in D configuration in the top panel of Fig. 3, after subtraction of discrete sources. To obtain it, we produced an image of the discrete sources by using only the longest baselines of the D configuration data-set, and uniform weighting. The clean components of this image were then subtracted in the uv-plane by using the AIPS task UVSUB. The image with the discrete sources subtracted confirms the presence of a low-surface brightness radio halo at the cluster center connected to a brighter patch of peripheral emission to the south-east.
In the bottom panel of Fig. 3 we show a zoom of the “Main” cluster in which the total intensity radio contours, after subtraction of discrete sources, are overlaid on the red image of the Sloan Digital Sky Survey (left) and on the XMM X-ray image (right). In this figure it is further clear that the elongation of the radio emission versus west is located in coincidence with the “Subcluster”. We note that this feature is visible at 1400 MHz in the D configuration data-set only, while in the higher resolution images presented here, and in the FIRST image (Becker, White & Helfand 1995), any discrete source seems to be present. On the other hand, in this location a source, classified as a discrete source, is detected in GMRT images at 610 MHz (Venturi et al. 2008) and at 327 MHz (Giacintucci et al. 2010).
We note that, hints of possible diffuse emission (indicated by arrows in the top panel of Fig. 3), left after the subtraction process, are present on east of the “Main” cluster. These diffuse radio emissions might trace the process of a large-scale structure formation, where cosmic shocks originated by complex merger events are able to amplify magnetic fields and accelerate synchrotron electrons along a cluster filament, although a deeper observation is required to confirm the presence of these faint emissions.
| Label | R.A. | Decl. | S1400MHz |
| (J2000) | (J2000) | (mJy) | |
| A | 09 20 01.3 | 30 34 05 | 21.1 0.6 |
| B | 09 20 08.3 | 30 32 15 | 14.9 0.5 |
| C | 09 20 14.0 | 30 29 00 | 14.7 0.5 |
| D | 09 20 22.7 | 30 29 45 | 67.0 2.0 |
| E | 09 20 21.9 | 30 32 25 | 1.5 0.05 |
| F | 09 20 48.6 | 30 28 36 | 1.0 0.03 |
| G | 09 21 08.3 | 30 29 26 | 3.9 0.1 |
| H | 09 21 12.7 | 30 28 11 | 1.5 0.05 |
| I | 09 21 16.2 | 30 30 31 | 20.7 0.6 |
| L | 09 21 22.2 | 30 29 11 | 2.5 0.08 |
| Col. 1: Source label; Col. 2, 3: Source position | |||
| (R.A., Decl.); Col. 4: Source flux density at 1400 MHz. | |||
4.2 Cluster radio emission at 325 MHz
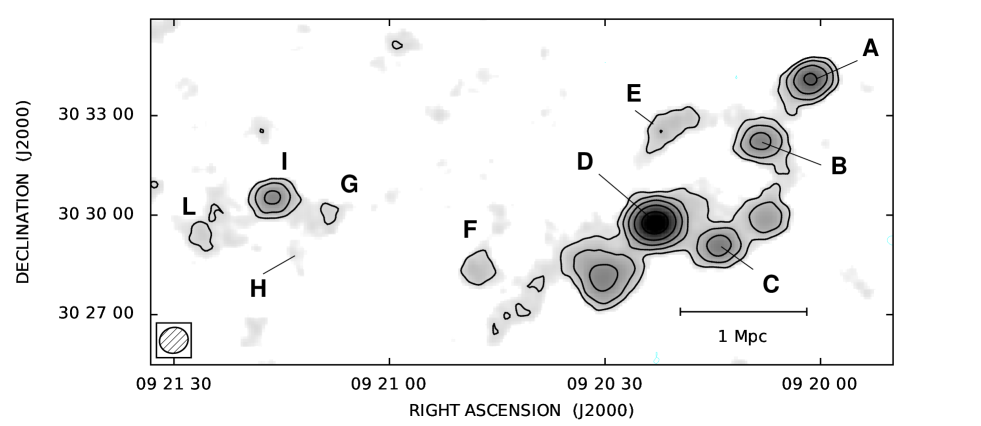
In Fig. 4 we show the radio iso-contours of A781 at 325 MHz. This image has been obtained by combining the VLA data in B, C, and D configuration. The resulting image has a FWHM beam of 46.1′′52.0′′. The VLA image has an angular resolution similar to the tapered GMRT image at 327 MHz presented by Giacintucci et al. (2010), and displays the same structures.
Most of the features visible at 1400 MHz are also present at 325 MHz. In particular, the south-east peripheral patch and all the discrete sources, with the only exception of the source H, are clearly detected. There is a hint of diffuse emission on the right of source D, although most of the radio halo emission visible at 1400 MHz is missing at 325 MHz, likely because of the lower sensitivity of the low-frequency image. The only feature which appears to be comparatively brighter at 325 MHz is the emission in coincidence with the “Subcluster”. As we will see in the next Section, this feature is characterized by a very steep radio spectrum.
By excluding the peripheral patch, the radio halo has a flux density at 1400 MHz of S20.5 mJy. In the same area of about 1Mpc2, the upper limit to the flux density at 325 MHz is S137 mJy. This limit has been calculated by considering that the surface brightness of the halo, in the primary beam corrected image, is everywhere lower than the 3 noise level (i.e. 6.6 mJy beam-1). Thus, we derive an upper limit to the global halo spectral index of 1.3.
4.3 Spectral index analysis
In this section we present the spectral index image of A781 between 325 MHz and 1400 MHz. In order to be properly compared, the two images have been corrected for the primary beam attenuation of the VLA antennas, regridded to the same geometry, and convolved to a common resolution of 53′′53′′. We stress, however, that the original resolutions of the two images were already very close not just due to the tapering of the uv-data but because of the very similar intrinsic coverage of the relevant spatial frequencies. We do not present the spectral index image after subtraction of discrete sources because of the low sensitivity of the 325 MHz image.
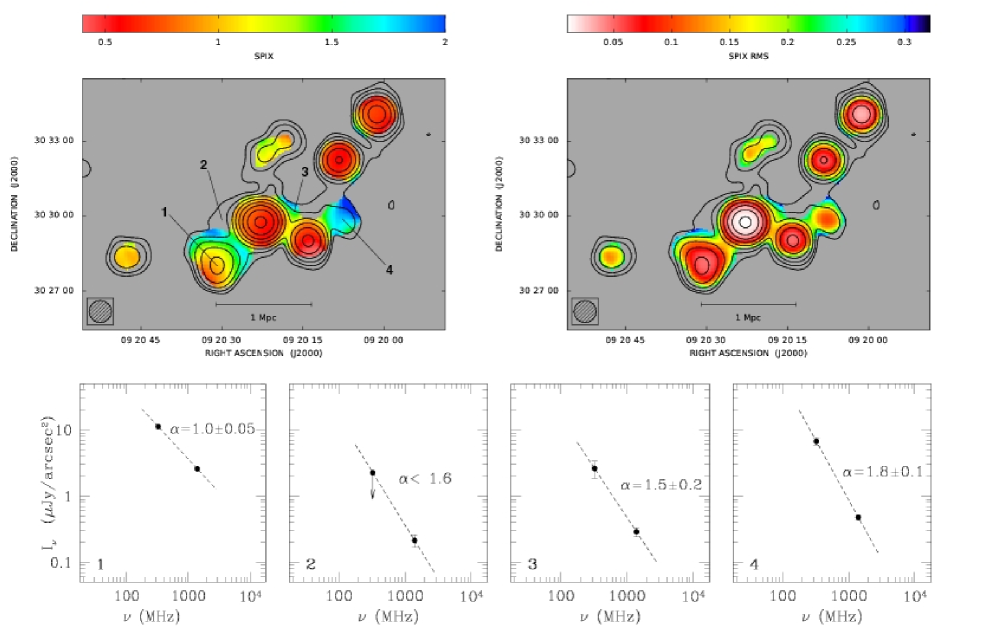
In the top panel of Fig. 5, we present the spectral index (left) and the spectral index uncertainty (right) images between 325 and 1400 MHz with the 1400 MHz radio iso-contours (primary beam corrected) overlaid. They are calculated only on those pixels whose brightness is above the level at both frequencies. The spectral index values ranges between 0.5 and 2, while the corresponding errors are in the range 0.020.25. The discrete sources have a typical spectral index value of , only the source F has a steep spectrum with =1.00.2. In the bottom panel of Fig. 5 we show the spectrum between 325 MHz and 1400 MHz in four sample positions.
The spectral index of the diffuse emission is clearly determined mainly in coincidence with the peripheral patch and the “Subcluster” (see positions 1 and 4 in Fig. 5). The peripheral patch shows a clear spectral index trend from 0.90.1, in the south-est tip, to 1.60.2, close to the source D. The radio elongation in coincidence with the “Subcluster” has an extremely steep spectrum with 1.80.1, which gives indication about the nature of this emission (see Sect. 5.2).
5 Discussion and Conclusion
Confirming the suggestion by Rudnick & Lemmerman (2009),
we find that the central region of the “Main” cluster of A781
is permeated by diffuse low-surface brightness
radio emission, which is classified as a radio halo.
The radio halo is clearly detected at 1400 MHz while most
of its emission is missing at 325 MHz, likely because of the
lower sensitivity of the low-frequency image.
At 1400 MHz, the diffuse emission presents the typical
extension and radio power of the other halos known in literature.
In addition, two interesting features are found:
1) the radio halo is spatially connected to a
peripheral diffuse patch, previously
discovered by Venturi et al. (2008);
2) the cluster radio emission shows an
elongation toward the “Subcluster”.
5.1 The peripheral diffuse patch
The peripheral patch may be interpreted as part of the halo or as a radio relic (as suggested by Venturi et al. 2008 and Giacintucci et al. 2010). Radio relics are commonly defined as elongated diffuse cluster radio emission not associated with the cluster center (e.g Giovannini & Feretti 2004). They are usually interpreted as linked to the presence of shock waves that propagate in the intra-cluster medium during the process of cluster formation (e.g. Enßlin et al. 1998, Enßlin & Gopal-Krishna 2001, Hoeft & Brüggen 2007). Relics formation models predict a steepening of the radio spectral index toward the cluster center, and a high degree of polarization (e.g. Clarke & Enßlin 2006, Bonafede et al. 2009, van Weeren et al. 2010). In the case of the peripheral patch emission of A781, the poor upper limit in the fractional polarization does not permit to derive useful information. However, its location and its radio spectrum, which steepens toward the cluster center, may favour a relic origin for this emission.
5.2 The radio emission of the “Subcluster”
The diffuse radio emission of the “Main” cluster is elongated toward the “Subcluster”, in a very similar way as the X-ray emission. The spectral index image reveals that the right end of this elongation has a very steep spectral index of 1.80.1. This emission seems to be really diffuse at 1400 MHz, since no point source is detected in this position neither in the C array nor in the A array image. Since this extreme steep spectrum is not compatible with an active galaxy, a possibility is that this may be a dying radio galaxy (e.g. Murgia et al. 2011). If this is the case, the optical progenitor could be the galaxy labelled J in the bottom left panel of Fig. 3. Venturi et al. (2008) found a faint radio counterpart associated to this galaxy with the GMRT at 610 MHz. Note, however, that the peak of the emission at 1400 MHz is not precisely coincident with the galaxy J. Indeed, another possibility is that this emission is part of the radio halo or even a steep spectrum halo connected with the “Subcluster”.
5.3 Tracing the diffuse radio emission along a cluster filament
In addition to the diffuse radio emission related to the “Main” and the “Subcluster”, on a larger scale, there are also some hints of diffuse emission elongated versus east. The nature of these faint patches, which are left after the subtraction of the discrete sources, is however rather uncertain in view of the current data. Nevertheless, if confirmed, the presence of these patches of diffuse emission may trace the process of a large-scale structure formation, where cosmic shocks originated by complex merger events are able to amplify magnetic fields and accelerate synchrotron electrons along a large-scale filament of the cosmic web.
Acknowledgements.
We thank the anonymous referee for the suggestions that improved the presentation of the paper, and Luigina Feretti for the support and the helpful discussions. This research was partially supported by PRIN-INAF 2009. The National Radio Astronomy Observatory (NRAO) is a facility of the National Science Foundation, operated under cooperative agreement by Associated Universities, Inc. Funding for the SDSS and SDSS-II has been provided by the Alfred P. Sloan Foundation, the Participating Institutions, the National Science Foundation, the U.S. Department of Energy, the National Aeronautics and Space Administration, the Japanese Monbukagakusho, the Max Planck Society, and the Higher Education Funding Council for England. The SDSS Web Site is http://www.sdss.org/. This research made use of Montage, funded by the National Aeronautics and Space Administration’s Earth Science Technology Office, Computational Technnologies Project, under Cooperative Agreement Number NCC5-626 between NASA and the California Institute of Technology. The code is maintained by the NASA/IPAC Infrared Science ArchiveReferences
- (1) Bacchi, M., Feretti, L., Giovannini, G., Govoni, F. 2003, A&A, 400, 465
- (2) Becker, R. H., White, R. L., & Helfand, D. J. 1995, ApJ, 450, 559
- (3) Bonafede, A., Giovannini, G., Feretti, et al. 2009, A&A, 494, 429
- (4) Brunetti, G., Cassano, R., Dolag, K., & Setti, G. 2009, A&A, 507, 661
- (5) Buote, D. A. 2001, ApJ, 553, L15
- (6) Cassano, R., Ettori, S., Giacintucci, S., et al. 2010 ApJ, 721, L82
- (7) Clarke, T. E., & Ensslin, T. A. 2006, AJ, 131, 2900
- (8) Cornwell, T. J., & Perley, R. A. 1992, A&A, 261, 353
- (9) Ebeling, H., Edge, A.C., Böhringer, H., et al. 1998, MNRAS, 301, 881
- (10) Enßlin, T. A., Biermann, P. L., Klein, U., & Kohle, S. 1998, A&A, 332, 395
- (11) Enßlin, T. A., & Gopal-Krishna 2001, A&A, 366, 26
- (12) Enßlin, T. A., Pfrommer, C., Miniati, F., & Subramanian, K. 2010, arXiv:1008.4717
- (13) Feretti, L., Fusco-Femiano, R., Giovannini, G., & Govoni, F. 2001, A&A, 373, 106
- (14) Geller, M. J., Kurtz, M. J., Dell’Antonio, I. P., et al. 2010, ApJ, 709, 832
- (15) Giacintucci, S., Venturi, T., Brunetti, G., et al. 2005, A&A, 440, 867
- (16) Giacintucci, S., et al., 2010, presented at the NtGC2010 conference, http://dl.dropbox.com/u/15734330/talks/giacintucci.pdf
- (17) Giovannini, G., Tordi, M., & Feretti, L. 1999, New A, 4, 141
- (18) Giovannini, G., & Feretti, L. 2000, New A, 5, 335
- (19) Giovannini, G., & Feretti, L. 2004, Journal of Korean Astronomical Society, 37, 323
- (20) Giovannini, G., Bonafede, A., Feretti, L., et al. 2009, A&A, 507, 1257
- (21) Govoni, F., Feretti, L., Giovannini, G., et al. 2001a, A&A, 376, 803
- (22) Govoni, F., Enßlin, T. A., Feretti, L., & Giovannini, G. 2001b, A&A, 369, 441
- (23) Govoni, F., Markevitch, M., Vikhlinin, A., et al. 2004, ApJ, 605, 695
- (24) Greisen, E. W., Spekkens, K., & van Moorsel, G. A. 2009, AJ, 137, 4718
- (25) Hoeft, M., & Brüggen, M. 2007, MNRAS, 375, 77
- (26) Jeltema, T.E., Canizares, C.R., Bautz, M.W., & Buote, D.A. 2005, ApJ, 624, 606
- (27) Kempner, J. C., & Sarazin, C. L. 2001, ApJ, 548, 639
- (28) Murgia, M., Govoni, F., Feretti, L., & Giovannini, G. 2010, A&A, 509, A86
- (29) Murgia, M., Parma, P., Mack, K.-H., et al. 2011, A&A, 526, A148
- (30) Rengelink, R.B., Tang, Y., de Bruyn, A.G., et al. 1997, A&AS, 124, 259
- (31) Rudnick, L., & Lemmerman, J. A. 2009, ApJ, 697, 1341
- (32) Schuecker, P., Böhringer, H., Reiprich, T. H., & Feretti, L. 2001, A&A, 378, 408
- (33) Sehgal, N., Hughes, J. P., Wittman, D., et al. 2008, ApJ, 673, 163
- (34) van Weeren, R. J., Röttgering, H. J. A., Brüggen, M., & Cohen, A. 2009, A&A, 508, 75
- (35) van Weeren, R. J., Röttgering, H. J. A., Brüggen, M., & Hoeft, M. 2010, Science, 330, 347
- (36) Venturi, T., Giacintucci, S., Brunetti, G., et al. 2007, A&A, 463, 937
- (37) Venturi, T., Giacintucci, S., Dallacasa, D., et al. 2008, A&A, 484, 327
- (38) Wittman, D., Dell’Antonio, I.P., Hughes, J.P., et al. 2006, ApJ, 643, 128